

Randomized Trials With Repeatedly Measured Outcomes: Handling Irregular and Potentially Informative Assessment Times
- PMID: 36259969
- PMCID: PMC10362939
- DOI: 10.1093/epirev/mxac010
Randomized Trials With Repeatedly Measured Outcomes: Handling Irregular and Potentially Informative Assessment Times
Abstract
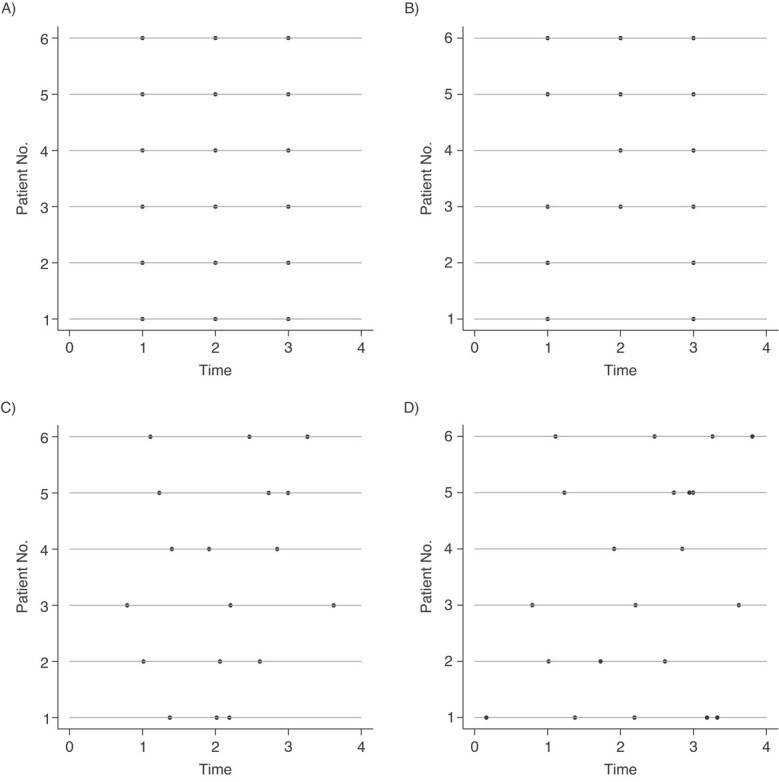
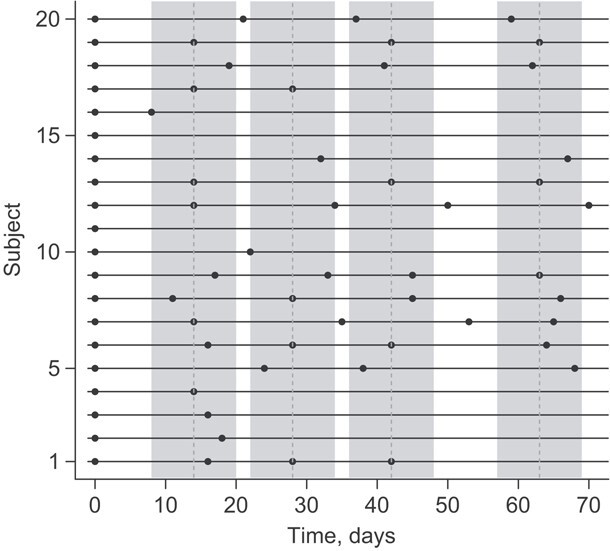
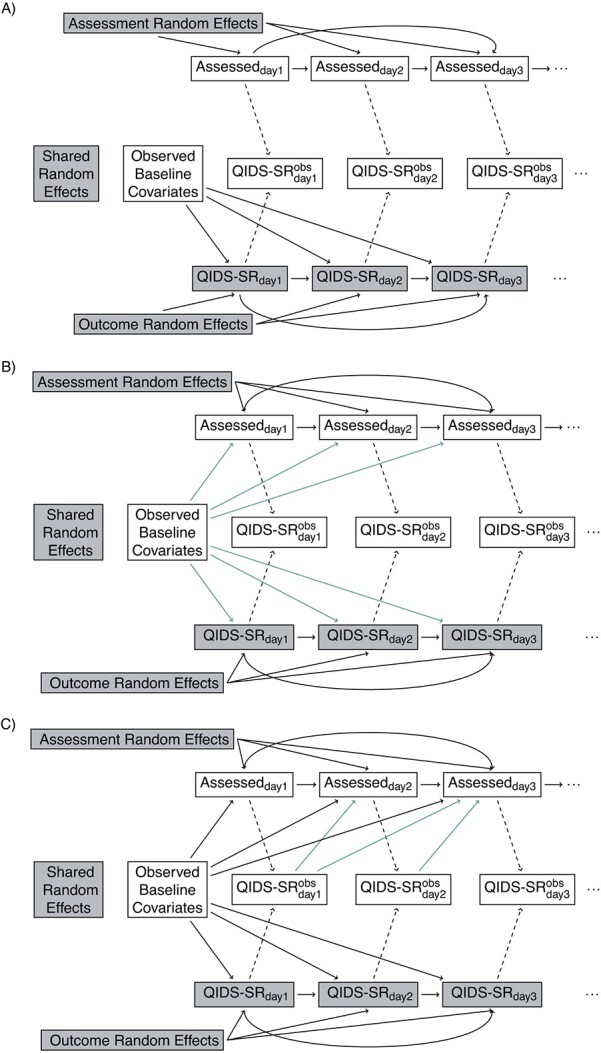
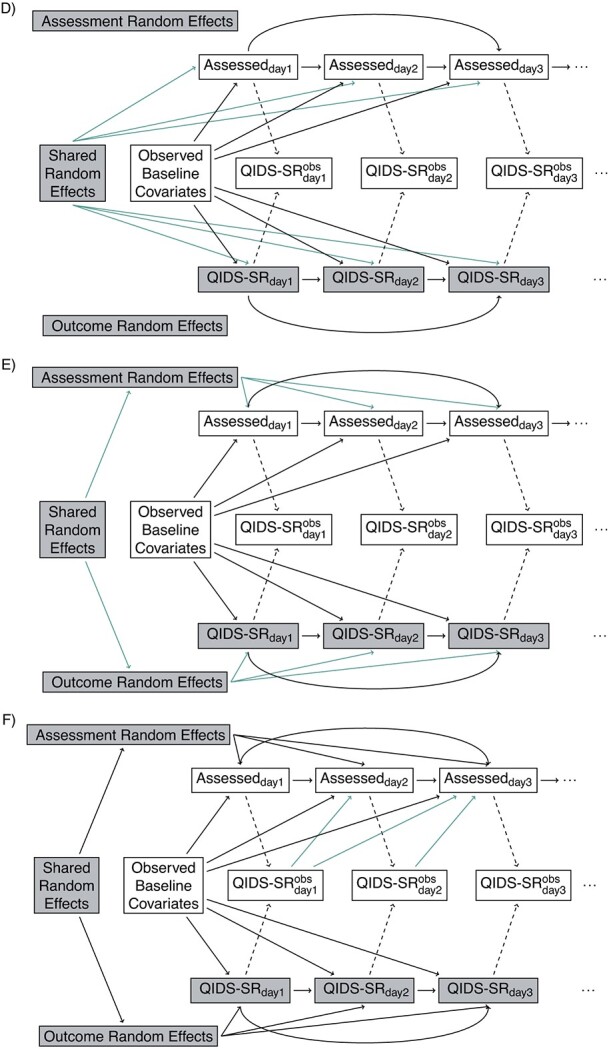
Randomized trials are often designed to collect outcomes at fixed points in time after randomization. In practice, the number and timing of outcome assessments can vary among participants (i.e., irregular assessment). In fact, the timing of assessments may be associated with the outcome of interest (i.e., informative assessment). For example, in a trial evaluating the effectiveness of treatments for major depressive disorder, not only did the timings of outcome assessments vary among participants but symptom scores were associated with assessment frequency. This type of informative observation requires appropriate statistical analysis. Although analytic methods have been developed, they are rarely used. In this article, we review the literature on irregular assessments with a view toward developing recommendations for analyzing trials with irregular and potentially informative assessment times. We show how the choice of analytic approach hinges on assumptions about the relationship between the assessment and outcome processes. We argue that irregular assessment should be treated with the same care as missing data, and we propose that trialists adopt strategies to minimize the extent of irregularity; describe the extent of irregularity in assessment times; make their assumptions about the relationships between assessment times and outcomes explicit; adopt analytic techniques that are appropriate to their assumptions; and assess the sensitivity of trial results to their assumptions.
Keywords: clinical trial; longitudinal studies; selection bias.
© The Author(s) 2022. Published by Oxford University Press on behalf of the Johns Hopkins Bloomberg School of Public Health. All rights reserved. For permissions, please e-mail: journals.permissions@oup.com.
Figures


References
-
- Lin H, Scharfstein D, Rosenheck R. Analysis of longitudinal data with irregular, outcome-dependent follow-up. J R Stat Soc Series B. 2004;66(3):791–813.
-
- Buzkova P, Lumley T. Semi-parametric modeling of repeated measurements under outcome-dependent follow-up. Stat Med. 2009;28(6):987–1003. - PubMed
-
- Lin D, Ying Z. Semiparametric and nonparametric regression analysis of longitudinal data. J Am Stat Assoc. 2001;96(453):103–126.
-
- Lin D, Ying Z. Semiparametric regression analysis of longitudinal data with informative dropouts. Biostatistics. 2003;4(3):385–398. - PubMed
