. 2023 Jan 9;13(1):114-131.
doi: 10.1158/2159-8290.CD-22-0750.

Intraventricular B7-H3 CAR T Cells for Diffuse Intrinsic Pontine Glioma: Preliminary First-in-Human Bioactivity and Safety

Affiliations

Intraventricular B7-H3 CAR T Cells for Diffuse Intrinsic Pontine Glioma: Preliminary First-in-Human Bioactivity and Safety

Nicholas A Vitanza et al. Cancer Discov. .

Abstract

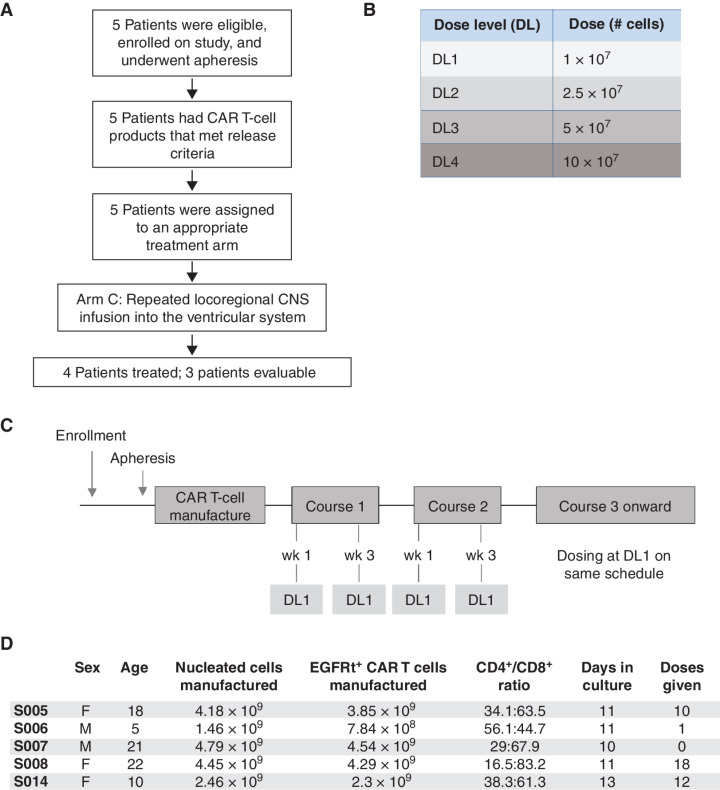
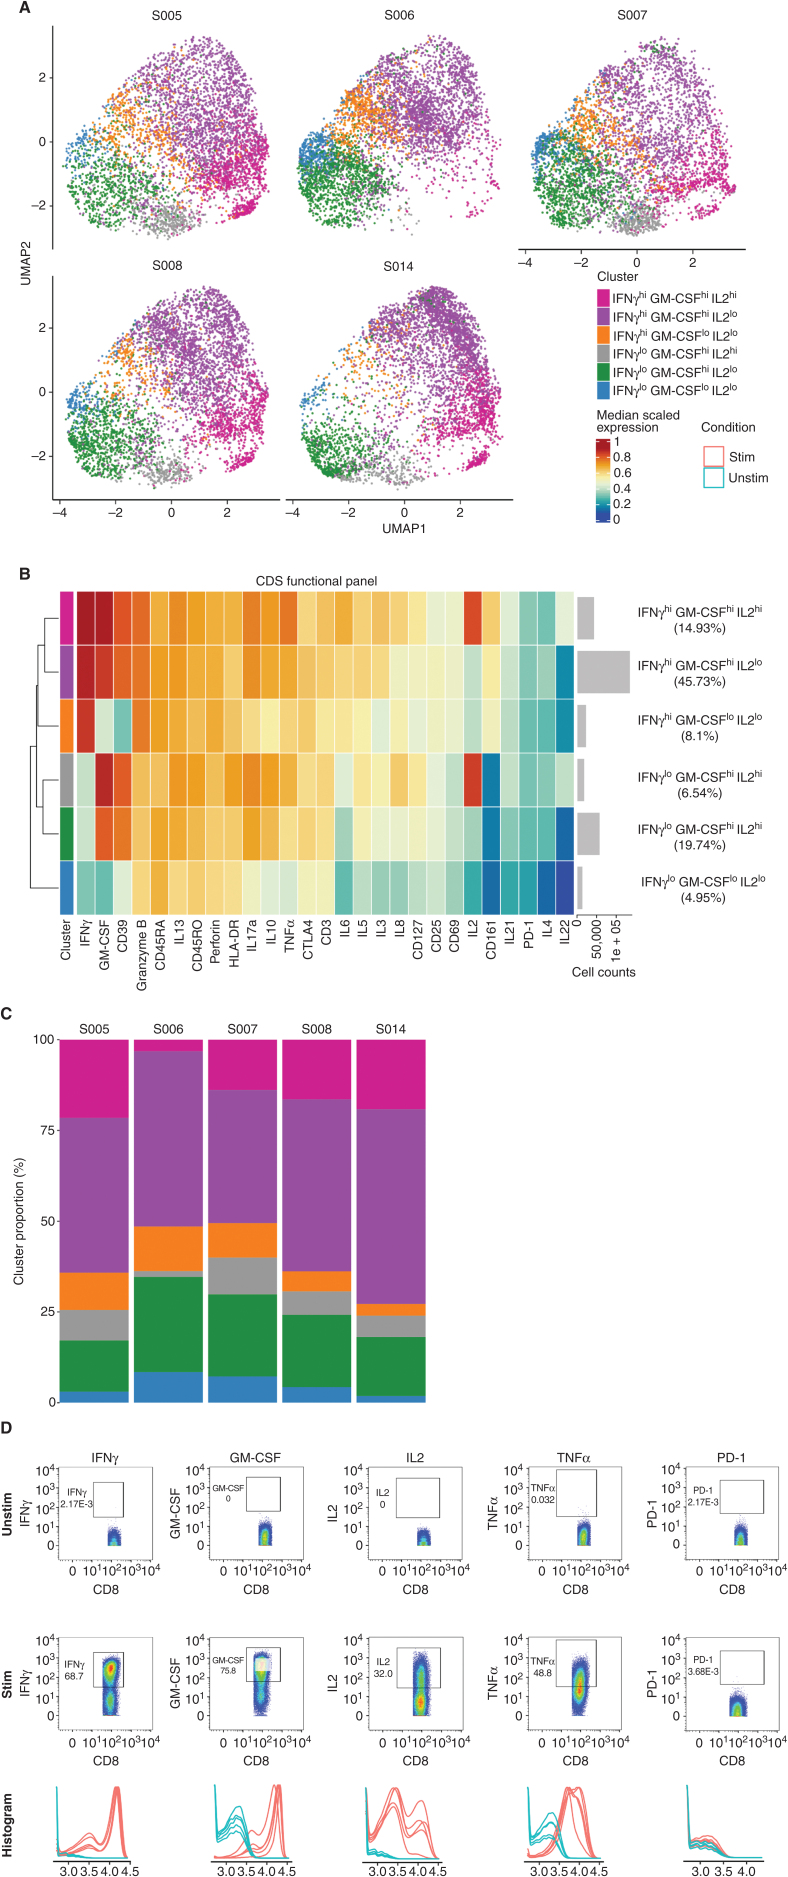
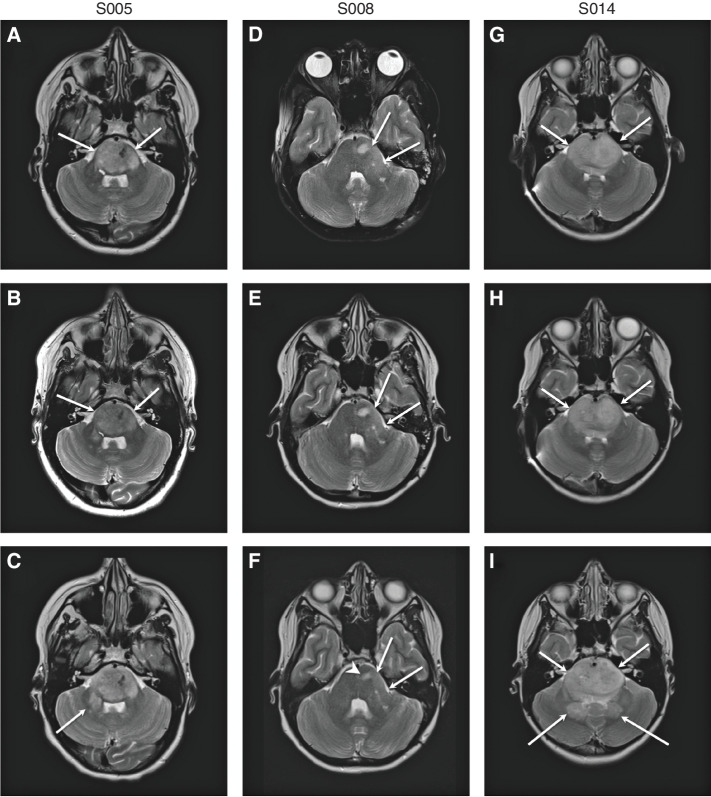
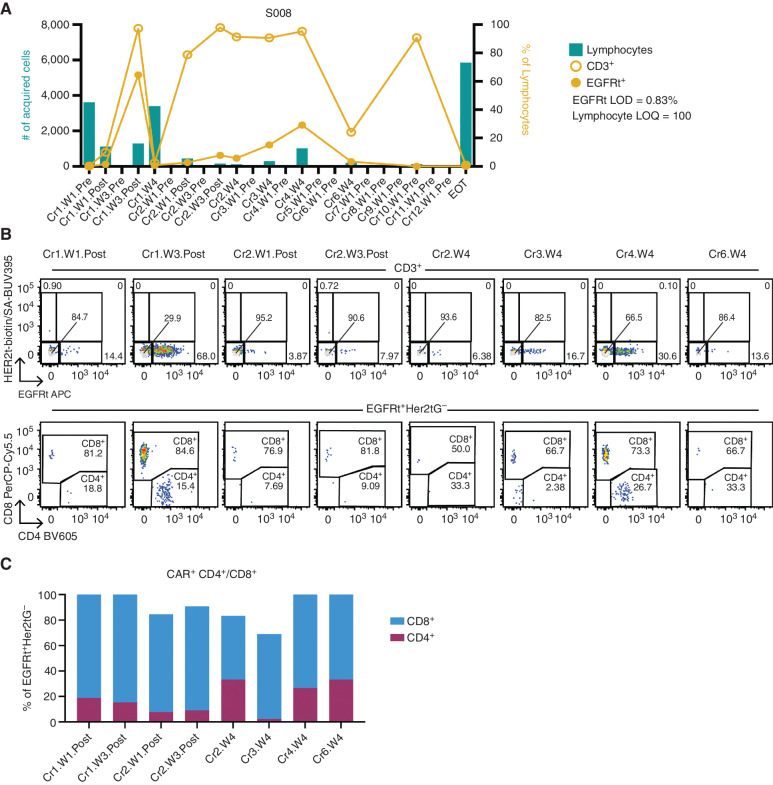
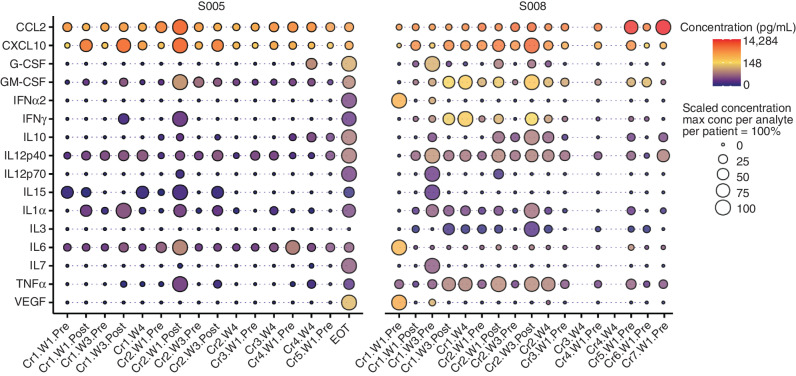
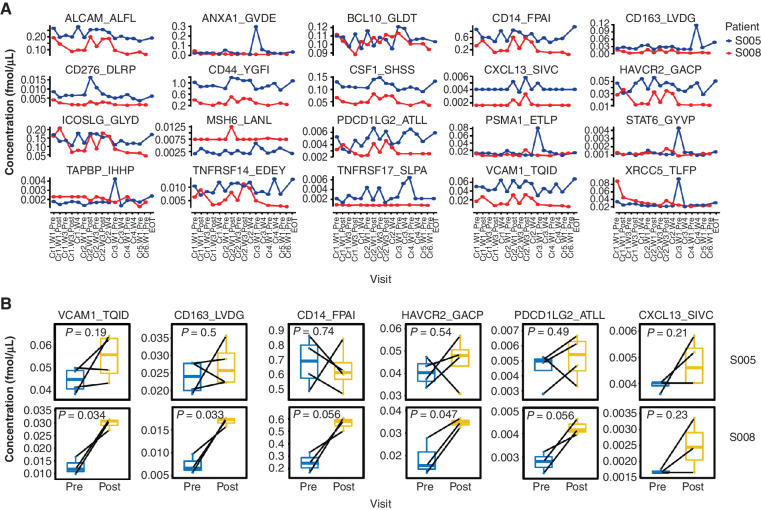
Diffuse intrinsic pontine glioma (DIPG) remains a fatal brainstem tumor demanding innovative therapies. As B7-H3 (CD276) is expressed on central nervous system (CNS) tumors, we designed B7-H3-specific chimeric antigen receptor (CAR) T cells, confirmed their preclinical efficacy, and opened BrainChild-03 (NCT04185038), a first-in-human phase I trial administering repeated locoregional B7-H3 CAR T cells to children with recurrent/refractory CNS tumors and DIPG. Here, we report the results of the first three evaluable patients with DIPG (including two who enrolled after progression), who received 40 infusions with no dose-limiting toxicities. One patient had sustained clinical and radiographic improvement through 12 months on study. Patients exhibited correlative evidence of local immune activation and persistent cerebrospinal fluid (CSF) B7-H3 CAR T cells. Targeted mass spectrometry of CSF biospecimens revealed modulation of B7-H3 and critical immune analytes (CD14, CD163, CSF-1, CXCL13, and VCAM-1). Our data suggest the feasibility of repeated intracranial B7-H3 CAR T-cell dosing and that intracranial delivery may induce local immune activation.

Significance: This is the first report of repeatedly dosed intracranial B7-H3 CAR T cells for patients with DIPG and includes preliminary tolerability, the detection of CAR T cells in the CSF, CSF cytokine elevations supporting locoregional immune activation, and the feasibility of serial mass spectrometry from both serum and CSF. This article is highlighted in the In This Issue feature, p. 1.


Figures

Figure 1. BrainChild-03 arm C trial design. A, CONSORT diagram of BrainChild-03 arm C interim analysis. Five patients were eligible and underwent apheresis, which led to a CAR T-cell product meeting release criteria in all patients. Four patients advanced to receive CAR T-cell therapy and three patients were evaluable. B, Dose levels. C, Clinical trial schedule for patients enrolled on dose regimen (DR) 1. By completion of course 2 (the end of the DLT observation window) patients have received 4 doses at DL 1. If study criteria are met, patients may elect to continue beyond course 2 at DL1. D, DIPG patient demographics and product characterization.
Figure 1.
BrainChild-03 arm C trial design. A, CONSORT diagram of BrainChild-03 arm C interim analysis. Five patients were eligible and underwent apheresis, which led to a CAR T-cell product meeting release criteria in all patients. Four patients advanced to receive CAR T-cell therapy and three patients were evaluable. B, Dose levels. C, Clinical trial schedule for patients enrolled on dose regimen (DR) 1. By completion of course 2 (the end of the DLT observation window) patients have received 4 doses at DL 1. If study criteria are met, patients may elect to continue beyond course 2 at DL1. D, DIPG patient demographics and product characterization.
Figure 2. Functional analysis of stimulated CD8+ infusion products by CyTOF. A, UMAP representations of the cells. 5,000 cells from each product were used in the UMAP analysis. Cells in the UMAPs were colored by a cluster color designation. B, Heat map of cell clusters that constitute stimulated (by PMA/ionomycin) infusion products of all five DIPG patients. Cell intensity expressions were first normalized from 0 to 1 for each marker. The heat map was then colored using the median of the scaled intensity expressions (between 0 and 1) of each marker. Each row of the heat map was annotated by the cluster color designation, descriptive cluster name, histogram of cell count, and percentage of cell counts. C, Stacked bar graph of the cluster proportion within all five stimulated products. D, Representative 2-D flow plots and 1-D density plot of key markers of interest. The 2-D flow plots showcase representative results from S005, whereas the 1-D density plots show results from all five stimulated and unstimulated pairs, colored respectively.
Figure 2.
Functional analysis of stimulated CD8+ infusion products by CyTOF. A, Uniform manifold approximation and projection (UMAP) representations of the cells. 5,000 cells from each product were used in the UMAP analysis. Cells in the UMAPs were colored by a cluster color designation. B, Heat map of cell clusters that constitute stimulated (by PMA/ionomycin) infusion products of all five patients with DIPG. Cell intensity expressions were first normalized from 0 to 1 for each marker. The heat map was then colored using the median of the scaled intensity expressions (between 0 and 1) of each marker. Each row of the heat map was annotated by the cluster color designation, descriptive cluster name, histogram of cell count, and percentage of cell counts.C, Stacked bar graph of the cluster proportion within all five stimulated products. D, Representative cytometry scatter density plots and histograms to show expression of key markers of interest. The top two rows show representative results from S005. Scatter density of cells is plotted by cytokine or PD-1 expression (y-axis) versus CD8 expression (x-axis) for unstimulated (top row) versus PMA- and ionomycin-stimulated (second row) cells. The third row shows histograms from all five stimulated (red lines) and unstimulated (cyan lines) samples.
Figure 3. Neuroimaging after locoregional B7-H3 CAR T-cell infusion. MRI images from S005 (A–C), S008 (D–F), and S014 (G–I). Axial T2-weighted images from all three patients immediately before initial CAR T-cell administration (A, D, and G), following course 2 (i.e., 4 intracranial B7-H3 CAR T-cell infusions; B, E, and H), and prior to any other tumor-directed therapy (C, F, and I). Images correspond to study participants S005 (A–C; imaged at days −2, 53, and 138 relative to first infusion), S008 (D–F; imaged at days −19, 50, and 307 relative to first infusion), and S014 (G–I; imaged at days −1, 45, and 211 relative to first infusion). Patients S005 and S014 experienced slow progression in tumor bulk over time, with increased tumor infiltration in the right brachium pontis (arrow in C) and dentate nuclei (posterior arrows in I). Patient S008 showed mildly decreased tumor bulk (long arrows in F) and decreased conspicuity of T2 hyperintense tumoral nodule (short arrowhead in F).
Figure 3.
Neuroimaging after locoregional B7-H3 CAR T-cell infusion. MRI images from S005 (A–C), S008 (D–F), and S014 (G–I). Axial T2-weighted images from all three patients immediately before initial CAR T-cell administration (A, D, and G), following course 2 (i.e., 4 intracranial B7-H3 CAR T-cell infusions; B, E, and H), and prior to any other tumor-directed therapy (C, F, and I). Images correspond to study participants S005 (A–C; imaged at days −2, 53, and 138 relative to first infusion), S008 (D–F; imaged at days −19, 50, and 307 relative to first infusion), and S014 (G–I; imaged at days −1, 45, and 211 relative to first infusion). Patients S005 and S014 experienced slow progression in tumor bulk over time, with increased tumor infiltration in the right brachium pontis (arrow in C) and dentate nuclei (posterior arrows in I). Patient S008 showed mildly decreased tumor bulk (long arrows in F) and decreased conspicuity of T2 hyperintense tumoral nodule (short arrowhead in F).
Figure 4. B7-H3 CAR T cells detected in CSF post infusion. Using the gating strategy shown in Supplementary Fig. S12, (A) the total number of lymphocytes collected in each CSF sample acquisition on the flow cytometer was plotted for S008 (green bars, left axis). Overlayed on the plot (right axis) is the percentage of lymphocytes expressing CD3 (open circles) or EGFRt CAR tag (filled circles). Samples with less than 100 lymphocytes, the limit of quantitation (LOQ) requirement for the flow assay, were excluded from T and CAR T-cell reporting. Flow plots displaying (B) CAR T-cell detection and the (B and C) CD4+/CD8+ expression in the EGFRt+ population at time points with lymphocyte counts above the LOQ are shown for S008.
Figure 4.
B7-H3 CAR T cells detected in CSF post infusion. Using the gating strategy shown in Supplementary Fig. S12,the total number of lymphocytes collected in each CSF sample acquisition on the flow cytometer was plotted for S008 (A; green bars, left axis). The x-axis denotes the timing of biospecimen collection: Cr, course; W, week; Pre, sample collection just prior to infusion; Post, timing is denoted in Supplementary Table S2. Overlayed on the plot (right axis) is the percentage of lymphocytes expressing CD3 (open circles) or EGFRt CAR tag (filled circles). Samples with less than 100 lymphocytes, the limit of quantitation (LOQ) requirement for the flow assay, were excluded from T and CAR T-cell reporting. EOT, end of therapy. Flow plots displaying CAR T-cell detection (B) and the CD4+/CD8+ expression in the EGFRt+ population at time points with lymphocyte counts above the LOQ (B and C) are shown for S008.
Figure 5. High concentrations of CXCL10, CCL2, and GM-CSF are detected in CSF after treatment. Cytokine concentrations in CSF across both patients were converted to log2 scale and represented with circles filled with color. Red color corresponds to the highest log2 concentration measured across both patients. Yellow and blue colors correspond to 50% and 0% of the log2 concentration, respectively. Additionally, concentrations relative to the maximum concentration observed for a given patient and analyte are represented by the size of the circles, to highlight the fluctuation in cytokine concentrations throughout a patient's CAR T-cell treatment. The x-axis denotes the timing of biospecimen collection: Cr, course; W, week; Pre, sample collection just prior to infusion; Post, timing is denoted in Supplementary Table S2. EOT, end of therapy.
Figure 5.
High concentrations of CXCL10, CCL2, and GM-CSF are detected in CSF after treatment. Cytokine concentrations in CSF across both patients were converted to log2 scale and represented with circles filled with color. Red color corresponds to the highest log2 concentration measured across both patients. Yellow and blue colors correspond to 50% and 0% of the log2 concentration, respectively. Additionally, concentrations relative to the maximum concentration observed for a given patient and analyte are represented by the size of the circles, to highlight the fluctuation in cytokine concentrations throughout a patient's CAR T-cell treatment. The x-axis denotes the timing of biospecimen collection: Cr, course; W, week; Pre, sample collection just prior to infusion; Post, timing is denoted in Supplementary Table S2. EOT, end of therapy.
Figure 6. Targeted proteomics supports local immune activation during intracranial B7-H3 CAR T-cell therapy. A, Targeted immuno-MRM peptide concentrations in CSF plotted versus visit for patients S005 (blue) and S008 (red). Analyte name is represented by a gene symbol followed by the first four amino acids of the target peptide. Only peptides detected above the lower limit of quantification in at least one visit from both patients were plotted. The x-axis denotes the timing of biospecimen collection: Cr, course; W, week; Pre, sample collection just prior to infusion; Post, timing is denoted in Supplementary Table S2. EOT, end of therapy. B, Concentrations for selected peptides in all pairwise pre- and posttreatment samples. Box plots represent median (bar), lower and upper quartiles (box), and 5th–95th percentiles (vertical line). Pairs of pre- and posttreatment samples are connected by a black line.
Figure 6.
Targeted proteomics supports local immune activation during intracranial B7-H3 CAR T-cell therapy. A, Targeted immuno-MRM peptide concentrations in CSF plotted versus visit for patients S005 (blue) and S008 (red). Analyte name is represented by a gene symbol followed by the first four amino acids of the target peptide. Only peptides detected above the lower limit of quantification in at least one visit from both patients were plotted. The x-axis denotes the timing of biospecimen collection: Cr, course; W, week; Pre, sample collection just prior to infusion; Post, timing is denoted in Supplementary Table S2. EOT, end of therapy. B, Concentrations for selected peptides in all pairwise pre- and posttreatment samples. Box plots represent median (bar), lower and upper quartiles (box), and 5th–95th percentiles (vertical line). Pairs of pre- and posttreatment samples are connected by a black line.

Comment in

  • doi: 10.1158/2159-8290.CD-13-1-ITI

References

    1. Cooney T, Lane A, Bartels U, Bouffet E, Goldman S, Leary SES, et al. . Contemporary survival endpoints: an international diffuse intrinsic pontine glioma registry study. Neuro Oncol 2017;19:1279–80. - PMC - PubMed
    1. Vitanza NA, Monje M. Diffuse intrinsic pontine glioma: from diagnosis to next-generation clinical trials. Curr Treat Options Neurol 2019;21:37. - PMC - PubMed
    1. Louis DN, Perry A, Reifenberger G, von Deimling A, Figarella-Branger D, Cavenee WK, et al. . The 2016 World Health Organization classification of tumors of the central nervous system: a summary. Acta Neuropathol 2016;131:803–20. - PubMed
    1. Gardner RA, Finney O, Annesley C, Brakke H, Summers C, Leger K, et al. . Intent-to-treat leukemia remission by CD19 CAR T cells of defined formulation and dose in children and young adults. Blood 2017;129:3322–31. - PMC - PubMed
    1. Majzner RG, Ramakrishna S, Yeom KW, Patel S, Chinnasamy H, Schultz LM, et al. . GD2-CAR T cell therapy for H3K27M-mutated diffuse midline gliomas. Nature 2022;603:934–41. - PMC - PubMed

Publication types