Editorial
. 2023 Jan 3;11(1):38-55.
doi: 10.1158/2326-6066.CIR-22-0116.

VISTA Targeting of T-cell Quiescence and Myeloid Suppression Overcomes Adaptive Resistance

Affiliations
Editorial

VISTA Targeting of T-cell Quiescence and Myeloid Suppression Overcomes Adaptive Resistance

Evelien Schaafsma et al. Cancer Immunol Res. .

Abstract

V domain immunoglobulin suppressor of T-cell activation (VISTA) is a premier target for cancer treatment due to its broad expression in many cancer types and enhanced expression upon development of adaptive immune checkpoint resistance. In the CT26 colorectal cancer model, monotherapy of small tumors with anti-VISTA resulted in slowed tumor growth. In a combination therapy setting, large CT26 tumors showed complete adaptive resistance to anti-PD-1/CTLA-4, but inclusion of anti-VISTA led to rejection of half the tumors. Mechanisms of enhanced antitumor immunity were investigated using single-cell RNA sequencing (scRNA-seq), multiplex image analysis, and flow cytometry of the tumor immune infiltrate. In both treatment models, anti-VISTA upregulated stimulated antigen presentation pathways and reduced myeloid-mediated suppression. Imaging revealed an anti-VISTA stimulated increase in contacts between T cells and myeloid cells, further supporting the notion of increased antigen presentation. scRNA-seq of tumor-specific CD8+ T cells revealed that anti-VISTA therapy induced T-cell pathways highly distinct from and complementary to those induced by anti-PD-1 therapy. Whereas anti-CTLA-4/PD-1 expanded progenitor exhausted CD8+ T-cell subsets, anti-VISTA promoted costimulatory genes and reduced regulators of T-cell quiescence. Notably, this is the first report of a checkpoint regulator impacting CD8+ T-cell quiescence, and the first indication that quiescence may be a target in the context of T-cell exhaustion and in cancer. This study builds a foundation for all future studies on the role of anti-VISTA in the development of antitumor immunity and provides important mechanistic insights that strongly support use of anti-VISTA to overcome the adaptive resistance seen in contemporary treatments involving PD-1 and/or CTLA-4. See related Spotlight by Wei, p. 3.


Conflict of interest statement

Conflict of interest disclosure statement: R.J.N. is an inventor on patent applications (10035857, 9631018, 9217035, 8501915, 8465740, 8236304, and 8231872) submitted by Dartmouth College, and patent applications (9890215 and 9381244) submitted by Kings College London and Dartmouth College, and a co-founder of ImmuNext, a company involved in the development of VISTA-related assets. J.L.L. and E.C.N are inventors on patents 10745467 and 10933115 issued and licensed to Curis Inc. through ImmuNext. These applications cover the use of VISTA targeting for modulation of the immune response.

Figures

Figure 1.
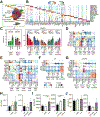
Figure 1.. Therapeutic impact of anti-VISTA as a monotherapy and in a checkpoint resistance of model of colon cancer.
(A) Models of monotherapy and checkpoint resistant therapy. BALB/c mice were administered 100k CT26 cells. In the I/V model, mice were treated when tumors reached a size of 40mm3 with isotype (I) or anti-VISTA (V). In the CPV model, mice were treated when tumors reached a size of 600mm3 with anti-CTLA-4 and anti-PD-1 plus isotype (CP) or plus anti-VISTA (CPV). (B) Tumor growth with anti-VISTA monotherapy. Tumor volumes following I/V treatment of individual mice or mean tumor size +/− SE of 20 mice group are shown. (C). Tumor growth with anti-VISTA in checkpoint resistant models. Tumor volumes and survival following CPV treatment of individual mice or mean tumor size +/− SE of 10 mice group are shown. (D) Representative images of tumors following CP/CPV treatment. (E&F) CD45+ cell frequency per gram of tumor as determined by flow cytometry in I/V (E) and CP/CPV (F), categorized by response. Statistical significance was assessed by two-way ANOVA (B&C) or one-way ANOVA (E&F; *P < 0.05, **P < 0.01, ***P < 0.001, ****P < 0.0001).
Figure 2.
Figure 2.. Anti-VISTA-induced changes to tumor infiltrating macrophages and monocytes.
(A) Macrophage (CD45+, CD11b+, Gr1-, F4/80+, CD11c+) frequency per gram of tumor as determined by flow cytometry. (B) Monocyte (CD45+, CD11b+, Ly6C+, F4/80-) frequency per gram of tumor as determined by flow cytometry. (C) Macrophage-to-monocyte ratio as determined by flow cytometry. (D) Granulocyte (CD45+, CD11b+, Ly6G+, F4/80-) frequency per gram of as determined by flow cytometry. (E) Granulocyte (CD45+, CD11b+, Ly6G+, F4/80-) frequency within spleen as determined by flow cytometry. (F) Tumor CD11b+ cells were cultured at a 1:2 ratio with anti-CD3/anti-CD28-stimulated T cells. T-cell proliferation was determined by flow cytometry. Data is representative from two independent experiments. Data are represented as mean ± SD. Statistical significance was assessed by one-way ANOVA (*P < 0.05, **P < 0.01, ***P < 0.001).
Figure 3.
Figure 3.. Anti-VISTA-induced changes to tumor infiltrating myeloid cells.
CD45+ cells were isolated from the TME and analyzed by scRNA-seq. (A) UMAP of all myeloid cells in CD45+ cells sorted from I/V- and CP/CPV-treated tumor infiltrates, colored by cell cluster based on Louvain clustering. (B) Dot plots of cluster-defining marker genes for cell type annotations (as in A). Dot size represents fraction of cells expressing a gene in each cluster. Dot color represents scaled average expression by gene column. (C) Highlighted cluster frequencies for I/V and CP/CPV datasets represented as mean ± SD. D-G) Dot plots of selected DEGs among treatment groups in macrophage (D&E) or monocyte (F&G) clusters for I/V (D&F) and CP/CPV (E&G) datasets. Dot size represents fraction of cells expressing a gene in each cluster. Dot color represents scaled average expression by gene row. Legend indicated in F applies to D-G. (H) Expression of CD38 was determined on CD45+, CD11b+, Gr1-, F4/80+ macrophages by flow cytometry. MHC-II expression within macrophages (I) or monocytes (J) as determined by flow cytometry. Data are represented as mean ± SD. Statistical significance was assessed by chi-square tests (C) or one-way ANOVA (H-J) (*P < 0.05, **P < 0.01, ***P < 0.001).
Figure 4.
Figure 4.. Anti-VISTA-induced changes to tumor infiltrating granulocytes.
CD45+CD11b+Ly6G+ cells were isolated from the TME and analyzed by scRNA-seq. (A) UMAP of granulocytes in Ly6G+ cells sorted from I/V-treated tumor infiltrates, colored by cell cluster based on Louvain clustering. (B) Dot plots of cluster-defining marker genes for cell type annotations (as in A). Dot size represents fraction of cells expressing a gene in each cluster. Dot color represents scaled average expression by row. (C) UMAP of granulocytes in Ly6G+ cells sorted from CP/CPV-treated tumor infiltrates, colored by cell cluster based on Louvain clustering. (D) Dot plots of cluster-defining marker genes for cell type annotations (as in C). Dot size represents fraction of cells expressing a gene in each cluster. Dot color represents scaled average expression by row. (E) Enrichment for MDSC score[24] in each cluster. (F&G) Cluster frequencies as a proportion of the granulocyte infiltrate in I/V (F) or CP/CPV (G) treatment. (H) Dot plots of selected DEGs among treatment groups in granulocyte clusters for I/V and CP/CPV datasets. Dot size represents fraction of cells expressing a gene in each cluster. Dot color represents scaled average expression by gene row. Expression of MHC-II (I), Arg1 (J) as determined by flow cytometry. Data was not statistically significant by one-way ANOVA (I&J left panel) or unpaired t test (J right panel).
Figure 5.
Figure 5.. Anti-VISTA-induced changes to tumor infiltrating lymphoid cells.
Frequency of NK (A), CD4+ (B) and CD8+ T cells (C) per gram of dissociated tumor. (D) Tumors were formalin-fixed, embedded and stained for lymphoid and myeloid markers. Scale bars indicate 100 μm. Images show multiplex, touching cells, and CD8 staining. (E) Cell densities from 25–65 multi-spectral image (MSI) fields were quantified using the InForm software package for CD8+ cells and were normalized to images from I treated tumors. (F) Touching cells from 25–65 multi-spectral image (MSI) fields were quantified using the InForm software package for CD8+ cells in contact with CD11b+ F4/80+ cells. Contacts were normalized to I-treated tumors. Data are represented as mean ± SD from two independent experiments. Statistical significance was assessed by one-way ANOVA (A-C) or Student’s t-tests (E-F) (*P < 0.05, **P < 0.01, ***P < 0.001).
Figure 6.
Figure 6.. Anti-VISTA-induced changes to tumor infiltrating lymphoid cells.
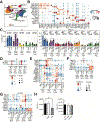
CD45 + cells were isolated from the TME and analyzed by scRNA-seq. (A) UMAP of all lymphoid cells in CD45+ cells sorted from I/V- and CP/CPV-treated tumor infiltrates, colored by cell cluster based on Louvain clustering. (B) Dot plots of cluster-defining marker genes for cell type annotations (as in A). Dot size represents fraction of cells expressing a gene in each cluster. Dot color represents scaled average expression by column. (C) Highlighted cluster frequencies as a proportion of the lymphoid infiltrate for I/V and CP/CPV datasets represented as mean ± SD. D-G) Dot plots of selected DEGs among treatment groups in NK (D&E) or CD8+ T-cell (F&G) clusters for I/V (D&F) and CP/CPV (E&G) datasets. Dot size represents fraction of cells expressing a gene in each cluster. Dot color represents scaled average expression by gene row. (H) MFI of PD-1 within CD8+ T cells. Statistical significance was assessed by chi-square tests (C) or one-way ANOVA (H) (*P < 0.05, **P < 0.01, ***P < 0.001).
Figure 7.
Figure 7.. Anti-VISTA-induced changes in tumor infiltrating CD8+ AH1-tetramer+ T cells.
(A) UMAP of CD8+ AH1-tetramer+ cells sorted from I/V- and CP/CPV-treated tumor infiltrates, colored by cell cluster based on Louvain clustering. (B) Dot plots of cluster-defining marker genes for cell type annotations (as in A). Dot size represents fraction of cells expressing a gene in each cluster. Dot color represents scaled average expression by row. (C) Cluster frequencies as a proportion of CD8+ AH1-tetramer+ T cells in I/V or CP/CPV treatment shown as stacked bar graphs. (D&E) Dot plots of selected DEGs among treatment groups for I/V (D) and CP/CPV (E) datasets. Dot size represents fraction of cells expressing a gene in each cluster. Dot color represents scaled average expression by gene row. Dot plots showing highlighted gene expression changes within clusters for I/V (D) and CP/CPV (E) datasets. (F) Enrichment of a quiescence gene set across the UMAP from (A)[58]. (G&H) Violin plots showing enrichment of quiescence genes within the Tprog-IFN cluster for I/V (G) and CP/CPV (H) datasets. Statistical significance was assessed by Mann-Whitney U tests (G&H; *P < 0.05, **P < 0.01, ***P < 0.001).

Comment in

Comment on

References

    1. Fritz JM and Lenardo MJ, Development of immune checkpoint therapy for cancer. The Journal of Experimental Medicine, 2019. 216(6): p. 1244––1254. - PMC - PubMed
    1. Barrueto L, et al., Resistance to Checkpoint Inhibition in Cancer Immunotherapy. Translational oncology, 2020. 13(3): p. 100738–100738. - PMC - PubMed
    1. Turajlic S, et al., Insertion-and-deletion-derived tumour-specific neoantigens and the immunogenic phenotype: a pan-cancer analysis. The Lancet Oncology, 2017. 18(8): p. 1009––1021. - PubMed
    1. Sánchez-Paulete AR, et al., Cancer Immunotherapy with Immunomodulatory Anti-CD137 and Anti–PD-1 Monoclonal Antibodies Requires BATF3-Dependent Dendritic Cells. Cancer Discovery, 2016. 6(1): p. 71 LP –– 79. - PMC - PubMed
    1. Cassetta L a KT , Macrophage targeting: opening new possibilities for cancer immunotherapy. Immunology, 2018. 155(3): p. 285––293. - PMC - PubMed