. 2022 Oct 21;8(42):eabm4295.
doi: 10.1126/sciadv.abm4295. Epub 2022 Oct 19.

Numb regulates Tau levels and prevents neurodegeneration in tauopathy mouse models

Affiliations

Numb regulates Tau levels and prevents neurodegeneration in tauopathy mouse models

Marine Lacomme et al. Sci Adv. .

Abstract

Accumulation of the microtubule-associated protein Tau is linked to neuronal cell death in tauopathies, but how intraneuronal Tau levels are regulated in health and disease remains unclear. Here, we show that conditional inactivation of the trafficking adaptor protein Numb in retinal ganglion cells (RGCs) increases Tau levels and leads to axonal blebbing, which is followed by neuronal cell loss in aged mice. In the TauP301S mouse model of tauopathy, conditional inactivation of Numb in RGCs and spinal motoneurons accelerates neurodegeneration, and loss of Numb in motoneurons also leads to precocious hindlimb paralysis. Conversely, overexpression of the long isoform of Numb (Numb-72) decreases intracellular Tau levels and reduces axonal blebbing in TauP301S RGCs, leading to improved electrical activity in cultured neurons and improves performance in a visually guided behavior test in vivo. These results uncover Numb as a key regulator of intracellular Tau levels and identify Numb-72 as a potential therapeutic factor for tauopathies.


Figures

Fig. 1.
Fig. 1.. Numb is essential for long-term survival of RGCs.
(A to L) Single-plane confocal images of retinal flat mounts stained for Brn3b from 5- (A to D), 8- (E to H), and 20-month-old (I to L) WT, Nbl KO, Numb+/−; Nbl KO, and cDKO mice, as indicated. Images were taken in the ganglion cell layer (GCL). Scale bar, 30 μm. (M) Quantification of the number of Brn3b+ RGC per mm2 in WT, controls, and cDKO mice at 5, 8, and 20 months old. Means ± SEM, n = 5 animals per genotype per time point. *P ≤ 0.05 and **P ≤ 0.01, two-way ANOVA followed by Turkey’s test. n.s., not significant.
Fig. 2.
Fig. 2.. Numb is essential to maintain axonal homeostasis.
(A to D) Confocal images of DiI-labeled RGC axons in retinal flat mounts from 5-month-old Nbl KO (A and B) and cDKO (C and D). Magnified views of the boxed regions in (A) and (C) are shown in (B) and (D). Arrowheads point to blebbing. (E and F) Confocal images of AAV2-GFP–infected Nbl KO (E) and cDKO (F) RGCs immunostained for Brn3b on retinal flatmounts. Arrowheads point to axonal blebs. (G to J) Confocal images of transverse sections of optic nerves from AAV2-GFP–infected Nbl KO (G) and cDKO (I). Magnified views of the boxed regions are shown in (H) and (J). (K to N) Confocal images of tdT expression in transverse sections of optic nerves from Numb+/−; Nbl KO (K) and cDKO (M). Magnified views of the boxed regions are shown in (L) and (N). (O to V) Primary retinal cell cultures prepared from Numb+/−; Nbl KO and cDKO immunostained for NF165 and tdT after 14 days in culture. Insets show magnified views of the boxed area. Arrowheads point to blebbing. (S to V) Quantification of neurite length (S), branch number (T), and number of axonal blebs (U and V) in Numb+/−; Nbl KO and cDKO RGCs. Number of blebs in controls are normalized to 1 in (M). Graphs show means ± SEM, *P < 0.05 and **P ≤ 0.001; Student’s t test. A total of 122 neurons in Numb+/−; Nbl KO and 155 neurons in cDKO. (V) Graph shows repartition of the number of blebs in different conditions. Two-way ANOVA followed by Turkey’s test, means ± SEM, *P < 0.05 and **P ≤ 0.001. A total of 122 neurons were counted in Numb+/−; Nbl KO and 155 neurons in cDKO. (W to AA) Immunostaining for total Tau (K9JA), NF165, and tdT on primary retina cell cultures prepared from cDKO retinas. Magnified view of the boxed region in (W) is shown in (X) to (AA).
Fig. 3.
Fig. 3.. Tau levels are elevated in Numb cDKO optic nerves and cause RGC death.
(A) Western blot of total Tau (5A6), GAPDH, and acetylated tubulin expression in optic nerve extracts from 5-month-old Nbl KO and cDKO mice. (B) Quantification of Tau level relative to GAPDH. Graph shows means ± SEM, *P ≤ 0.05; Student’s t test. (C) Western blot (T22 antibody), which recognizes both Tau monomer (50 kDa) and oligomer (>50 kDa), on optic nerve extracts from 5-month-old Nbl KO and cDKO mice. (D and E) Quantification of Tau monomers (D) and oligomers (E) relative to GAPDH. Graph shows means ± SEM, *P ≤ 0.05; Student’s t test. (F to H) Primary retinal cell cultures 14 days after transfection with GFP (F), Tau::GFP (G), and TauP301L::GFP (H) stained for NF165. Arrowheads point to blebs. (I) Number of blebs/RGC. Graph shows means ± SEM, *P ≤ 0.05; ANOVA one-way test followed by Dunnett’s test. n = 101 cells for GFP, n = 92 for Tau::GFP, and n = 82 for TauP301L::GFP. (J to M) Immunostaining for Brn3b on retinal flatmounts from 5-month-old mice 72 hours after saline (J and K) or NMDA (L and M) injection. Scale bar, 30 μm. (N and O) Quantification of the number of Brn3b+ RGCs per mm2 72 hours after saline (N) or NMDA (O) injection. Graph shows means ± SEM, *P ≤ 0.05; Student’s t test. (P) Number of Brn3b+ RGCs per mm2 in WT mice 72 hours after saline or NMDA injection. Graph shows means ± SEM. (Q) Western blot of total Tau and GAPDH expression in retinal extracts 24, 48, or 72 hours after intravitreal injection of siRNA against Tau. (R to T) Immunostaining for Brn3b on retinal flat mounts from 5-months-old mice 72 hours after NMDA and scramble siRNA (R and S) or siTAU (T) injection. Scale bar, 30 μm. (U) Number of Brn3b RGCs per mm2 72 hours after NMDA and siRNA injection. Graph shows means ± SEM, *P ≤ 0.05; ANOVA one-way followed by Turkey’s test.
Fig. 4.
Fig. 4.. Loss of Numb in TauP301S mouse accelerates neuronal degeneration.
(A) Immunostaining for Brn3b on retina flat mounts from 8-month-old Nbl KO;TauWT, Nbl KO;TauP301S, cDKO;TauWT, and cDKO;TauP301S. Scale bar, 30 μm. (B) Number of Brn3b+ RGCs per square millimeter in 8-month-old cDKO;TauP301S and the various control genotypes, as indicated. Graph shows means ± SEM, n = 5 animals per genotype. One-way ANOVA followed by Turkey’s test, *P ≤ 0.05, **P ≤ 0.01, and ****P ≤ 0.0001. (C) Immunostaining for choline acetyltransferase (ChAT) on adult spinal cord sections in the lumbar region L3 and L4 of WT, TauP301S, and cDKO;TauP301S mice at 350 days. Arrows point to ChAT+ cells. (D) Average number of ChAT+ motoneurons in L3 and L4 in WT, TauP301S, and cDKO;TauP301S. Graph shows means ± SEM, n = 4 animals per genotype. Two-way ANOVA followed by Turkey’s test, *P ≤ 0.05 and **P ≤ 0.01. (E) Schematic representation of paralysis stages based on the clasping reflex, 0 corresponds to no paralysis and 3 to full paralysis of the hindlimbs. (F) Representative image of 350-day-old transgenic TauP301S mouse (stage 0) and cDKO;TauP301S mouse (stage 3). (G) Comparison of paralysis stages over time in TauP301S (n = 4) and cDKO;TauP301S (n = 5) mice. Two-way ANOVA followed by Sidak’s test, *P ≤ 0.05 and **P ≤ 0.01. (H) Percentage of mice at stage 3 over time in cDKO;Tau WT (n = 6), TauP301S mice (n = 32), and cDKO;TauP301S (n = 14). Mantel-Cox test, ****P ≤ 0.0001. Inset shows representative image of hunched spine in the hindlimb region of cDKO; TauP301S at 350 days compared to aged-matched TauP301S.
Fig. 5.
Fig. 5.. Numb-72 negatively regulates intracellular Tau levels.
(A) Schematic representation of Numb isoforms. (B) Coimmunoprecipitation (IP) of flag-tagged Tau (Tau::Flag) with each isoform of Numb after coexpression in HEK293 cells. Ten percent input from protein extracts immunoblotted (IB) for Numb or Flag is shown as controls. (C) Western blot of Tau::GFP and Numb levels in HEK293 cells 72 hours after coexpression with Numb isoforms. GAPDH is used as loading control. (D) Quantification of Tau::GFP levels relative to GAPDH. Graph shows means ± SEM, *P ≤ 0.05; Student’s t test. (E) Representation of the DNA insertion in the stable human medulloblastoma–derived cell line (DAOY) and resulting mRNA and protein (12). (F to J) Flow cytometry analysis of DsRed and GFP signal in DAOY cells 72 hours after transfection with constructs expressing individual Numb isoforms or the Myc tag alone (CTL). Box area indicates gating used to identify DsRed+/GFP population. DP, double-positive (DsRed+/GFP+) cells. (K) Average ratio of DsRed+/GFP+ cells over DsRed+ cells after expression of the Myc tag control (CTL) and the Numb isoforms. Myc tag value was normalized to 1 and used for comparison with other conditions. Graph shows means ± SEM, *P ≤ 0.05. One-way ANOVA with Dunett’s test. (L and M) Dot blot analysis of total Tau (Tau5A6; L) and oligomeric Tau (T22; M) detected in culture medium of Tau-expressing HEK293T stable cell line 24 hours after transfection with GFP (Control) or Numb-72-IRES-GFP (Numb-72). Graphs show dot intensity quantification of total Tau or oligomeric Tau signal. Bars show means ± SEM; *P < 0.05, Student’s t test. (N and O) Dot blot analysis of total Tau (K9JA) levels in culture medium of TauP301S (N) or WT (O) RGCs 4 days after infection with AAV2 or AAV2-Numb-72. Graphs show dot intensity of total Tau signal. Bars show means ± SEM; **P < 0.001. Student’s t test.
Fig. 6.
Fig. 6.. Numb-72 reduces blebbing in primary RGCs of tauopathy mouse models.
(A to D) Immunostaining for NF165 on primary retinal cell cultures from WT and TauP301S mice 14 days after transfection with GFP or Numb-72-IRES-GFP. An increase in the number of blebs (arrowheads) is observed in TauP301S neurons compared to WT but reversed by Numb-72 expression. Dotted boxes identify regions magnified in insets. (E to G) Quantification of the number of axonal blebs (E), neurite length (F), and branch number (G) in WT and TauP301S RGCs. Values in WT were normalized to 1. Bar graphs show means ± SEM, **P ≤ 0.001. Two-way ANOVA followed by Sidak’s test (bleb counts) and Student’s t test (neurite length and branch numbers). n = 3 independent cultures for WT (133 GFP-transfected cells and 125 Numb-72–transfected cells analyzed) and n = 4 independent cultures for TauP301S (194 GFP-transfected and 121 Numb-72–transfected cells analyzed). (H to K) Immunostaining for NF165 on primary retinal cell cultures from WT and 3xTg mice 14 days after transfection with GFP or Numb-72-IRES-GFP. An increase in the number of blebs (arrowheads) is observed in 3xTg neurons compared to WT but reversed by Numb-72 expression. Dotted boxes identify regions magnified in insets. (L to N) Quantification of the number of axonal blebs (L), neurite length (M), and branch number (N) in WT and 3xTg RGCs. Values in WT were normalized to 1. Bar graphs show means ± SEM, **P ≤ 0.001. Two-way ANOVA followed by Sidak’s test (bleb counts) and Student’s t test (neurite length and branch numbers). n = 3 independent cultures for WT (128 GFP-transfected cells and 137 Numb-72–transfected cells analyzed) and n = 4 independent cultures for 3xTg (151 GFP-transfected and 119 Numb-72–transfected cells analyzed).
Fig. 7.
Fig. 7.. Numb-72 rescues RGC death in tauopathy mouse models in vivo.
(A to C) Immunostaining for GFP (A) and Brn3b (B) on retinal flatmounts from WT mice, 7 weeks after intravitreal injections of AAV2-GFP in 5-month-old animals. Merged image with Hoechst nuclear stain is shown in (C). (D to F) Immunostaining for Numb (D) and Brn3b (E) on retinal flatmounts from WT mice, 7 weeks after intravitreal injections of AAV2-Numb-72 in 5-month-old animals. Merged image with Hoechst nuclear stain is shown in (F). Inset shows high magnification view of a Numb/Brn3b double-positive cell. (G to J) Immunostaining for Brn3b on retina flatmounts from WT (G to H) and TauP301S mice (I to J), 7 weeks after intravitreal injections of AAV2-GFP or AAV2-Numb-72 in 5-month-old animals. Three days before sacrifice, all animals received an intravitreal injection of 10 mM NMDA. Confocal images were taken in the ganglion cell layer. Scale bar, 30 μm. (K) Number of Brn3b+ RGC per square millimeter in WT and TauP301S mice after AAV2-GFP + NMDA or AAV2-Numb-72 + NMDA injection. Bar graphs show means ± SEM, **P ≤ 0.001; two-way ANOVA followed by Turkey’s test. (L to O) Immunostaining for Brn3b on retina flatmounts from WT (L and M) and 3xTg-AD (N and O) mice, 7 weeks after intravitreal injections of AAV2-GFP or AAV2-Numb-72 in 5-month-old animals. Three days before sacrifice, all animals received an intravitreal injection of 10 mM NMDA. Confocal images were taken in the ganglion cell layer. Scale bar, 30 μm. (P) Number of Brn3b+ RGC per square millimeter in WT and 3xTg-AD after AAV2-GFP + NMDA or AAV2-Numb-72 + NMDA injection. Bar graphs show means ± SEM, **P ≤ 0.001; two-way ANOVA followed by Turkey’s test.
Fig. 8.
Fig. 8.. Numb-72 rescues RGC function in tauopathy mouse models in vitro and in vivo.
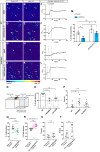
(A, B, D, E, G, H, J, and K) Pseudo-colored images of calcium (Ca2+) activity before (A, D, G, and J) and after (B, E, H, and K) addition of KCl. (C, F, I, and L) Traces representing the average change of Ca2+ sensor fluorescence relative to baseline (ΔF/F0). A minimum of 70 cells per condition were analyzed, n = 4 independent experiments per group. (M) Percentage of cells in culture that showed a Ca2+ spike in WT and TauP301S RGC culture infected with AAV2 or AAV2-Numb-72. Bar graphs show means ± SEM, *P ≤ 0.05; two-way ANOVA followed by Turkey’s test. n = 4 WT individual cultures; n = 5 TauP301S individual cultures (minimum of 95 regions of interests analyzed). (N) Schematic of the cliff test apparatus. Mice are placed in the pedestal and chosen between a deep side and a safe shallow side. (O) Histogram represents the percentage of safe decisions. Bar graphs show means ± SEM, ***P ≤ 0.0001 and **P ≤ 0.001; one-way ANOVA followed by Turkey’s test. n = 6 WT, n = 4 PDE6BRD1, and n = 11 TauP301S. (P) Average of time to make a decision. Bar graphs show means ± SEM, *P ≤ 0.05; one-way ANOVA followed by Turkey’s test. (Q and R) Percentage of safe decisions before AAV injection [same animals as in (O)] and 7 weeks after AAV2-GFP (Q) or AAV2-Numb-72 (R). Bar graphs show means ± SEM, **P ≤ 0.001. Paired T test. (S and T) Average time that TauP301S mice spend to decide before [same animals as in (P)] and after AAV2-GFP (S) or AAV2-Numb-72 (T). Bar graphs show means ± SEM, paired T test.
Fig. 9.
Fig. 9.. Model.
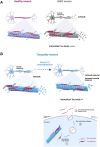
(A) In healthy neurons (left), Numb/Nbl function to maintain Tau homeostasis and promote neuronal survival. In the absence of Numb/Nbl (cDKO, right), intracellular Tau levels rise, leading to formation of Tau oligomers and axonal blebs, followed by cell death. (B) In tauopathy neurons, Tau oligomerizes, which leads to axonal blebbing and neurodegeneration (left). Upon expression of Numb-72 in tauopathy neurons, however, the native form of Tau is released in the extracellular space, leading to reduced oligomeric Tau, fewer axonal blebs, and rescued neuronal survival (right). Created with BioRender.com.

Comment in

References

    1. Qiang L., Sun X., Austin T. O., Muralidharan H., Jean D. C., Liu M., Yu W., Baas P. W., Tau does not stabilize axonal microtubules but rather enables them to have long labile domains. Curr. Biol. 28, 2181–2189.e4 (2018). - PubMed
    1. Cho H., Choi J. Y., Lee H. S., Lee J. H., Ryu Y. H., Lee M. S., Jack C. R. Jr., Lyoo C. H., Progressive tau accumulation in Alzheimer disease: 2-year follow-up study. J. Nucl. Med. 60, 1611–1621 (2019). - PMC - PubMed
    1. Iqbal K., Liu F., Gong C. X., Grundke-Iqbal I., Tau in Alzheimer disease and related tauopathies. Curr. Alzheimer Res. 7, 656–664 (2010). - PMC - PubMed
    1. Watanabe H., Bagarinao E., Yokoi T., Yamaguchi H., Ishigaki S., Mausuda M., Katsuno M., Sobue G., Tau accumulation and network breakdown in Alzheimer’s disease. Adv. Exp. Med. Biol. 1184, 231–240 (2019). - PubMed
    1. de Calignon A., Polydoro M., Suárez-Calvet M., William C., Adamowicz D. H., Kopeikina K. J., Pitstick R., Sahara N., Ashe K. H., Carlson G. A., Spires-Jones T. L., Hyman B. T., Propagation of tau pathology in a model of early Alzheimer’s disease. Neuron 73, 685–697 (2012). - PMC - PubMed