. 2022 Aug 5;5(12):e202201517.
doi: 10.26508/lsa.202201517.

The L-NAME mouse model of preeclampsia and impact to long-term maternal cardiovascular health

Affiliations

The L-NAME mouse model of preeclampsia and impact to long-term maternal cardiovascular health

Natasha de Alwis et al. Life Sci Alliance. .

Abstract

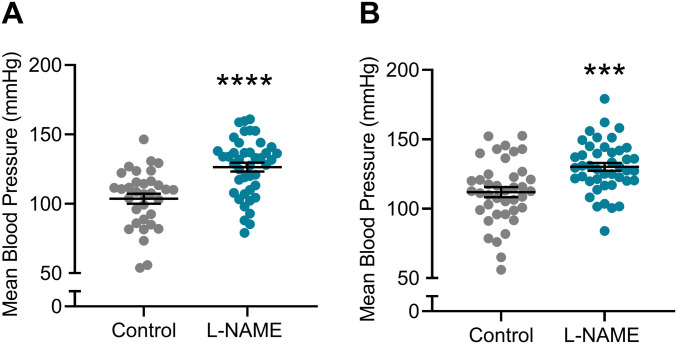
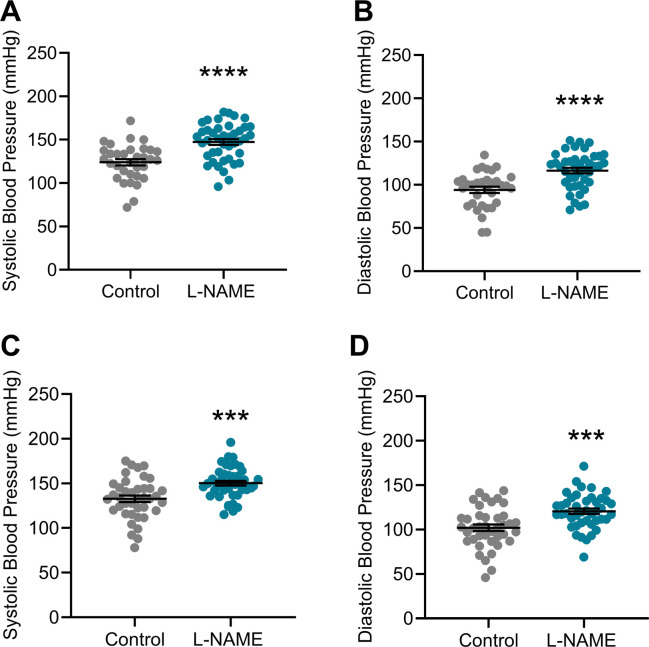
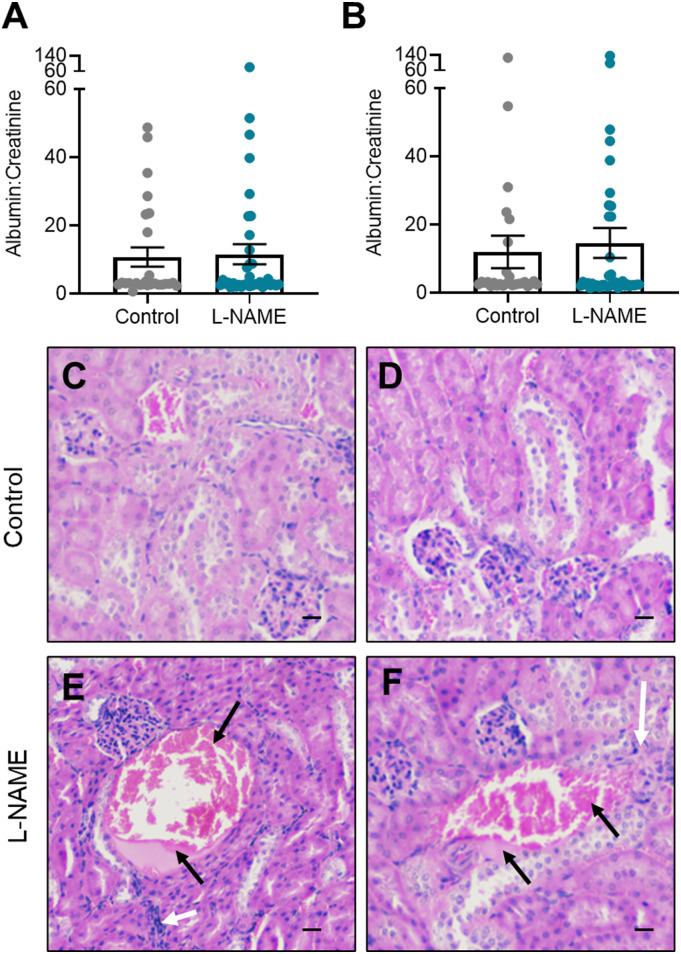
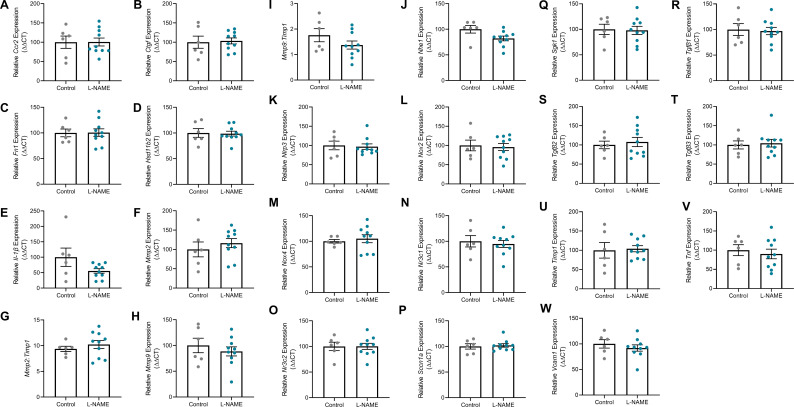
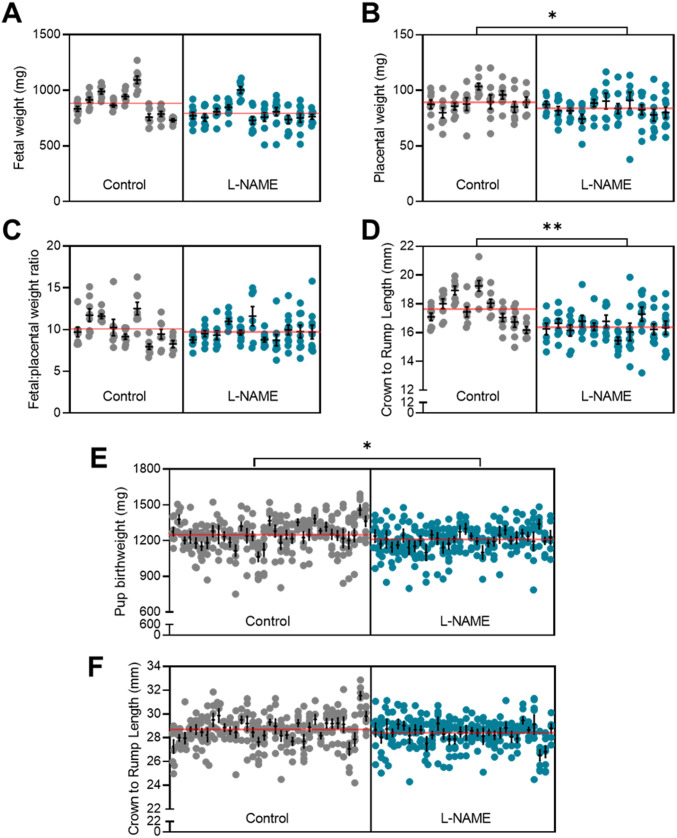
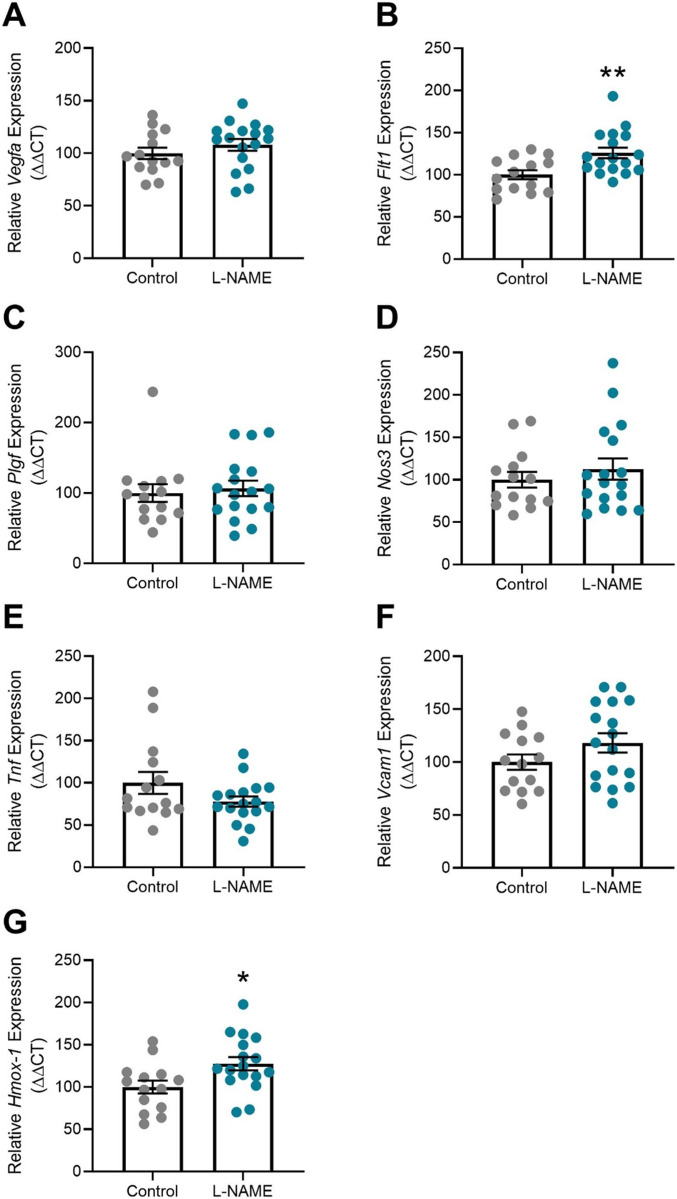
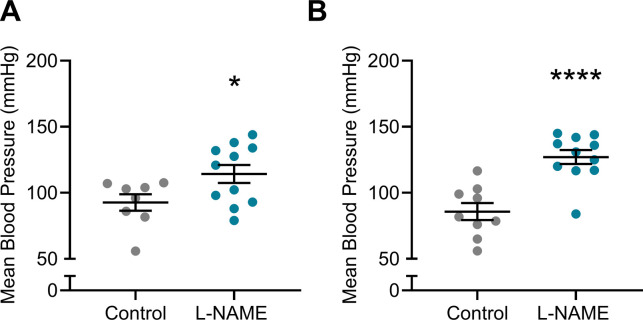
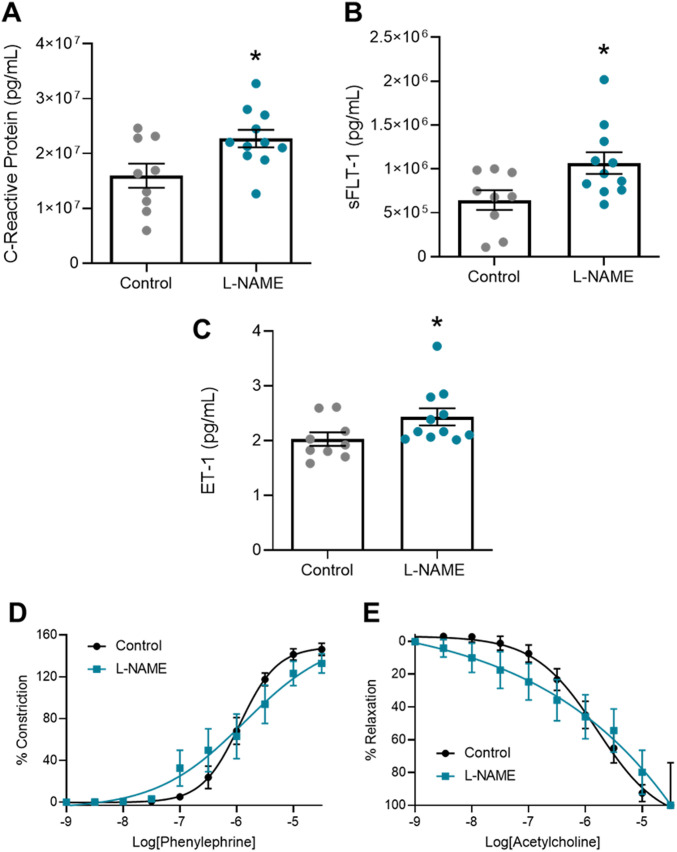
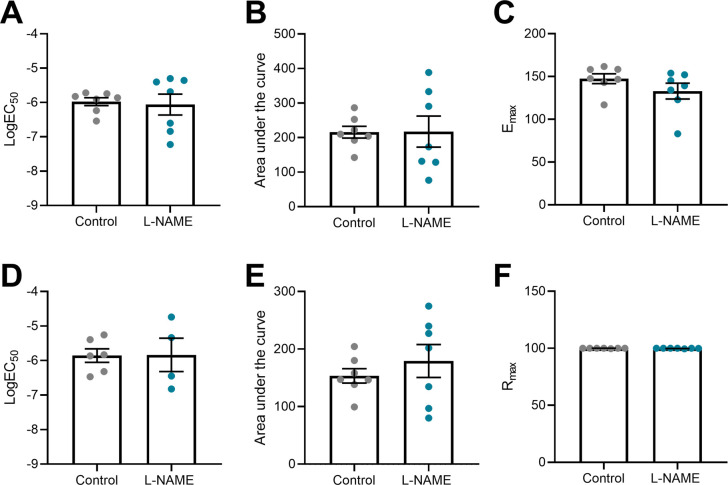
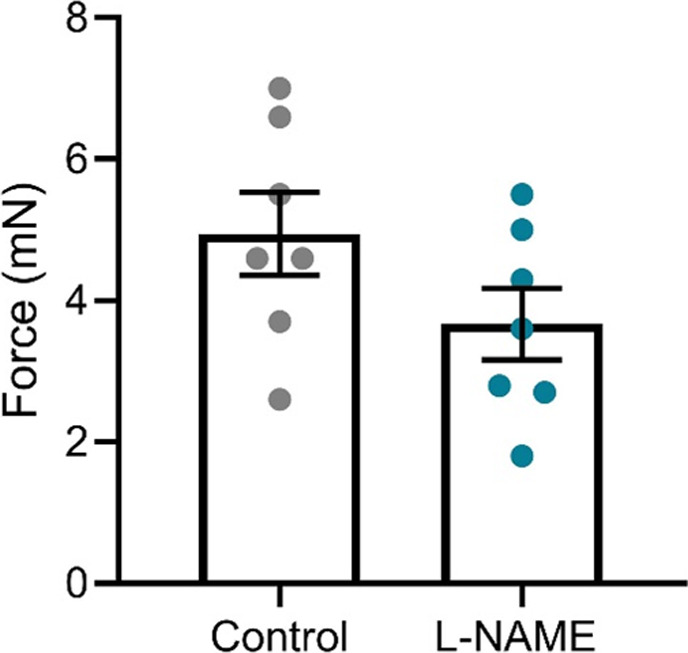
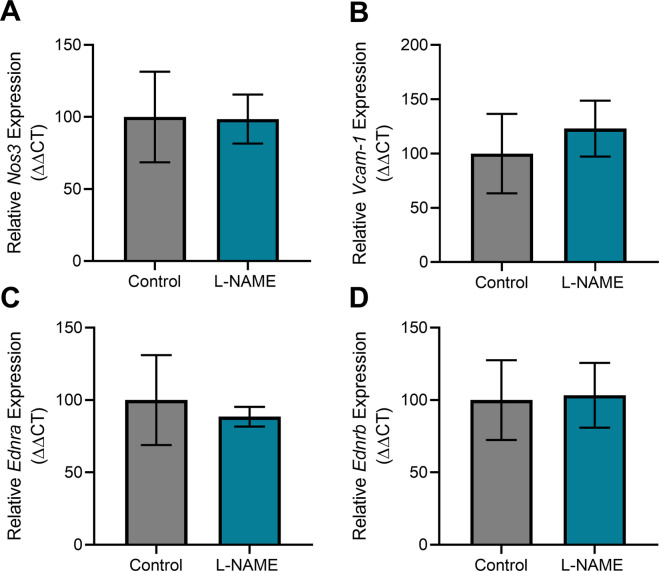
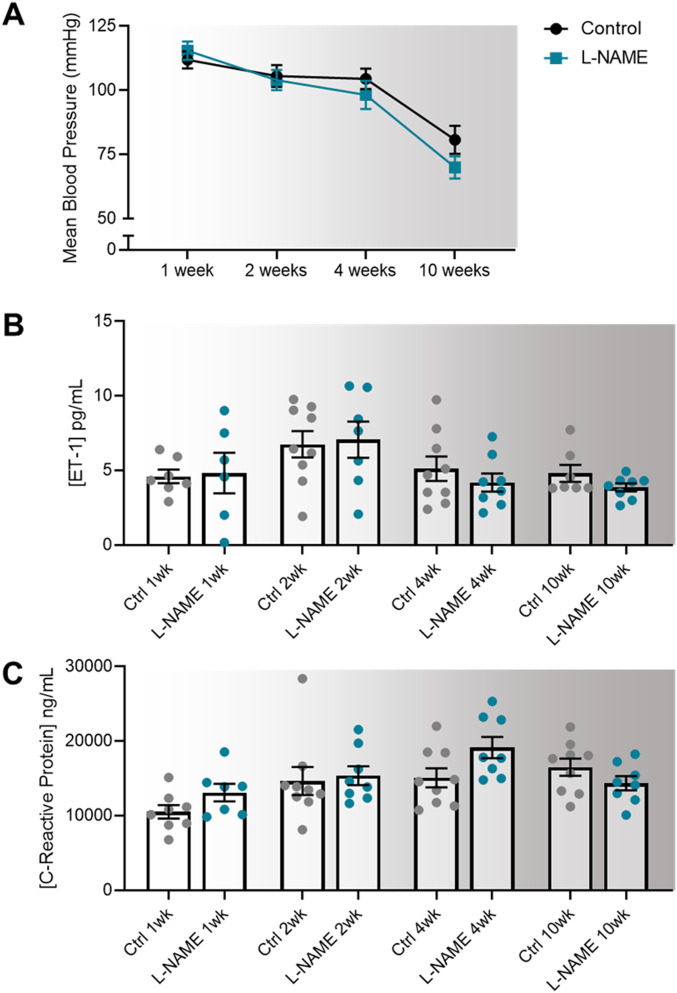
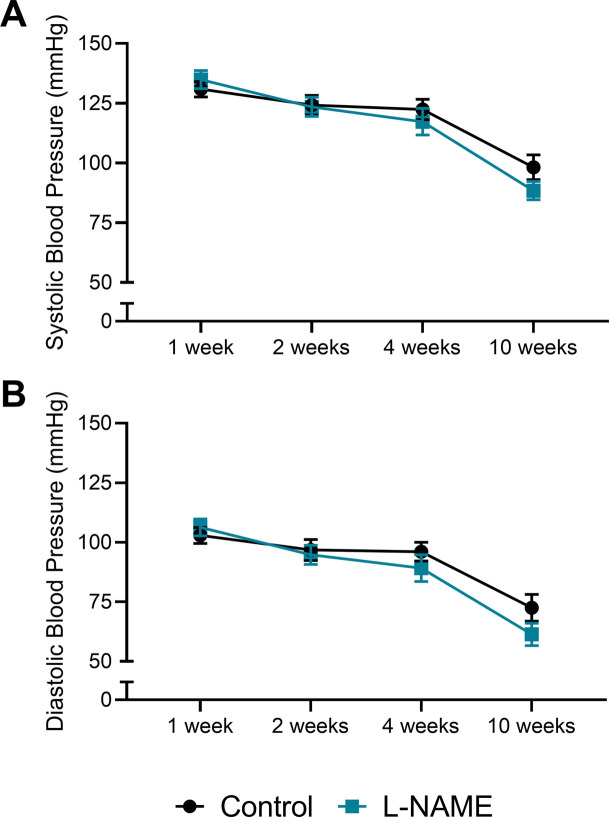
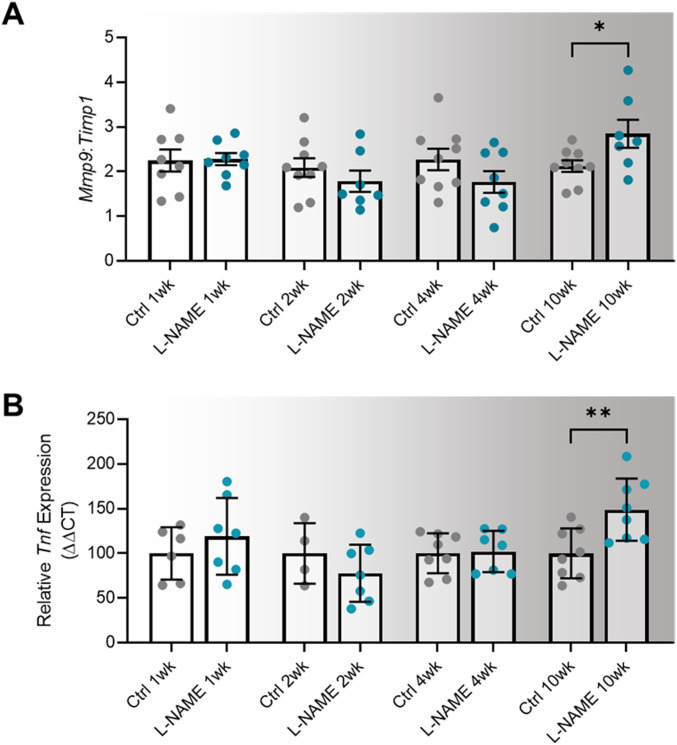
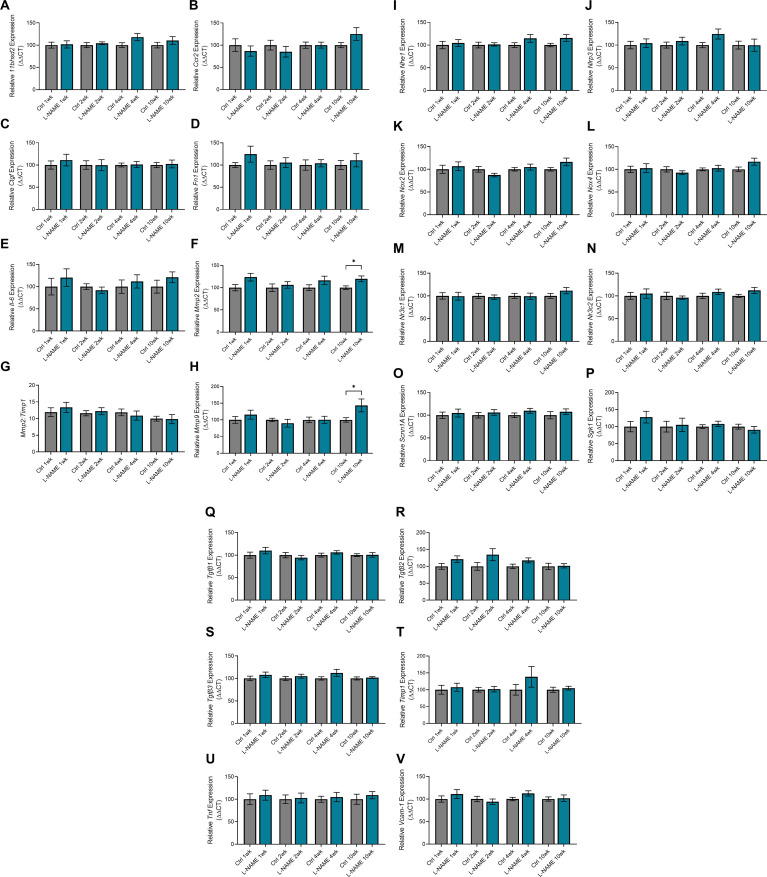
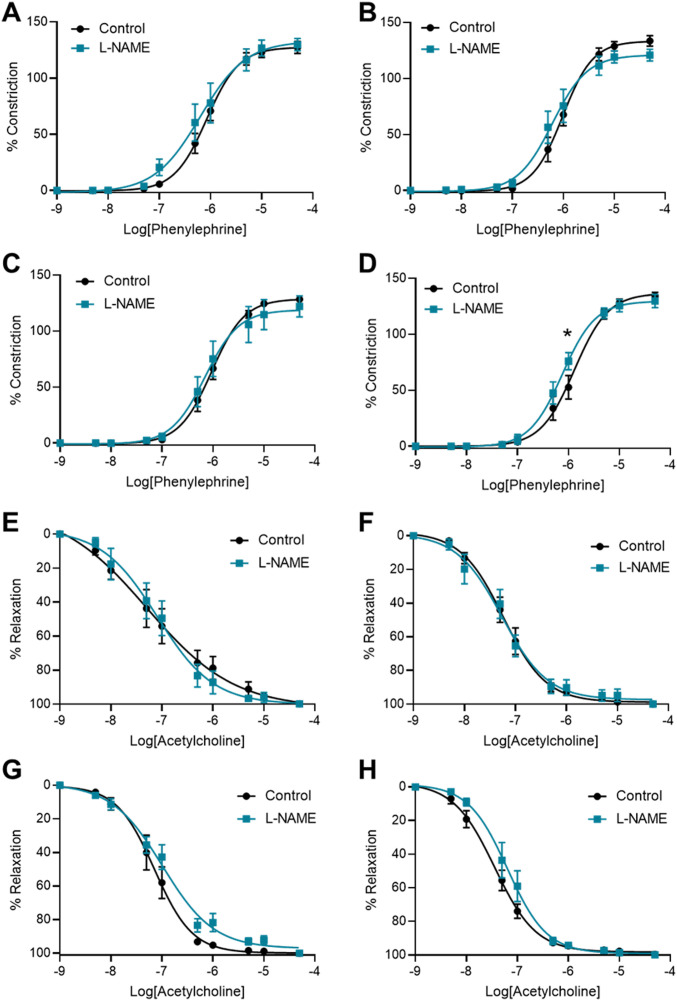
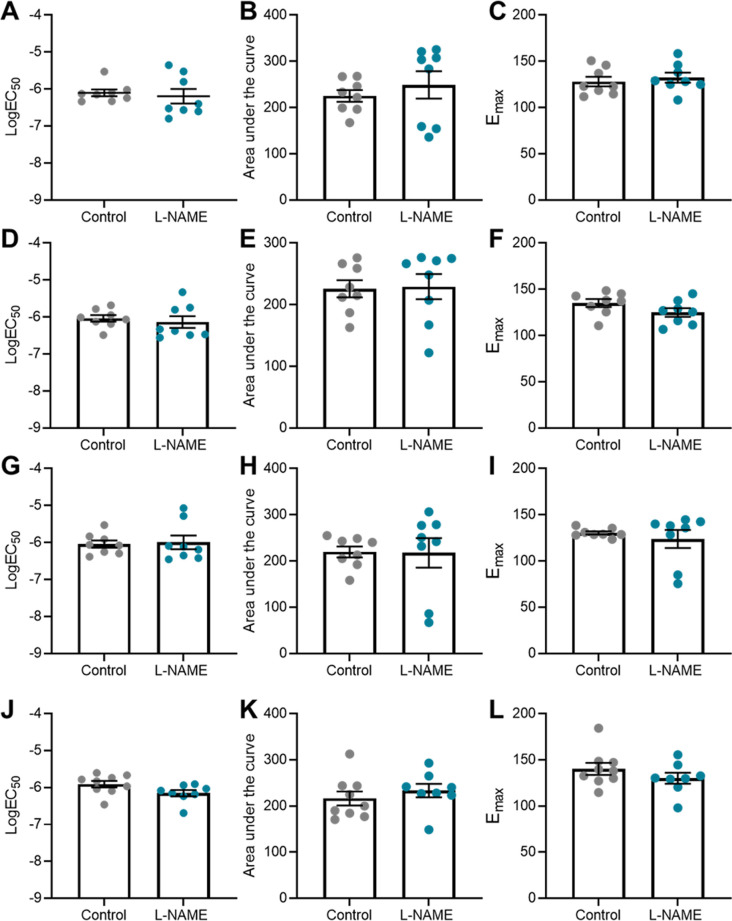
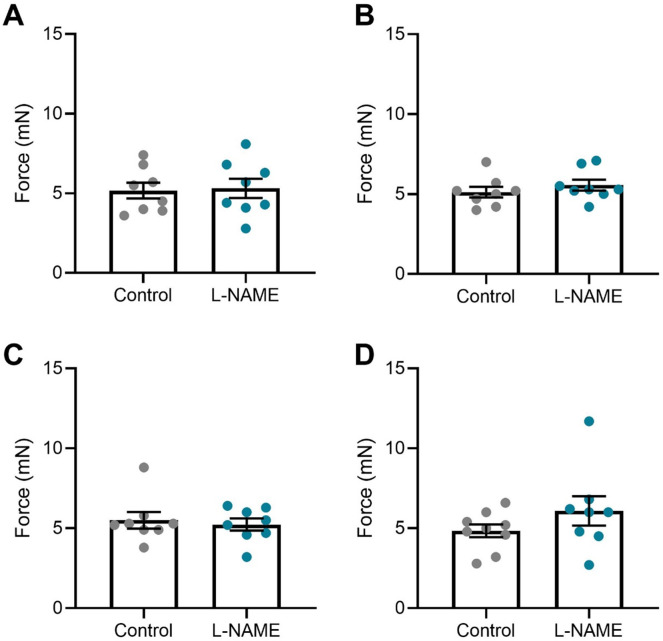
Preeclampsia affects ∼2-8% of pregnancies worldwide. It is associated with increased long-term maternal cardiovascular disease risk. This study assesses the effect of the vasoconstrictor N(ω)-nitro-L-arginine methyl ester (L-NAME) in modelling preeclampsia in mice, and its long-term effects on maternal cardiovascular health. In this study, we found that L-NAME administration mimicked key characteristics of preeclampsia, including elevated blood pressure, impaired fetal and placental growth, and increased circulating endothelin-1 (vasoconstrictor), soluble fms-like tyrosine kinase-1 (anti-angiogenic factor), and C-reactive protein (inflammatory marker). Post-delivery, mice that received L-NAME in pregnancy recovered, with no discernible changes in measured cardiovascular indices at 1-, 2-, and 4-wk post-delivery, compared with matched controls. At 10-wk post-delivery, arteries collected from the L-NAME mice constricted significantly more to phenylephrine than controls. In addition, these mice had increased kidney Mmp9:Timp1 and heart Tnf mRNA expression, indicating increased inflammation. These findings suggest that though administration of L-NAME in mice certainly models key characteristics of preeclampsia during pregnancy, it does not appear to model the adverse increase in cardiovascular disease risk seen in individuals after preeclampsia.


Conflict of interest statement

The authors declare that they have no conflict of interest.

Figures

Figure 1.
Figure 1.. Effect of L-NAME administration on mean arterial blood pressure E14.5 and E17.5 of pregnancy.
Blood pressure was measured by tail cuff plethysmography, (A) E14.5 mean blood pressure, (B) E17.5 mean blood pressure. (A, B) L-NAME administration significantly increased mean blood pressure from control levels at both time points. Data presented as mean ± SEM. Control n = 33–40, L-NAME n = 42–43. An unpaired t test was used to assess statistical differences between L-NAME and control group at each time point; ***P < 0.001 ****P < 0.0001.
Figure S1.
Figure S1.. Effect of L-NAME administration on systolic and diastolic arterial blood pressure at E14.5 and E17.5 of pregnancy.
Blood pressure measured by tail cuff plethysmography. (A, B, C, D) L-NAME administration significantly increased systolic and diastolic blood pressure at both (A, B) E14.5 and (C, D) E17.5 of pregnancy. Data presented as mean ± SEM. Control n = 33–40, L-NAME n = 42–43. An unpaired t test was used to assess statistical differences between L-NAME and control group at each time point; ***P < 0.001 ****P < 0.0001.
Figure 2.
Figure 2.. Effect of L-NAME on urine albumin to creatinine ratio, and kidney structure in pregnancy.
Maternal urine albumin and creatinine concentrations were measured via ELISA and enzymatic assay, respectively, at (A) E14.5 and (B) E17.5 of pregnancy. (A, B) Albumin to creatinine ratio was not significantly altered between the L-NAME and control mice. (C, D) Histology images of the cortex of PBS treated control mice kidneys show relatively normal glomeruli and tubules, with uniform staining. (E, F) Pathological features of L-NAME treated mice show inflammatory cell infiltration around regions of necrosis (black arrows) with haemoglobin (dark pink in section) and hyaline (light pink) casts that are surrounded by flattened nuclei and irregular cells (white arrows). Scale bar = 10 μm. Data presented as mean ± SEM. Control n = 26–28, L-NAME n = 36–39. A Mann–Whitney test was used to assess statistical differences in albumin:creatinine between L-NAME and control group at each time point.
Figure S2.
Figure S2.. Effect of L-NAME administration on expression of genes associated with renal function and dysfunction, collected at E17.5 of pregnancy.
Gene expression was assessed with qPCR. (A, B, C, D, E, F, H, J, K, L, M, N, O, P, Q, R, S, T, U, V, W) There was no significant change to any genes assessed in the kidneys collected from the mice treated with L-NAME compared to the controls (Ccr2, Ctgf, Fn1, Hsd11b2, Il-1β, Mmp2, Mmp9, Nhe1, Nlrp3, Nox2, Nox4, Nr3c1, Nr3c2, Sccn1a, Sgk1, Tgfβ1, Tgfβ2, Tgfβ3, Tnf, and Vcam1. (G, I) Mmp2 and Mmp9 expression were also expressed in a ratio to Timp1 (matrix metalloproteinase inhibitor) expression, but showed no significant difference between the control and L-NAME groups. Data presented as mean ± SEM. n = 6–10 mice/group. An unpaired t test (if normally distributed) or Mann–Whitney test was used to assess statistical differences between L-NAME and control group.
Figure 3.
Figure 3.. Effect of L-NAME administration on E17.5 fetal, placental, and Day 1 pup size.
(A) E17.5 fetal weight, (B) E17.5 placental weight, (C) E17.5 fetal to placental weight ratio, (D) E17.5 crown-to-rump length, (E) pup birthweight (F) pup crown-to-rump length at birth. (A, B, C, D) L-NAME administration in pregnancy significantly decreased E17.5 placental weight (B) and crown-to-rump length (D), but not fetal weight (A) or the fetal to placental weight ratio (C). (E, F) At birth, pups from mice administered L-NAME had reduced pup weight (E), with no significant change to crown-to-rump length (F). Data presented as mean ± SEM. E17.5 Litters: control n = 9, L-NAME n = 11. E17.5 fetuses: control n = 68, L-NAME n = 97. At birth, litters: Control n = 35, L-NAME n = 32. Pups: Control n = 274, L-NAME n = 246. Each column of points represents the fetuses, pups or placentas corresponding to each dam. Black line and error bars represent mean ± SEM within each litter. The red transparent line across each group represents the mean across all litters. Data were statistically analysed using a nested t test; *P < 0.05, **P < 0.01.
Figure 4.
Figure 4.. Effect of L-NAME administration on placental gene expression at E17.5.
Gene expression was assessed via qPCR. (B, G) Expression of Flt1 (B) and Hmox-1 (G) were significantly increased in placentas of mice administered L-NAME compared with control. (A, C, D, E, F) L-NAME did not alter placental expression of Vegfa, Plgf, Nos3, Tnf, or Vcam1. Data are presented as mean ± SEM. Control n = 6 mice, L-NAME n = 10 mice, 1–3 placentas were chosen at random from each. Samples with low RNA yield at extraction were excluded. Data were statistically analysed using an unpaired t test (if in normal distribution) or Mann–Whitney test; *P < 0.05, **P < 0.01.
Figure S3.
Figure S3.. Effect of L-NAME administration on placental structure.
(A, B, C, D) Effect of L-NAME administration on placental (A) cross sectional area, (B) blood space, (C) junctional zone, and (D) labyrinth zone. Placental histology was assessed using ScanScope system and Aperio ImageScope software. L-NAME did not significantly alter the cross-sectional area of the placenta. Placentas from the mice culled at E17.5 were chosen at random for analysis, each placenta from a different dam. Data presented as mean ± SEM. n = 3–5 mice/group. A Mann–Whitney test was used to assess statistical differences between L-NAME and control group.
Figure S4.
Figure S4.. Mean arterial blood pressure corresponding to subset of mice culled at E17.5 of pregnancy.
Blood pressure measured by tail cuff plethysmography. (A, B) L-NAME administration significantly increased systolic and diastolic blood pressure at both (A) E14.5 and (B) E17.5. These mice were used for further organ and blood assessments at E17.5. Data presented as mean ± SEM. Control n = 8–9, L-NAME n = 11. An unpaired t test was used to assess statistical differences between L-NAME and control group at each time point; *P < 0.05, ****P < 0.0001.
Figure 5.
Figure 5.. Effect of L-NAME administration on circulating factors associated with preeclampsia and vascular reactivity at E17.5 of pregnancy.
Circulating factors were measured by ELISA. Vascular reactivity of mesenteric arteries was assessed by wire myography. (D, E) Vasoconstriction to phenylephrine (E) Vasodilation to acetylcholine. (A, B, C) C-reactive protein, (B) sFLT-1, and (C) ET-1 were significantly increased in the mice administered L-NAME compared with controls. There was no change in vascular reactivity with L-NAME administration. LogEC50, area under the curve and maximal response for these curves are presented in Fig S5. Data are presented as mean ± SEM. Control n = 7–9 mice, L-NAME n = 7–11 mice. Levels of circulating factors were statistically analysed using an unpaired t test (for normal distribution) or Mann–Whitney test; *P < 0.05. Vascular response at each dose of agonist was statistically analysed using mixed-effects analysis with Šidák correction for multiple comparisons.
Figure S5.
Figure S5.. LogEC50, area under the curve and maximal response of mesenteric arteries collected at E17.5 of pregnancy to phenylephrine and acetylcholine.
(A, B, C, D, E, F) Vessels collected from mice administered L-NAME had no changes in LogEC50, area under the curve, maximal constriction (Emax) or relaxation (Rmax) compared with the controls, with addition of phenylephrine (A, B, C) or acetylcholine (D, E, F). Data presented as mean ± SEM. n = 7 mice/group. Ambiguous LogEC50 values excluded. Fig 5 presents the corresponding dose–response curves. A Mann–Whitney test was used to assess statistical differences between L-NAME and control group for each parameter.
Figure S6.
Figure S6.. Response of mesenteric arteries collected at E17.5 to high potassium physiological salt solution (100 mM).
Response was measured via wire myography. The arteries collected from mice administered L-NAME in pregnancy did not have significantly altered response to the high potassium solution compared with the arteries collected from the control mice. Data presented as mean ± SEM. n = 7 mice/group. Data were statistically analysed using an unpaired t test.
Figure S7.
Figure S7.. Effect of L-NAME administration on expression of genes associated with vascular function and endothelial dysfunction in mesenteric arteries collected at E17.5 of pregnancy.
Gene expression was assessed with qPCR. (A, B, C, D) There was no significant change in expression of nitric oxide synthase Nos3 (A), endothelial dysfunction marker Vcam-1 (B), or ET-1 receptors Ednra (C) and Ednrb (D) in the vessels collected from the mice treated with L-NAME compared with the controls. Data presented as mean ± SEM. Vessels from n = 9–10 mice/group at each time point were pooled (2–3 samples each pool). A Mann–Whitney test was used to test statistical differences between the L-NAME and control group.
Figure 6.
Figure 6.. Effect of L-NAME administration in pregnancy on mean arterial blood pressure, and serum levels of endothelin-1 and C-reactive protein at 1-,2-, 4-, and 10-wk post-delivery.
Blood pressure was measured via tail cuff plethysmography and circulating factors by ELISA. (A, B, C) L-NAME administration in pregnancy did not alter post-delivery (A) blood pressures, or circulating (B) ET-1 and (C) C-reactive protein levels at any time point. Data presented as mean ± SEM. Blood pressures–Control: 1 wk n = 35, 2 wk n = 27, 4 wk n = 15, 10 wk n = 9; L-NAME: 1 wk n = 32, 2 wk n = 24, 4 wk n = 13, 10 wk n = 8. ELISAs were carried out using serum samples from n = 6–9 mice/group at each time point. Data were statistically analysed between the L-NAME and control group at each time point with a unpaired t test (if in normal distribution) or Mann–Whitney test.
Figure S8.
Figure S8.. Effect of L-NAME administration in pregnancy on systolic and diastolic arterial blood pressure post-delivery.
Blood pressure measured via tail cuff plethysmography. (A, B) Neither systolic (A) nor diastolic (B) blood pressure of mice administered L-NAME during pregnancy were significantly different from control levels at 1, 2, 4, or 10 wk post-delivery. Data presented as mean ± SEM. Control: 1 wk n = 35, 2 wk n = 27, 4 wk n = 15, 10 wk n = 9; L-NAME: 1 wk n = 32, 2 wk n = 24, 4 wk n = 13, 10 wk n = 8. An unpaired t test (if in normal distribution) or Mann–Whitney test were used to compared blood pressure in the L-NAME and control groups at each time point.
Figure S9.
Figure S9.. Effect of L-NAME administration in pregnancy on albumin to creatinine ratio post-delivery.
Albumin and creatinine concentrations assessed via ELISA and enzymatic assay, respectively. There was no significant change in albumin:creatinine at any time point post-delivery. Data presented as mean ± SEM. n = 6–9 mice/group at each time point. A Mann–Whitney test was used for statistical analysis between the L-NAME and control group at each time point.
Figure 7.
Figure 7.. Effect of L-NAME administration in pregnancy on long-term expression of markers of dysfunction in the maternal heart and kidney.
(A) Kidney expression of Mmp9 presented as a ratio to Timp1 (its inhibitor) expression. (B) Heart expression of Tnf. Relative expression at 1-,2-,4-, and 10-wk post-delivery was assessed by qPCR. Kidney Mmp9:Timp1 and heart Tnf expression were not altered in mice administered L-NAME in pregnancy compared with control at 1-, 2-, 4-, or 10- wk post-delivery. At 10 wk post-delivery, mice administered L-NAME in pregnancy had significantly increased kidney Mmp9:Timp1 expression and increased heart Tnf expression. Data are presented as mean ± SEM. Data were statistically analysed between the L-NAME and control group at each time point with a unpaired t test (if in normal distribution) or Mann–Whitney test; *P < 0.05, **P < 0.01. n = 7–9 kidneys/group, n = 4–8 hearts/group at each time point.
Figure S10.
Figure S10.. Expression of genes associated with kidney function and dysfunction in mice administered L-NAME in pregnancy, at 1-, 2-, 4-, and 10-wk post-delivery.
Kidney gene expression assessed by qPCR. (A, B, C, D, E, I, J, K, L, M, N, O, P, Q, R, S, T, U, V) There were no changes in expression in 11Bhsd2, Ccr2, Ctgf, Fn1, IL-6, Nhe1, Nlrp3, Nox2, Nox4, Nr3c1, Nr3c2, Scnn1a, Sgk1, Tgfβ1, Tgfβ2, Tgfβ3, Timp1, Tnf, or Vcam-1 post-delivery. (F, G) Mmp2 was significantly elevated in the L-NAME group at 10 wk post-delivery (F), but Mmp2 expression as a ratio to Timp1 (its inhibitor) expression was not altered (G). (H) Mmp9 expression was significantly elevated in the L-NAME group at 10 wk post-delivery (H); expression as a ratio to Timp1 is presented in Fig 7A. Data presented as mean ± SEM. n = 7–9 mice/group at each time point. An unpaired t test (if in normal distribution) or Mann–Whitney test was used to assess statistical differences between L-NAME and control group at each time point.
Figure S11.
Figure S11.. Effect of L-NAME administration in pregnancy on expression of functional genes in hearts 1-, 2-, 4-, and 10 wk post-delivery.
Expression was assessed via qPCR. (A, B, C, D, E, F, H, J, K, L, M, N, O, P, Q, R, S) There were no changes in Bnp, Camk2a, Ccr2, Ctgf, Il-6, Mmp2, Mmp9, Nlrp3, Nox2, Nr3c1, Nr3c2, Tgfβ1, Tgfβ2, Tgfβ3, Timp1, or Vcam-1 gene expression at any time point post-delivery. (G, I) Mmp2 and Mmp9 expression were also expressed as a ratio to Timp1 expression, but both were not altered between the groups at any time point post-delivery. Data presented as mean ± SEM. n = 4–8 mice/group. An unpaired t test (if in normal distribution) or Mann–Whitney test was used to assess statistical differences between L-NAME and control group at each time point.
Figure 8.
Figure 8.. Effect of L-NAME administration in pregnancy on vascular reactivity post-delivery.
Effect of L-NAME administration in pregnancy on vascular reactivity measured in mesenteric arteries collected at 1 wk (A, E), 2 wk (B, F), 4 wk (C, G), and 10 wk (D, H) post-delivery. Vascular reactivity was assessed using ex vivo wire myography, assessing vasoconstriction to phenylephrine and vasodilation to acetylcholine. (A, B, C) Arteries collected from the mice administered L-NAME in pregnancy did not respond differently to phenylephrine compared with controls at the 1-, 2-, and 4-wk time points post-delivery. (D) At 10 wk post-delivery, the arteries collected from the mice that were administered L-NAME in pregnancy constricted significantly more than the control vessels at 10−6M phenylephrine. (E, F, G, H) The vessels collected from the mice administered L-NAME in pregnancy did not have altered vasodilation to acetylcholine at any time point post-delivery. LogEC50, area under the curve and maximal response for these curves are presented in Figs S12 and S13. Data presented as mean ± SEM. n = 7–9 mice/group at each time point. Vascular response at each dose of agonist were statistically analysed using mixed-effects analysis with Šidák correction for multiple comparisons.*P < 0.05.
Figure S12.
Figure S12.. LogEC50, area under the curve and maximal response of mesenteric arteries to phenylephrine post-delivery.
(A, B, C, D, E, F, G, H, I, J, K, L) LogEC50, area under the curve and maximal constriction of mesenteric arteries collected at 1 wk (A, B, C), 2 wk (D, E, F), 4 wk (G, H, I), and 10 wk (J, K, L). Vessels collected from mice administered L-NAME had no changes in LogEC50, area under the curve or maximal constriction (Emax) compared with the controls with addition of phenylephrine. Data presented as mean ± SEM. n = 7–9 mice/group. Ambiguous LogEC50 values excluded. Fig 8 presents the corresponding dose–response curves. An unpaired t test (if in normal distribution) or Mann–Whitney test was used to assess statistical differences between L-NAME and control group at each time point.
Figure S13.
Figure S13.. LogEC50, area under the curve and maximal response of mesenteric arteries to acetylcholine post-delivery.
(A, B, C, D, E, F, G, H, I, J, K, L) LogEC50, area under the curve and maximal relaxation of mesenteric arteries collected at 1 wk (A, B, C), 2 wk (D, E, F), 4 wk (G, H, I), and 10 wk (J, K, L) post-delivery. Vessels collected from mice administered L-NAME had no changes in LogEC50, area under the curve or maximal relaxation (Rmax) compared with the controls with addition of acetylcholine. Data presented as mean ± SEM. n = 7–9 mice/group. Ambiguous LogEC50 values excluded. Fig 7 presents the corresponding dose–response curves. An unpaired t test (if in normal distribution) or Mann–Whitney test was used to assess statistical differences between L-NAME and control group at each time point.
Figure S14.
Figure S14.. Mesenteric artery response to high potassium salt solution post-delivery.
(A, B, C, D) Response of mesenteric arteries collected at (A) 1 wk, (B) 2 wk, (C) 4 wk, and (D) 10 wk post-delivery to high potassium physiological salt solution (100 mM). Response was measured via wire myography. The arteries collected from mice administered L-NAME did not have significantly altered response to the high potassium solution compared with the arteries collected from the control mice at any time point assessed. Data presented as mean ± SEM. n = 7–9 mice/group. An unpaired t test (if in normal distribution) or Mann–Whitney test was used to assess statistical differences between L-NAME and control group.
Figure S15.
Figure S15.. Effect of L-NAME administration in pregnancy on post-delivery mesenteric artery expression of genes associated with vascular dysfunction.
Expression was assessed by qPCR at 1, 2, 4, and 10 wk post-delivery. (A, B, C, D) There was no change in expression of nitric oxide synthase Nos3 (A), endothelial dysfunction marker Vcam-1 (B), or ET-1 receptors Ednra (C) and Ednrb (D) in the mice administered L-NAME in pregnancy compared with the controls at any time point post-delivery. Data presented as mean ± SEM. Vessels from n = 8–9 mice/group at each time point were pooled. A Mann–Whitney test was used to assess statistical differences between L-NAME and control group at each time point.

Similar articles

Cited by

References

    1. Duley L (2009) The global impact of pre-eclampsia and eclampsia. Semin Perinatol 33: 130–137. 10.1053/j.semperi.2009.02.010 - DOI - PubMed
    1. Kuklina EV, Ayala C, Callaghan WM (2009) Hypertensive disorders and severe obstetric morbidity in the United States. Obstet Gynecol 113: 1299–1306. 10.1097/aog.0b013e3181a45b25 - DOI - PubMed
    1. Paruk F, Moodley J (2000) Maternal and neonatal outcome in early- and late-onset pre-eclampsia. Semin Neonatol 5: 197–207. 10.1053/siny.2000.0023 - DOI - PubMed
    1. Roberts JM, Escudero C (2012) The placenta in preeclampsia. Pregnancy Hypertens 2: 72–83. 10.1016/j.preghy.2012.01.001 - DOI - PMC - PubMed
    1. Powe CE, Levine RJ, Karumanchi SA (2011) Preeclampsia, a disease of the maternal endothelium: The role of antiangiogenic factors and implications for later cardiovascular disease. Circulation 123: 2856–2869. 10.1161/circulationaha.109.853127 - DOI - PMC - PubMed

Publication types

MeSH terms