. 2022 Oct 18;41(3):111522.
doi: 10.1016/j.celrep.2022.111522.

Genomic landscape of drug response reveals mediators of anthelmintic resistance

Affiliations

Genomic landscape of drug response reveals mediators of anthelmintic resistance

Stephen R Doyle et al. Cell Rep. .

Abstract

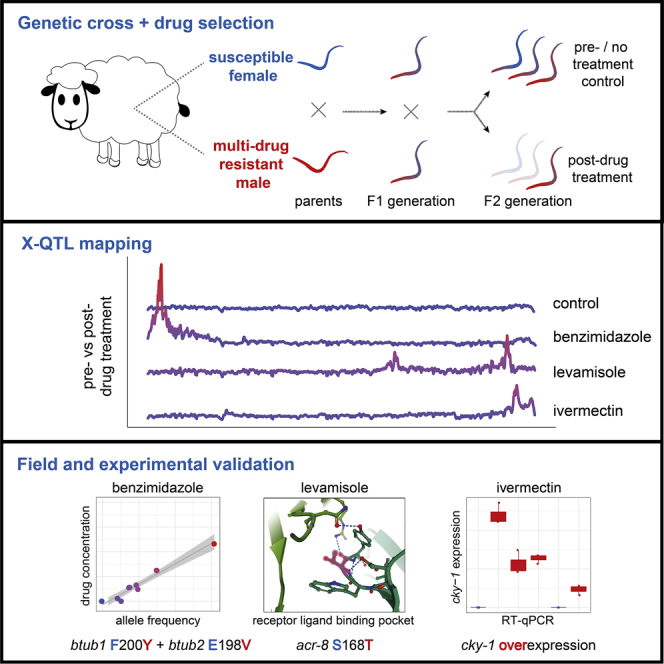
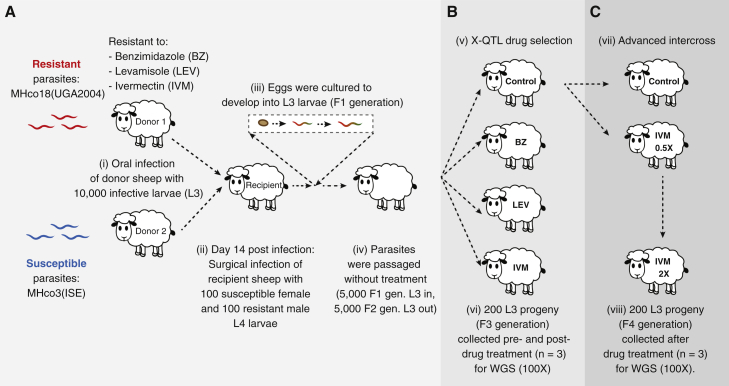
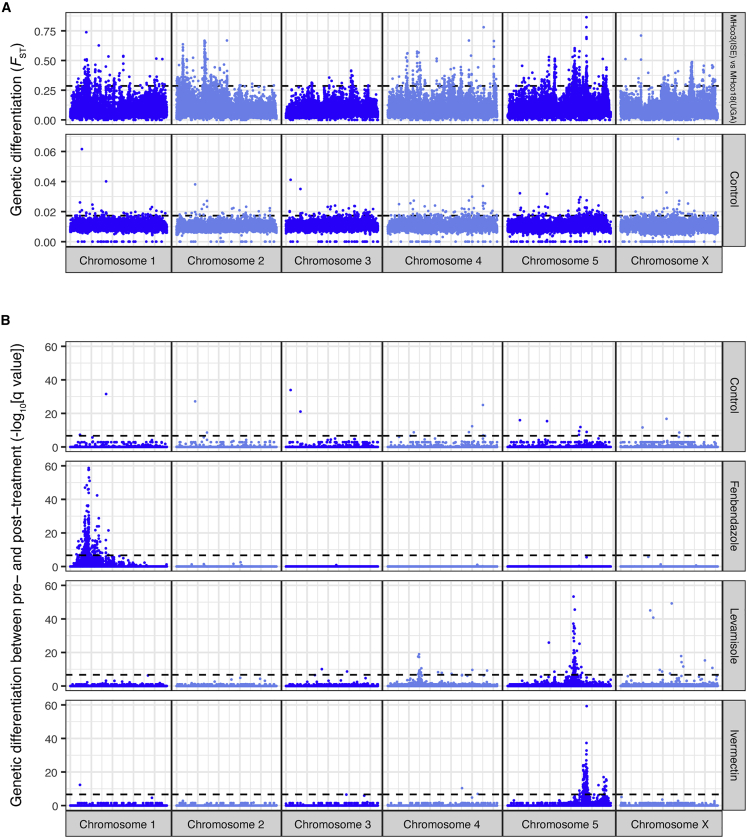
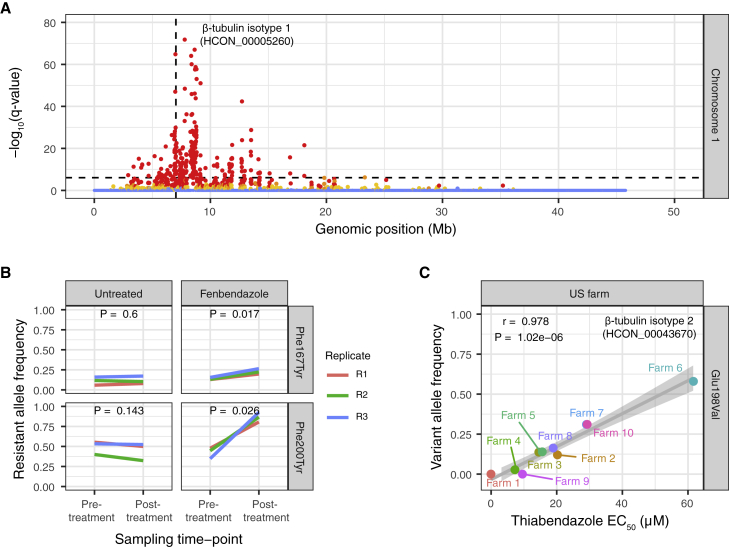
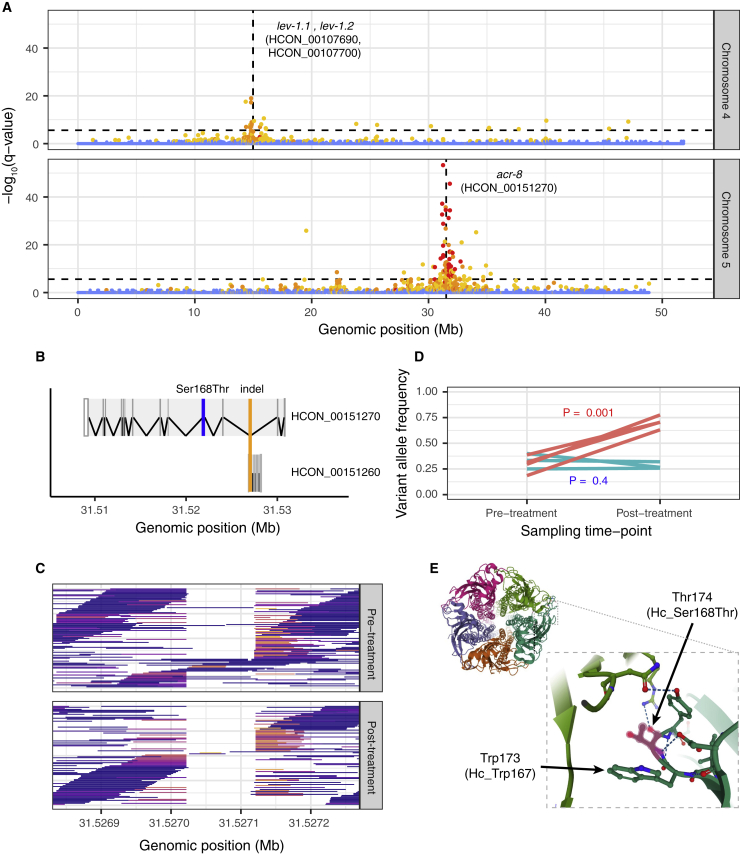
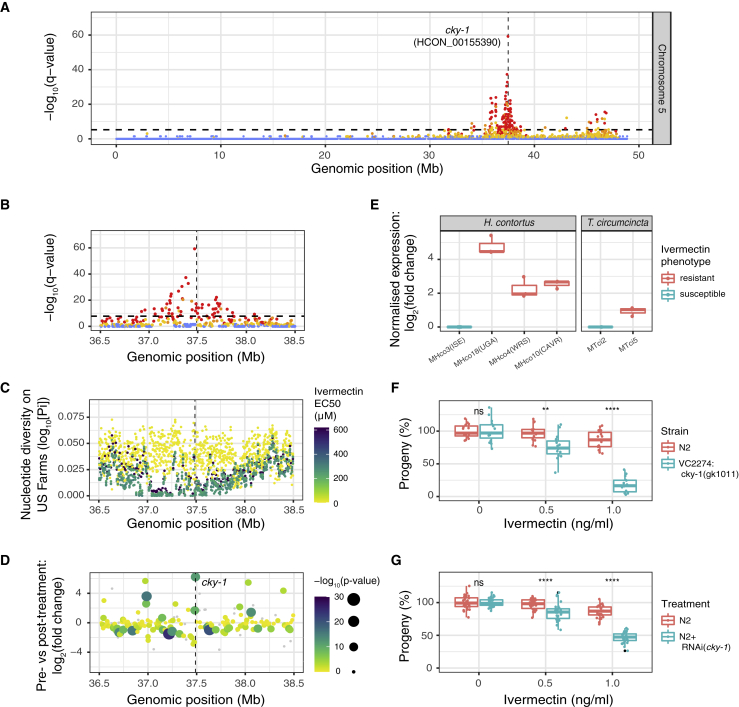
Like other pathogens, parasitic helminths can rapidly evolve resistance to drug treatment. Understanding the genetic basis of anthelmintic drug resistance in parasitic nematodes is key to tracking its spread and improving the efficacy and sustainability of parasite control. Here, we use an in vivo genetic cross between drug-susceptible and multi-drug-resistant strains of Haemonchus contortus in a natural host-parasite system to simultaneously map resistance loci for the three major classes of anthelmintics. This approach identifies new alleles for resistance to benzimidazoles and levamisole and implicates the transcription factor cky-1 in ivermectin resistance. This gene is within a locus under selection in ivermectin-resistant populations worldwide; expression analyses and functional validation using knockdown experiments support that cky-1 is associated with ivermectin survival. Our work demonstrates the feasibility of high-resolution forward genetics in a parasitic nematode and identifies variants for the development of molecular diagnostics to combat drug resistance in the field.

Keywords: CP: Microbiology; CP: Molecular biology; Haemonchus contortus; anthelmintic resistance; benzimidazole; cky-1; forward genetics; genetic cross; genome-wide association; helminth; ivermectin; levamisole.


Conflict of interest statement

Declaration of interests The authors declare no competing interests.

Figures

None
Graphical abstract
Figure 1
Figure 1
Outline of the genetic cross, X-QTL, and advanced intercross experiments (A) A genetic cross between the anthelmintic susceptible MHco3(ISE) and multi-drug-resistant MHco18(UGA) was used to map genetic loci associated with fenbendazole, levamisole, and ivermectin drug treatment. (B) An X-QTL experiment was performed on the F2 generation exposed to fenbendazole, levamisole, or ivermectin or not treated. (C) An advanced intercross experiment using the F3 generation was subjected to a half-dose followed by a double-standard dose of ivermectin. For both the X-QTL and advanced intercross experiments, pools of L3 (n = 200) were collected pre- and post-treatment from drug-exposed and time-matched untreated controls, performed in triplicate (Figure S1). Whole-genome sequencing was performed, and genetic diversity between pre- and post-treatment was compared.
Figure 2
Figure 2
A genetic cross followed by drug selection reveals discrete QTLs associated with each anthelmintic drug class (A) Genome-wide comparison of susceptible MHco3(ISE) and multidrug-resistant MHco18(UGA) parental strains revealed broad-scale genetic differentiation (FST) on all chromosomes. In contrast, after the genetic cross, these signals of differentiation are lost in an untreated control (time-matched samples to the drug-treated groups). The dashed line represents the mean FST + 3 standard deviations. (B) Comparison of genome-wide differentiation between F3 generation pooled infective-stage larvae (L3, n = 200) sampled pre- and post-treatment revealed distinct genomic regions or QTLs associated with fenbendazole, levamisole, and ivermectin drug treatment. In all plots, each point represents the -log10 q value from the Z score distribution of mean genetic differentiation (FST) from three biological replicates per 5 kb sliding window throughout the genome. The dashed line represents the Bonferroni genome-wide level of significance (α = 0.05, n = 56,476 windows). See Figure S1 for genome-wide replicate data of the drug selection experiments.
Figure 3
Figure 3
Characterization of QTLs associated with benzimidazole resistance (A) Chromosome-wide genetic differentiation between pre- and post-fenbendazole treatment on chromosome 1. Each point represents the -log10 q value from the Z score distribution of mean genetic differentiation (FST) from three biological replicates per 5 kb sliding window throughout the genome; points are colored based on the concordance of individual replicates indicated by none (blue), 1 of 3 (yellow), 2 of 3 (orange), or all 3 (red) above the genome-wide threshold. The horizontal dashed line represents the Bonferroni genome-wide level of significance (α = 0.05, n = 56,476 windows). (B) Allele frequency change at Phe167Tyr and Phe200Tyr variant positions of β-tubulin isotype 1 pre- and post-treatment, including untreated time-matched control. Colored lines represent individual biological replicates (n = 3). p values are calculated using pairwise t tests of allele frequency by sampling time point (i.e., pre- and post-treatment). (C) Correlation between thiabendazole EC50 concentration (μM, measured using the in vitro DrenchRite assay) and Glu198Val variant frequency of β-tubulin isotype 2 (HCON_00043670) on US farms. Pearson’s correlation (r) and associated p value together with the trendline and standard error of the linear regression are shown.
Figure 4
Figure 4
Characterization of QTLs associated with levamisole resistance (A) QTLs between pre-treatment and levamisole-treated parasites on chromosome 4 (top) and chromosome 5 (bottom). Each data point represents the -log10 q value from the Z score distribution of mean genetic differentiation (FST) from three biological replicates per 5 kb sliding window throughout the genome; points are colored based on the concordance of individual replicates indicated by none (blue), 1 of 3 (yellow), 2 of 3 (orange), or all 3 (red) above the genome-wide threshold. The horizontal dashed line represents the Bonferroni genome-wide level of significance (α = 0.05, n = 56,476 windows). (B) Gene model for acr-8 (top; HCON_00151270) and a cuticle collagen (bottom; HCON_00151260), highlighting the position of the overlapping acr-8/levamisole-associated indel (orange line) and the Ser168Thr variant (blue line) of acr-8. (C) Visualization of sequencing reads supporting the acr-8 intronic indel. Mapped reads are colored to reflect the degree to which they have been clipped to allow correct mapping in the presence of the deletion, i.e., reads that have not been clipped are blue, whereas reads that are moderate to highly clipped are colored red to yellow, respectively. (D) Comparison of Ser168Thr variant frequency between pre- and post-levamisole treatment (red) and time-matched untreated controls (green). Each line represents a biological replicate (n = 3). (E) Structure of the pentameric Cys-loop acetylcholine receptor of Torpedo marmorata (Protein DataBase ID: 4AQ9), one of the few species from which the receptor’s structure has been resolved (Unwin and Fujiyoshi, 2012). The Trp[Ser/Thr]Tyr motif is highly conserved among the clade V nematodes (Figure S6) and the distantly related alpha subunit of T. marmorata; Thr174, the homologous position of the H. contortus Hc_Ser168Thr variant of acr-8, lies within the acetylcholine binding pocket at the interface of the alpha and gamma subunits and adjacent to Trp173 (H. contortus Hc_Trp167), a residue essential for ligand binding.
Figure 5
Figure 5
Characterization of the major QTL associated with ivermectin resistance (A) QTL between pre- and post-ivermectin treatment on chromosome 5. Each data point represents the -log10 q value from the Z score distribution of mean genetic differentiation (FST) from three biological replicates per 5 kb sliding window throughout the genome; points are colored based on the concordance of individual replicates indicated by none (blue), 1 of 3 (yellow), 2 of 3 (orange), or all 3 (red) above the FST genome-wide threshold. The horizontal dashed line represents the Bonferroni genome-wide level of significance (α = 0.05, n = 56,476 windows). A magnified aspect of the main chromosome 5 QTL, highlighting (B) -log10 q value of FST in the X-QTL cross, and (C) nucleotide diversity (Pi) on US farms, where each farm is colored by the degree of ivermectin resistance (EC50) measured by larval development assays. In (A), (B), (C), and (D), the position of cky-1 is indicated by the vertical dashed line. (D) Reanalysis of RNA-seq data from (Laing et al., 2022), highlighting the position of cky-1 in the QTL and overexpression after treatmenI(E) RT-qPCR analysis of cky-1 expression in H. contortus and T. circumcincta strains that differ in their ivermectin resistance phenotype. Data represent log2-transformed expression normalized to actin or GAPDH control genes for H. contortus and T. circumcincta, respectively, from three independent experiments. Downregulation of cky-1 expression in C. elegans by either (F) a balanced deletion or (G) RNAi-knockdown increases ivermectin sensitivity relative to the control N2 strain, based on developmental assays (n = 3 independent experiments) measuring the percentage of progeny surviving to adulthood relative to DMSO controls. In (F) and (G), each point represents an independent treatment condition, normalized to a DMSO control without ivermectin. A Kruskal-Wallis test was used to determine whether treatment condition differed from untreated control, where ns = not significant, p < 0.05, ∗∗p < 0.01, and ∗∗∗∗p < 0.0001. Boxplots in (E), (F), and (G) show the median, 25th, and 75th percentiles of the data. The whiskers extend 1.5 times the inter-quartile range.

References

    1. Avramenko R.W., Redman E.M., Melville L., Bartley Y., Wit J., Queiroz C., Bartley D.J., Gilleard J.S. Deep amplicon sequencing as a powerful new tool to screen for sequence polymorphisms associated with anthelmintic resistance in parasitic nematode populations. Int. J. Parasitol. 2019;49:13–26. - PubMed
    1. Baker R.H., Buschbaum S., Matthews J.B., McKendrick I.J., Schnieder T., Strube C., Nisbet A.J. GTP-Cyclohydrolase and development in Teladorsagia circumcincta and Dictyocaulus viviparus (Nematoda: Strongylida) Exp. Parasitol. 2011;128:309–317. - PubMed
    1. Baltrušis P., Doyle S.R., Halvarsson P., Höglund J. Genome-wide analysis of the response to ivermectin treatment by a Swedish field population of Haemonchus contortus. Int. J. Parasitol. Drugs Drug Resist. 2022;18:12–19. - PMC - PubMed
    1. Barrère V., Beech R.N., Charvet C.L., Prichard R.K. Novel assay for the detection and monitoring of levamisole resistance in Haemonchus contortus. Int. J. Parasitol. 2014;44:235–241. - PubMed
    1. Bartley D.J., Jackson F., Jackson E., Sargison N. Characterisation of two triple resistant field isolates of Teladorsagia from Scottish lowland sheep farms. Vet. Parasitol. 2004;123:189–199. - PubMed

Publication types

LinkOut - more resources