. 2022 Oct 18;41(3):111495.
doi: 10.1016/j.celrep.2022.111495.

MicroRNA mediated regulation of the onset of enteroblast differentiation in the Drosophila adult intestine

Affiliations

MicroRNA mediated regulation of the onset of enteroblast differentiation in the Drosophila adult intestine

Sromana Mukherjee et al. Cell Rep. .

Abstract

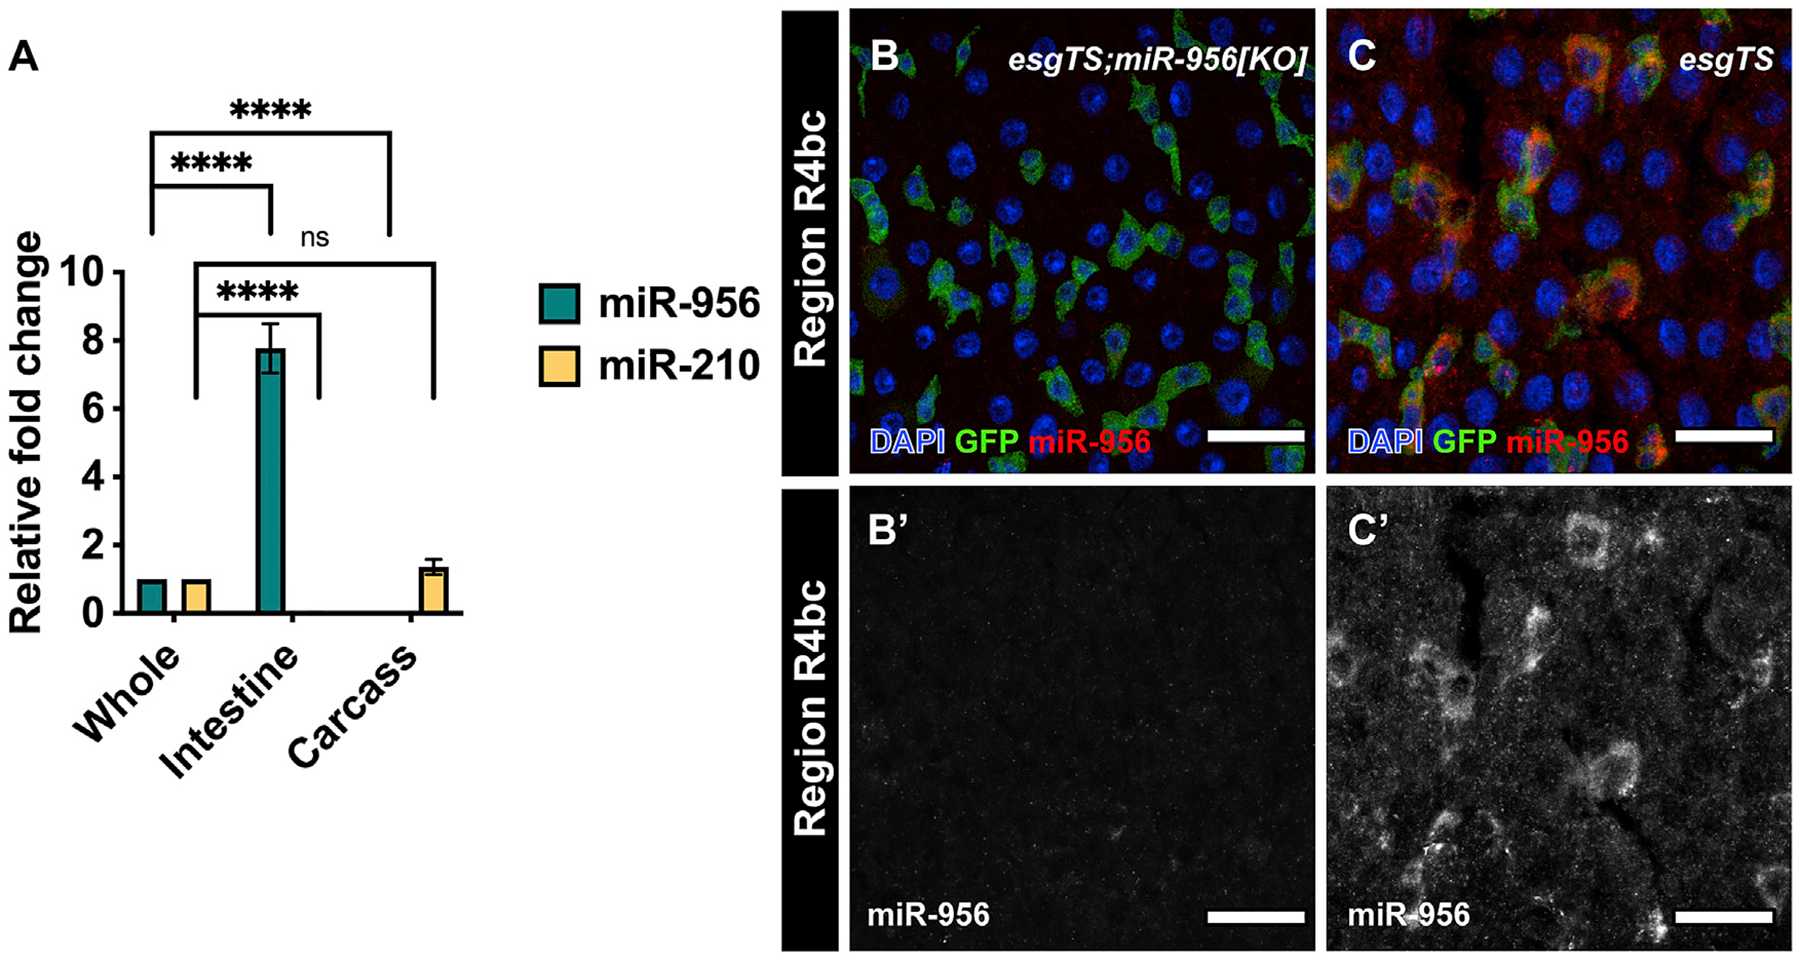
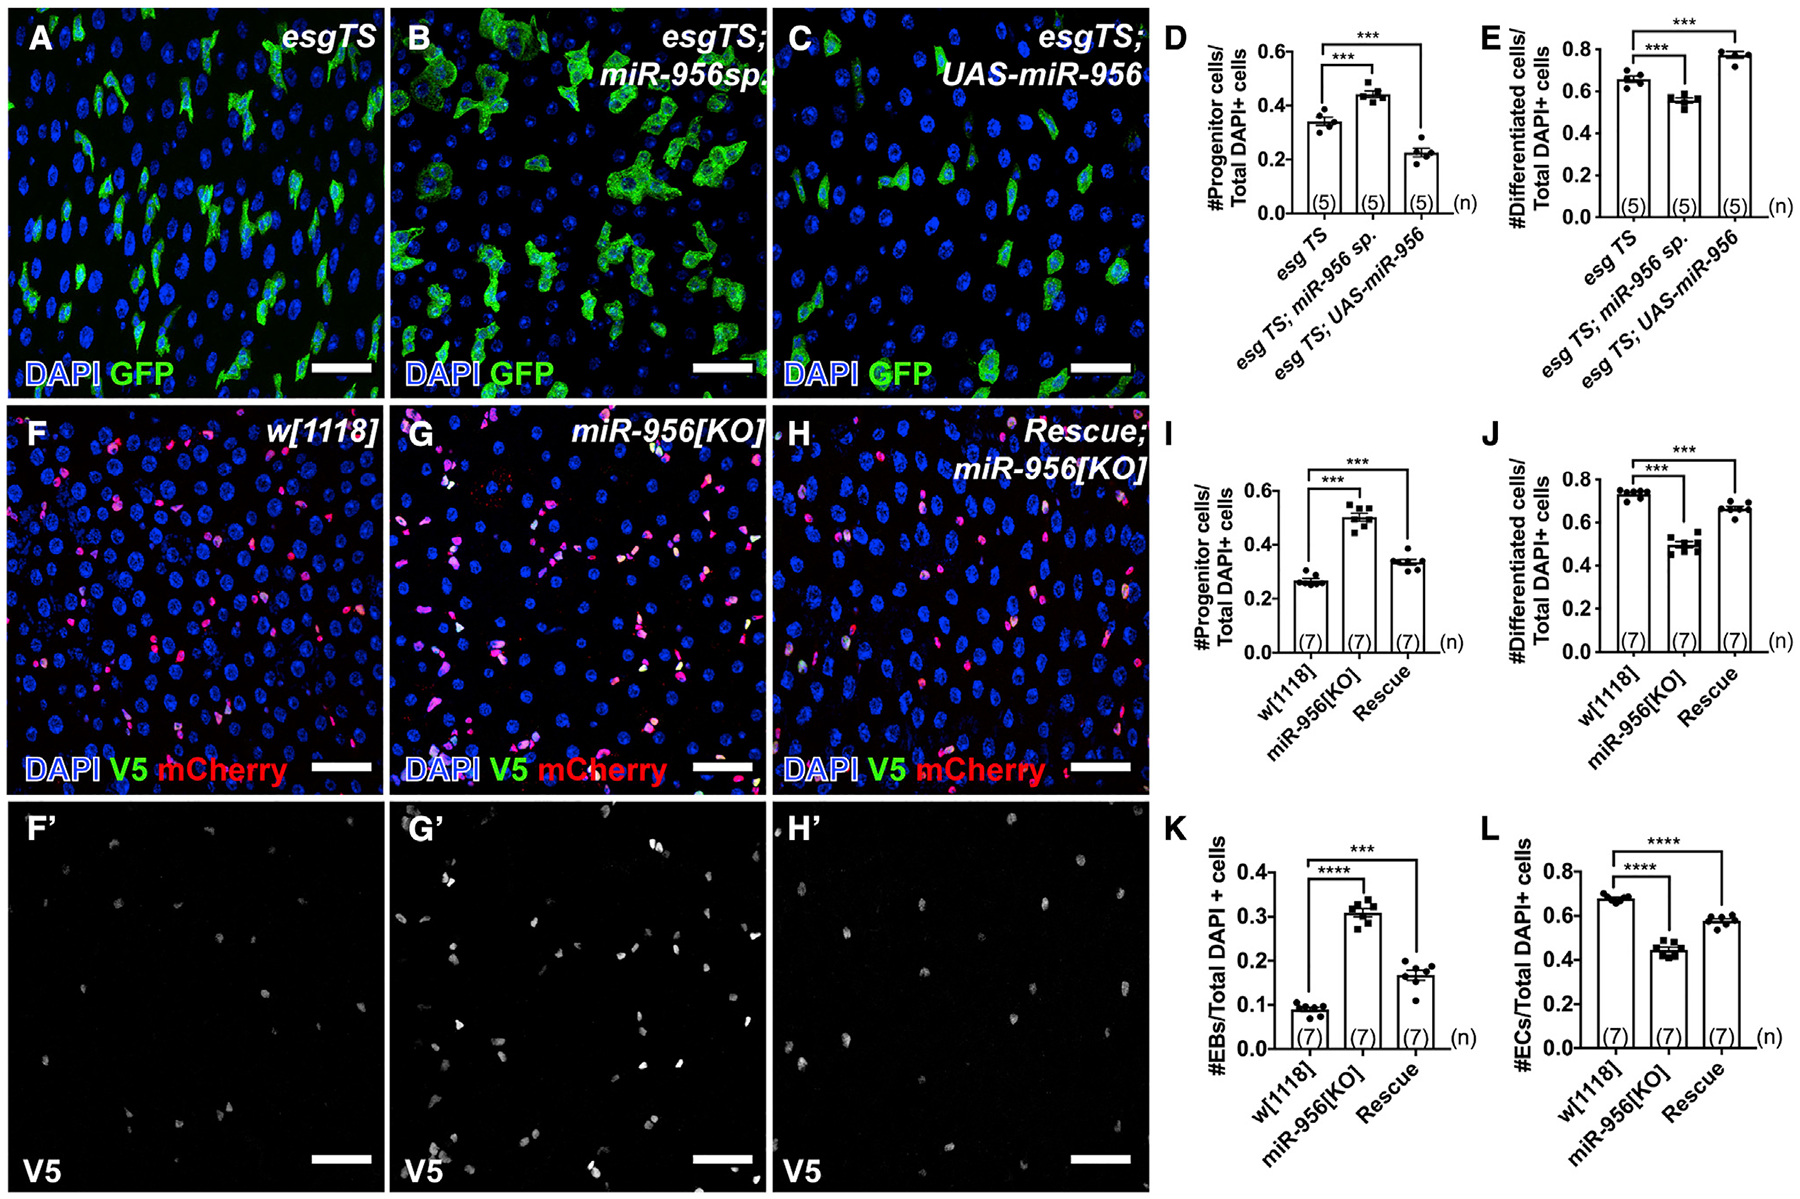
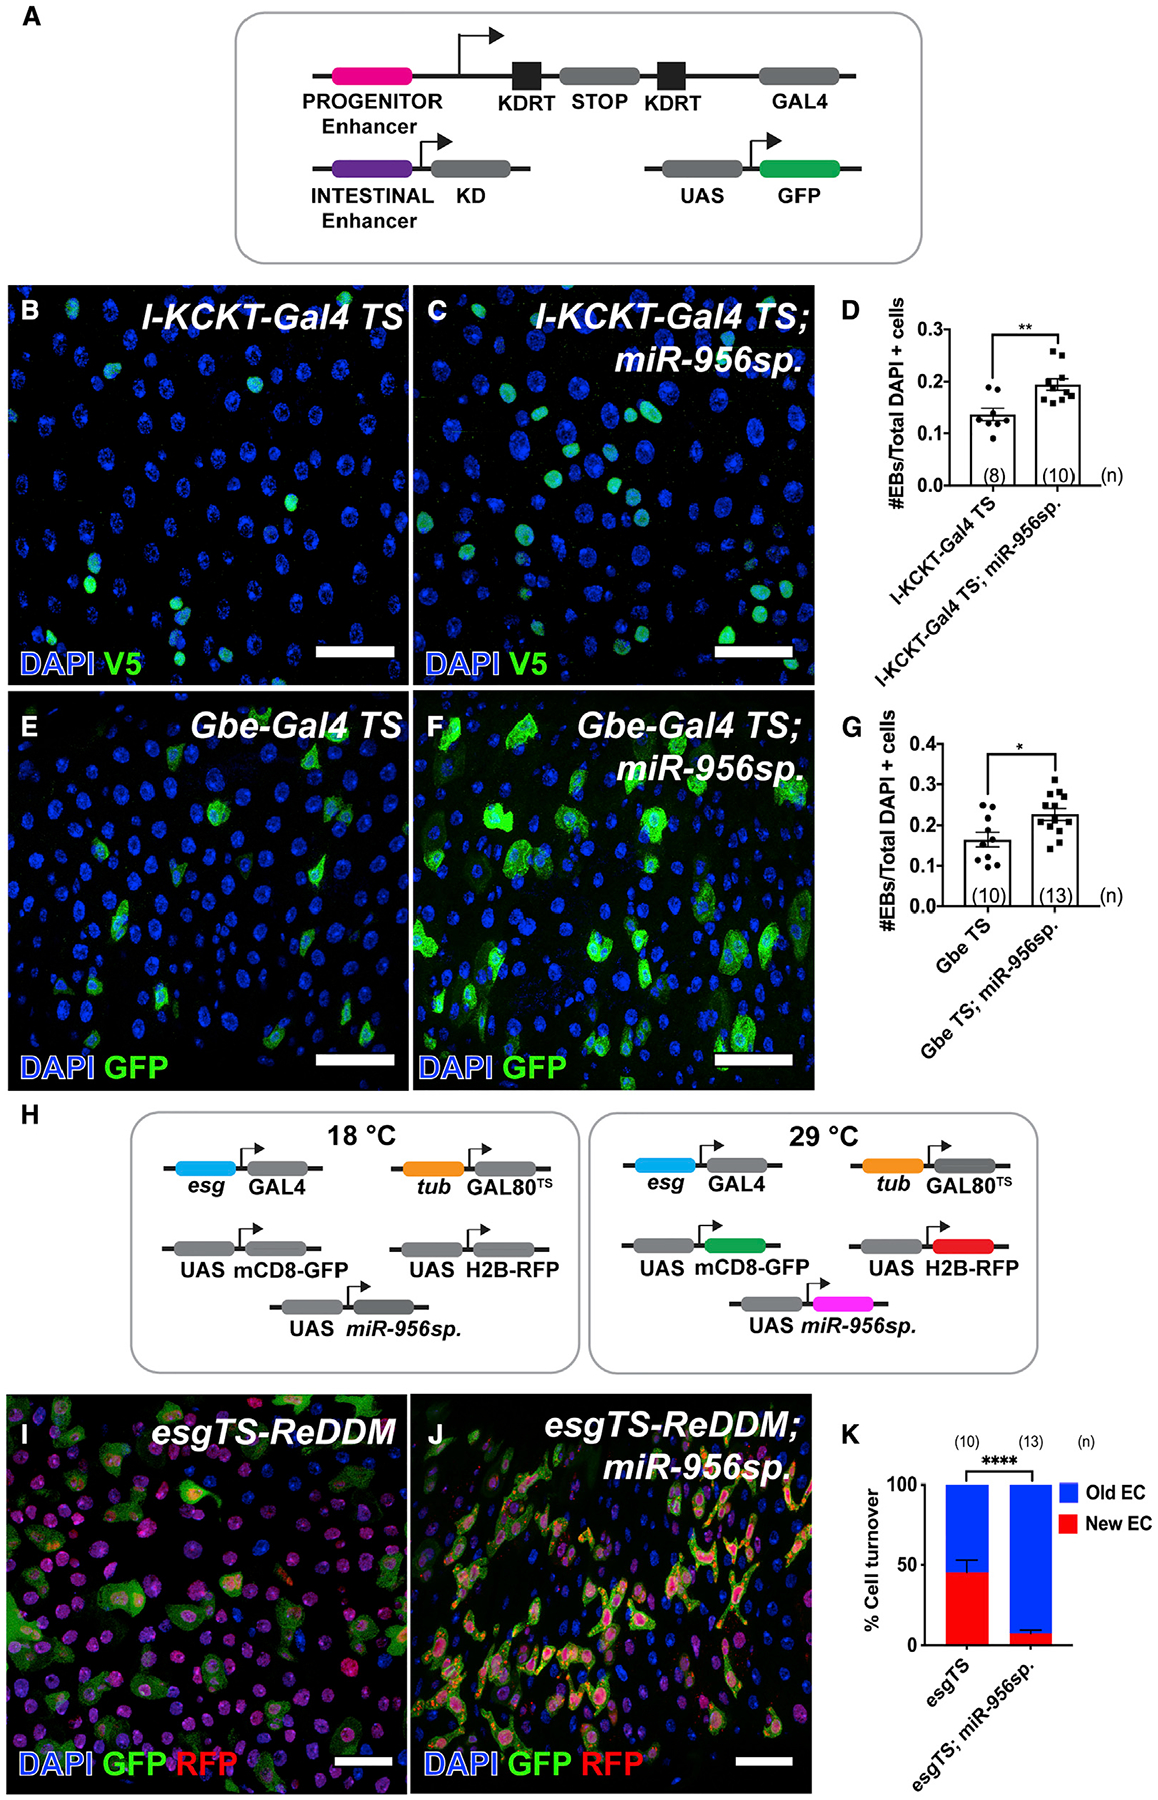
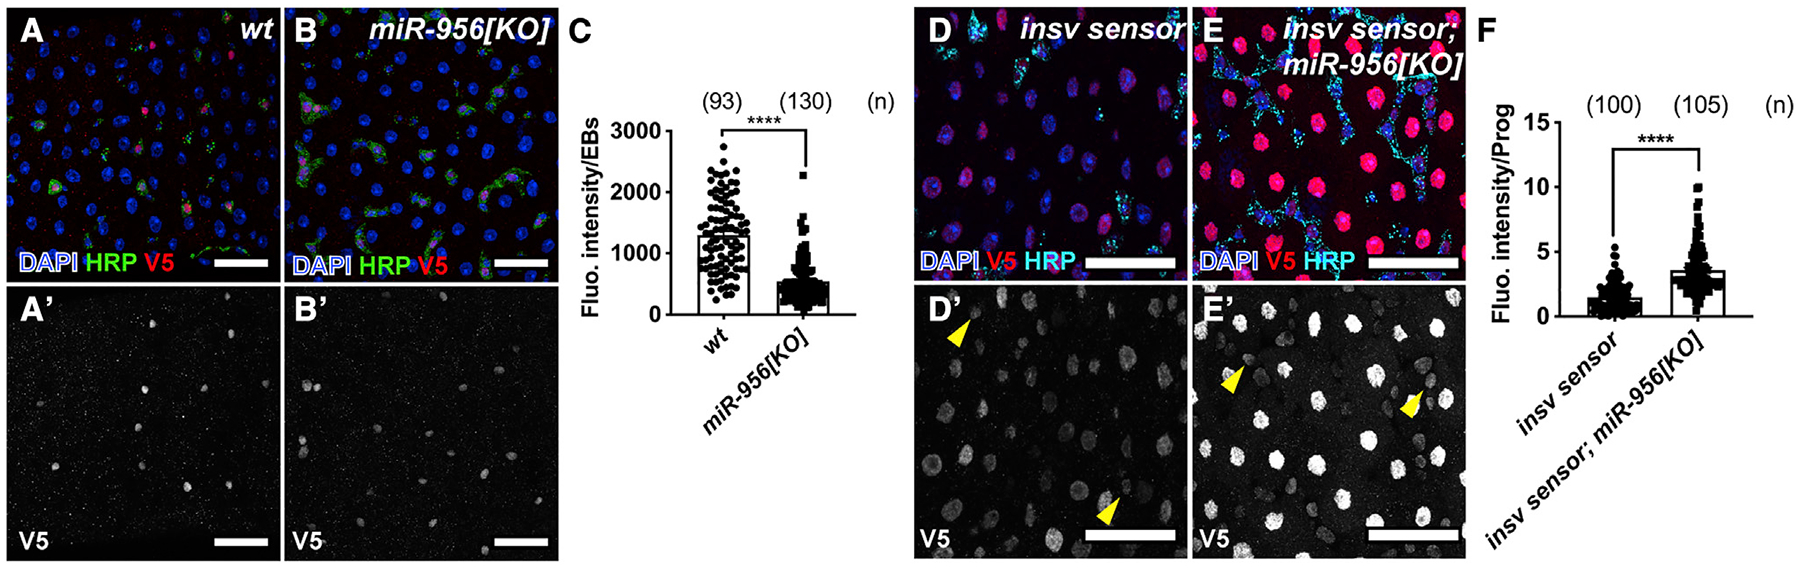
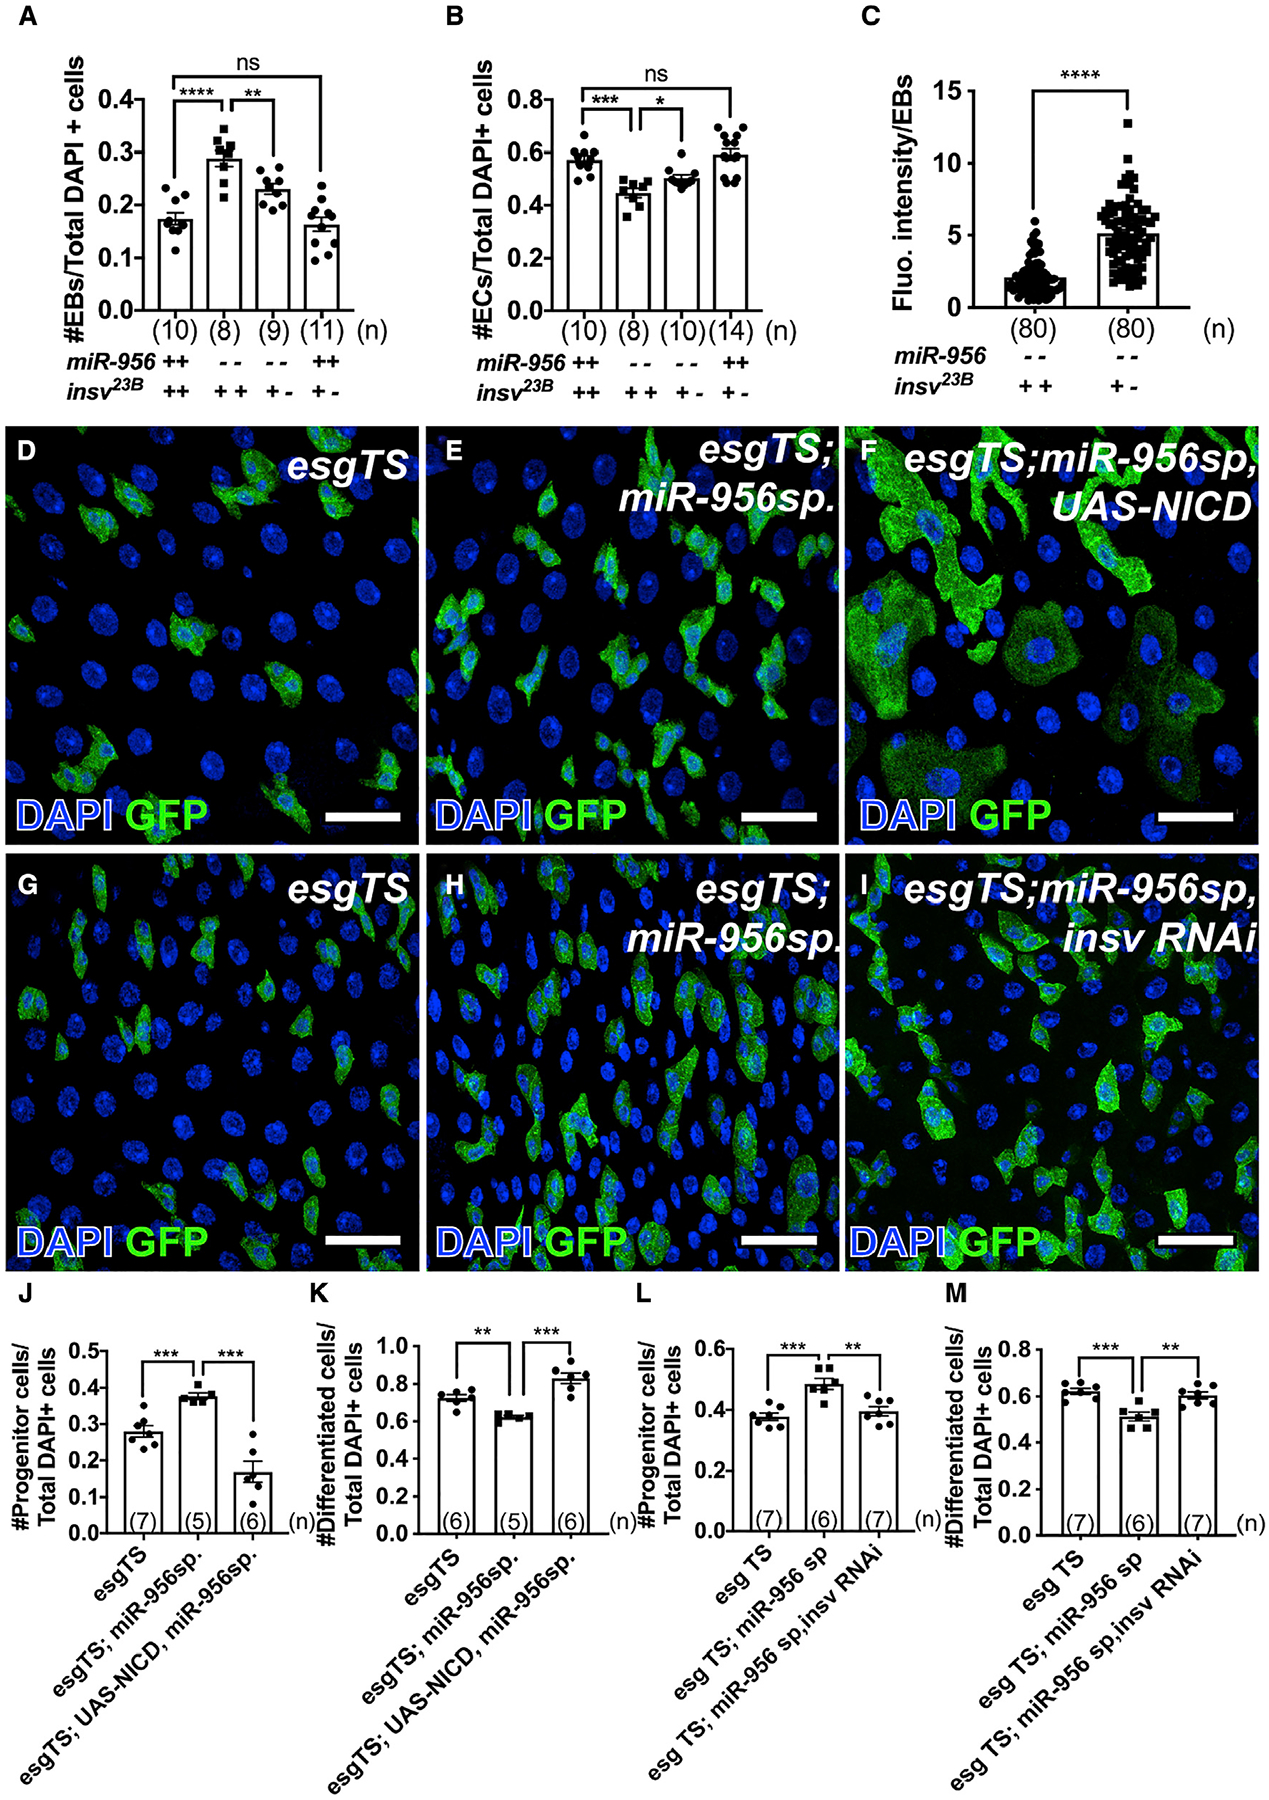
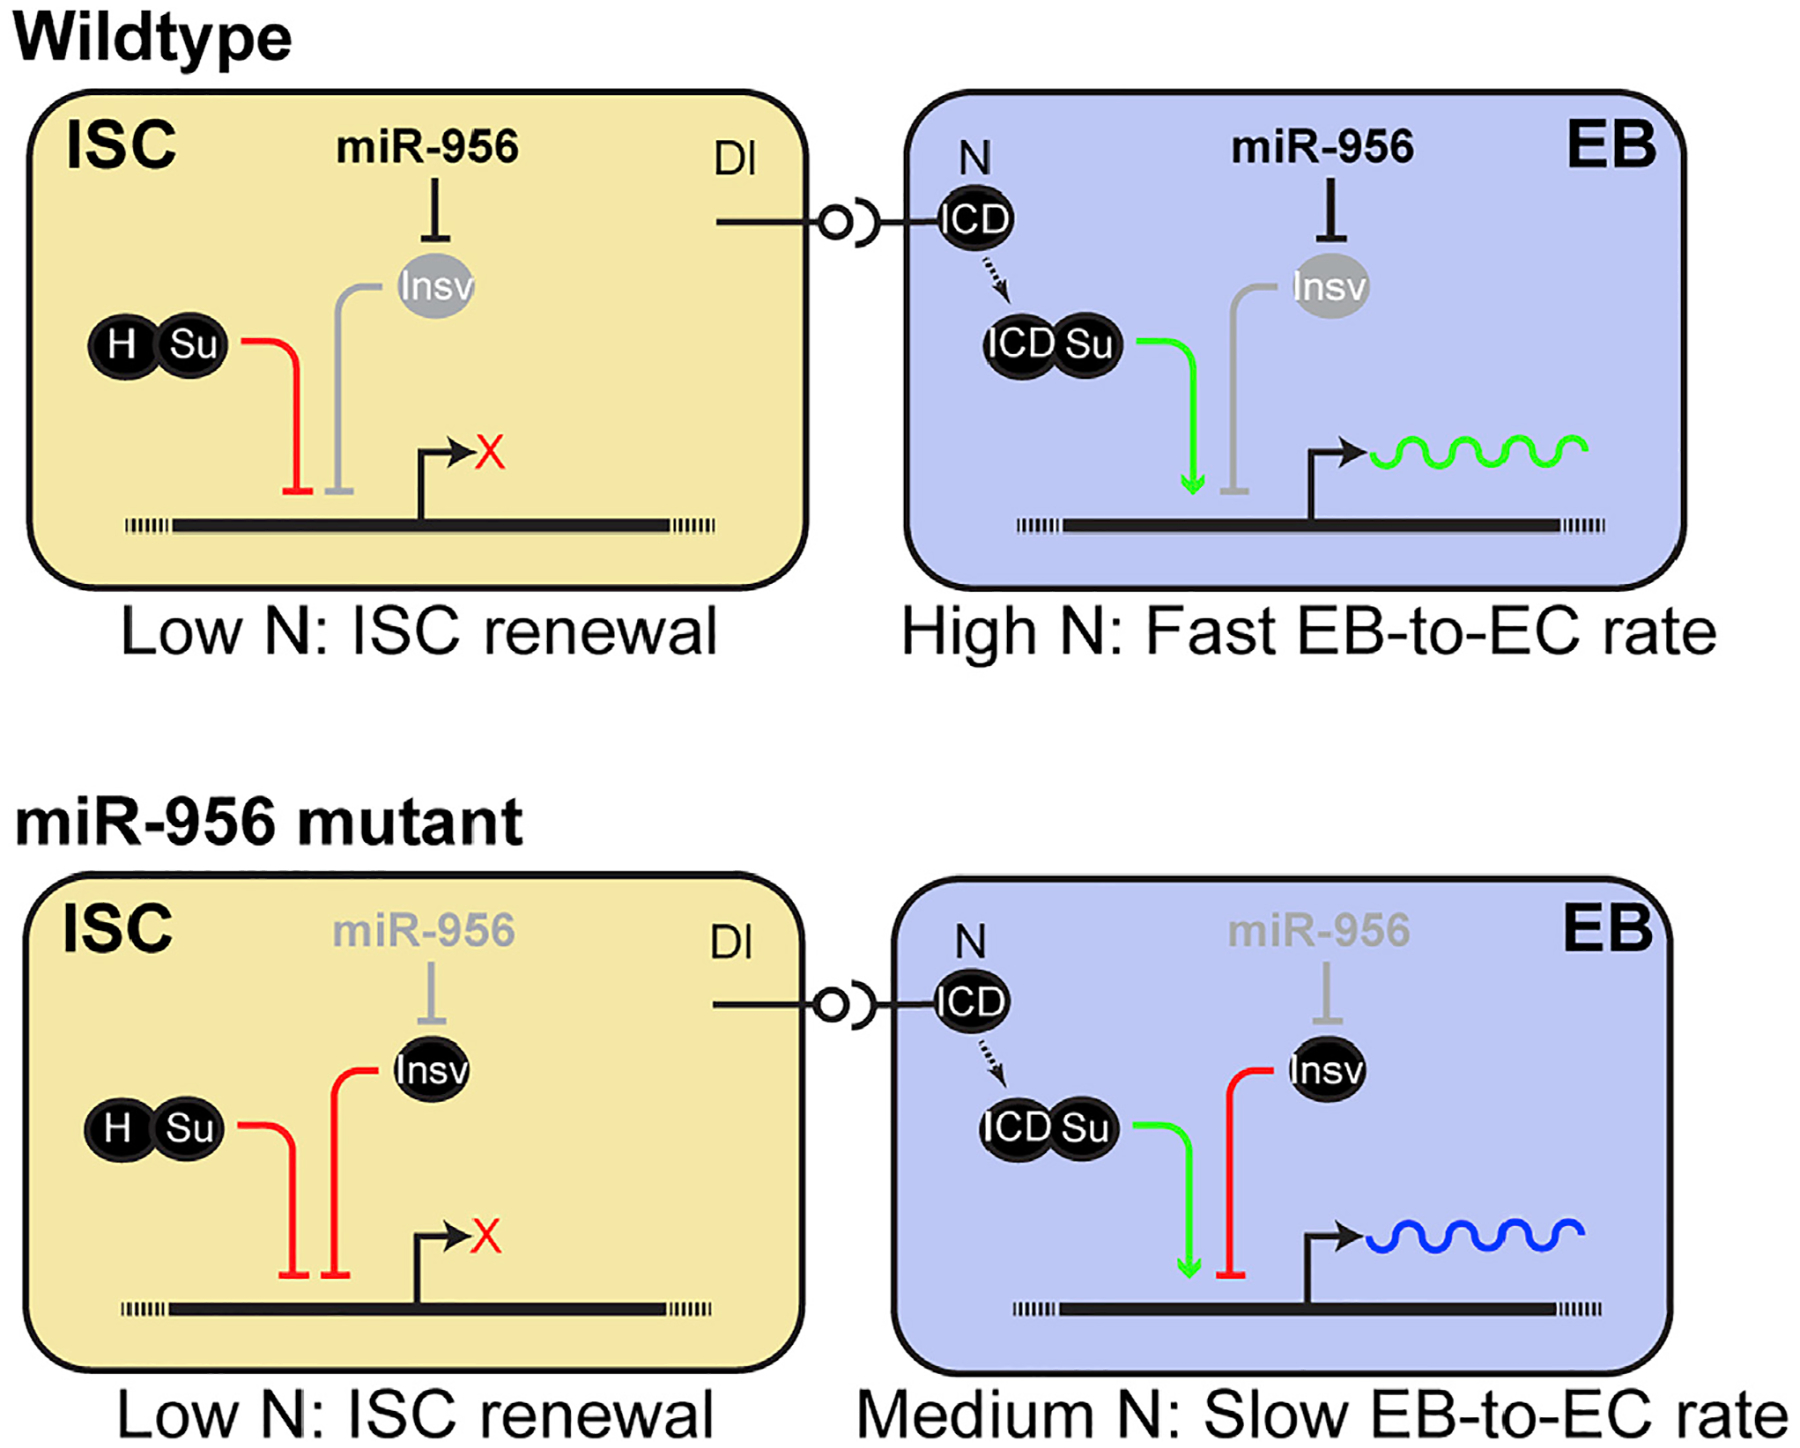
Somatic adult stem cell lineages in high-turnover tissues are under tight gene regulatory control. Like its mammalian counterpart, the Drosophila intestine precisely adjusts the rate of stem cell division with the onset of differentiation based on physiological demand. Although Notch signaling is indispensable for these decisions, the regulation of Notch activity that drives the differentiation of stem cell progenies into functional, mature cells is not well understood. Here, we report that commitment to the terminally differentiated enterocyte (EC) cell fate is under microRNA control. We show that an intestinally enriched microRNA, miR-956, fine-tunes Notch signaling activity specifically in intermediate, enteroblast (EB) progenitor cells to control EC differentiation. We further identify insensitive mRNA as a target of miR-956 that regulates EB/EC ratios by repressing Notch activity in EBs. In summary, our study highlights a post-transcriptional gene-regulatory mechanism for controlling differentiation in an adult intestinal stem cell lineage.

Keywords: CP: Molecular biology; CP: Stem cell research; Notch; homeostasis; insensitive; insensitivemidgut; miR-956; microRNA.


Conflict of interest statement

Declaration of interests No competing interest declared.

Figures

Figure 1.
Figure 1.. miR-956 is enriched in Drosophila intestinal tissue
(A) qPCR analysis of miR-956 and miR-210 levels in intestinal tissues and carcass relative to whole animals. For each experiment, samples were collected from three separate animals in triplicates. Statistical significance of the difference in miRNA levels in intestinal and carcass samples relative to whole tissue is indicated. (B and C) esgTS-labeled progenitor cells (green) in (B) esgTS; miR-956[KO] mutants, which were used as a control, and (C) wild-type esgTS animals, with counterstaining of all cell nuclei (DAPI in blue) and miR-956 using RNA in situ probes (red). (B′–C′) Grayscale images of miR-956 RNA in situ. Scale bar, 25 μm. Data shown as mean ± SEM. Significance values: ns, not significant; ****p < 0.0001.
Figure 2.
Figure 2.. miR-956 balances the proportion of progenitor cells to differentiated cells
(A–C) esgTS-labeled progenitor cells (green) in (A) esgTS, (B) esgTS; UAS-miR-956sp, and (C) esgTS; UAS-miR-956 midguts counterstained for all cell nuclei (DAPI in blue). (D) Quantification of progenitor cell numbers in esgTS, esgTS; miR-956sp and esgTS, UAS-miR-956 animals. (E) Quantification of GFP-negative differentiated cell numbers in esgTS, esgTS; miR-956sp and esgTS; UAS-miR-956 animals. (F–H) Midguts in (F) wild-type(w[1118]), (G) miR-956[KO], and (H) mutants rescued with miR-956 rescue transgene counterstained for progenitors (anti-mCherry in red), EBs marked using Su(H)-GBE-V5 (anti-V5 in green), and all cell nuclei (DAPI in blue). (F′–H′) Grayscale images of indicated channels from (F)–(H). (I–L) Quantification of (I) progenitor cells, (J) mCherry-negative differentiated cells, and (K) EB and (L) EC numbers in miR-956[KO] mutants compared with wild type and rescued controls. Data shown as mean ± SEM. Significance values: ***p < 0.001; ****p < 0.0001. Scale bar, 25 μm. n values in the graphs indicate the number of intestines.
Figure 3.
Figure 3.. miR-956 promotes EB-to-EC differentiation
(A) Schematic of the I-KCKT system. (B and C) Midguts showing EBs marked using Su(H)-GBE-V5 (anti-V5 in green) in (B) I-KCKT-Gal4 TS, and (C) I-KCKT-Gal4TS; UAS-miR-956sp animals counterstained for all cell nuclei (DAPI in blue). (D) Quantification of EB numbers in I-KCKT-Gal4 TS and I-KCKT-Gal4TS; UAS-miR-956.sp midguts. (E and F) Gbe-Gal4 TS labeled EBs (green) in (E) Gbe-Gal4 TS, and (F) Gbe-Gal4 TS; UAS-miR-956sp midguts counterstained for all cell nuclei (DAPI in blue). (G) Quantification of EB numbers in Gbe-Gal4 TS and Gbe-Gal4TS; UAS-miR-956sp midguts. (H) Schematic of the ReDDM system. (I and J) EC turnover analysis using (I) esgTS-ReDDM and (J) esgTS-ReDDM; UAS-miR-956sp midguts counterstained for all cell nuclei (DAPI in blue); GFP and RFP reporters in green and red, respectively. (K) Quantification of percentage of cell turnover (red ECs/unlabeled DAPI + ECs) in esgTS-ReDDM and esgTS-ReDDM; UAS-miR-956sp midguts. Data shown as mean ± SEM. Significance values: *p < 0.1; **p < 0.01; ****p < 0.0001. Scale bar, 25 mm. n values in the graphs indicate the number of intestines.
Figure 4.
Figure 4.. miR-956 regulates the Notch signaling pathway via insv
(A and B) Notch signaling reporter expression (anti-V5 in red) in (A) wild type and (B) miR-956[KO] mutants counterstained for progenitors in HRP (green) and all cell nuclei (DAPI in blue). (A′–B′) Grayscale images of Notch signaling reporter in wild type versus miR-956[KO] mutants. (C) Fluorescence intensity of Notch reporter expression in EBs in wild type versus miR-956[KO] mutants. (D and E) Midguts from (D) control or (E) miR-956[KO] mutants stained for smGFP.V5.insv 3UTR (red), progenitors in HRP (cyan), and all cell nuclei (DAPI in blue). (D′–E′) Grayscale images of indicated channels from (D) and (E). Progenitor cells are labeled with yellow arrowheads. (F) Fluorescence intensity of V5 reporter expression in progenitors of control and miR-956[KO] mutants stained for smGFP.V5.insv 3UTR (red). Data shown as mean ± SEM. Significance values: ****p < 0.0001. Scale bar, 25 mm. n values in the graphs indicate the number of cells quantified from at least five intestines.
Figure 5.
Figure 5.. miR-956 promotes EB-to-EC differentiation by regulating the Notch signaling activity
(A) Quantification of EB numbers in control or miR-956[KO] mutants that harbor two or one wild-type alleles of insv. (B) Quantification of EC numbers in control or miR-956[KO] mutants that harbor two or one wild-type alleles of insv. (C) Fluorescence intensity of Notch reporter expression in EBs in miR-956[KO] mutants that harbor two versus one wild-type alleles of insv. (D–F) esgTS-labeled progenitor cells (green) in (D) esgTS, (E) esgTS; UAS-miR-956sp, and (F) esgTS; UAS-miR-956sp, UAS-NICD midguts counterstained for all cell nuclei (DAPI in blue). (G–I) esgTS-labeled progenitor cells (green) in (G) esgTS, (H) esgTS; UAS-miR-956sp, and (I) esgTS; UAS-miR-956sp, insv RNAi midguts counterstained for all cell nuclei (DAPI in blue). (J and K) Quantification of (J) progenitor cell numbers and (K) GFP-negative differentiated cell numbers in esgTS, esgTS, UAS-miR-956sp and esgTS, UAS-miR-956sp, UAS-NICD animals. (L and M) Quantification of (L) progenitor cell numbers and (M) GFP-negative differentiated cell numbers in esgTS, esgTS, UAS-miR-956sp and esgTS, UAS-miR-956sp, insv RNAi animals. Data shown as mean ± SEM. Significance values: n.s., not significant; *p < 0.1; **p < 0.01; ***p < 0.001; ****p < 0.0001. Scale bar, 25 mm. n values in the graphs indicate the number of intestines.
Figure 6.
Figure 6.. Model
miR-956 represses insv to promote Notch signaling and modulates EB differentiation. See discussion for details.

References

    1. Agarwal V, Bell GW, Nam J-W, and Bartel DP (2015). Predicting effective microrna target sites in mammalian mrnas. Elife 4, e05005. - PMC - PubMed
    1. Antonello ZA, Reiff T, Ballesta-Illan E, and Dominguez M (2015). Robust intestinal homeostasis relies on cellular plasticity in enteroblasts mediated by mir-8-escargot switch. EMBO J. 34, 2025–2041. - PMC - PubMed
    1. Bailey AM, and Posakony JW (1995). Suppressor of hairless directly activates transcription of enhancer of split complex genes in response to notch receptor activity. Gene Dev. 9, 2609–2622. - PubMed
    1. Bardin AJ, Perdigoto CN, Southall TD, Brand AH, and Schweisguth F (2010). Transcriptional control of stem cell maintenance in the Drosophila intestine. Development 137, 705–714. - PMC - PubMed
    1. Biteau B, and Jasper H (2014). Slit/robo signaling regulates cell fate decisions in the intestinal stem cell lineage of Drosophila. Cell Rep. 7, 1867–1875. - PMC - PubMed

Publication types

LinkOut - more resources