. 2022 Oct 18;41(3):111474.
doi: 10.1016/j.celrep.2022.111474.

Activity-dependent translation dynamically alters the proteome of the perisynaptic astrocyte process

Affiliations

Activity-dependent translation dynamically alters the proteome of the perisynaptic astrocyte process

Darshan Sapkota et al. Cell Rep. .

Abstract

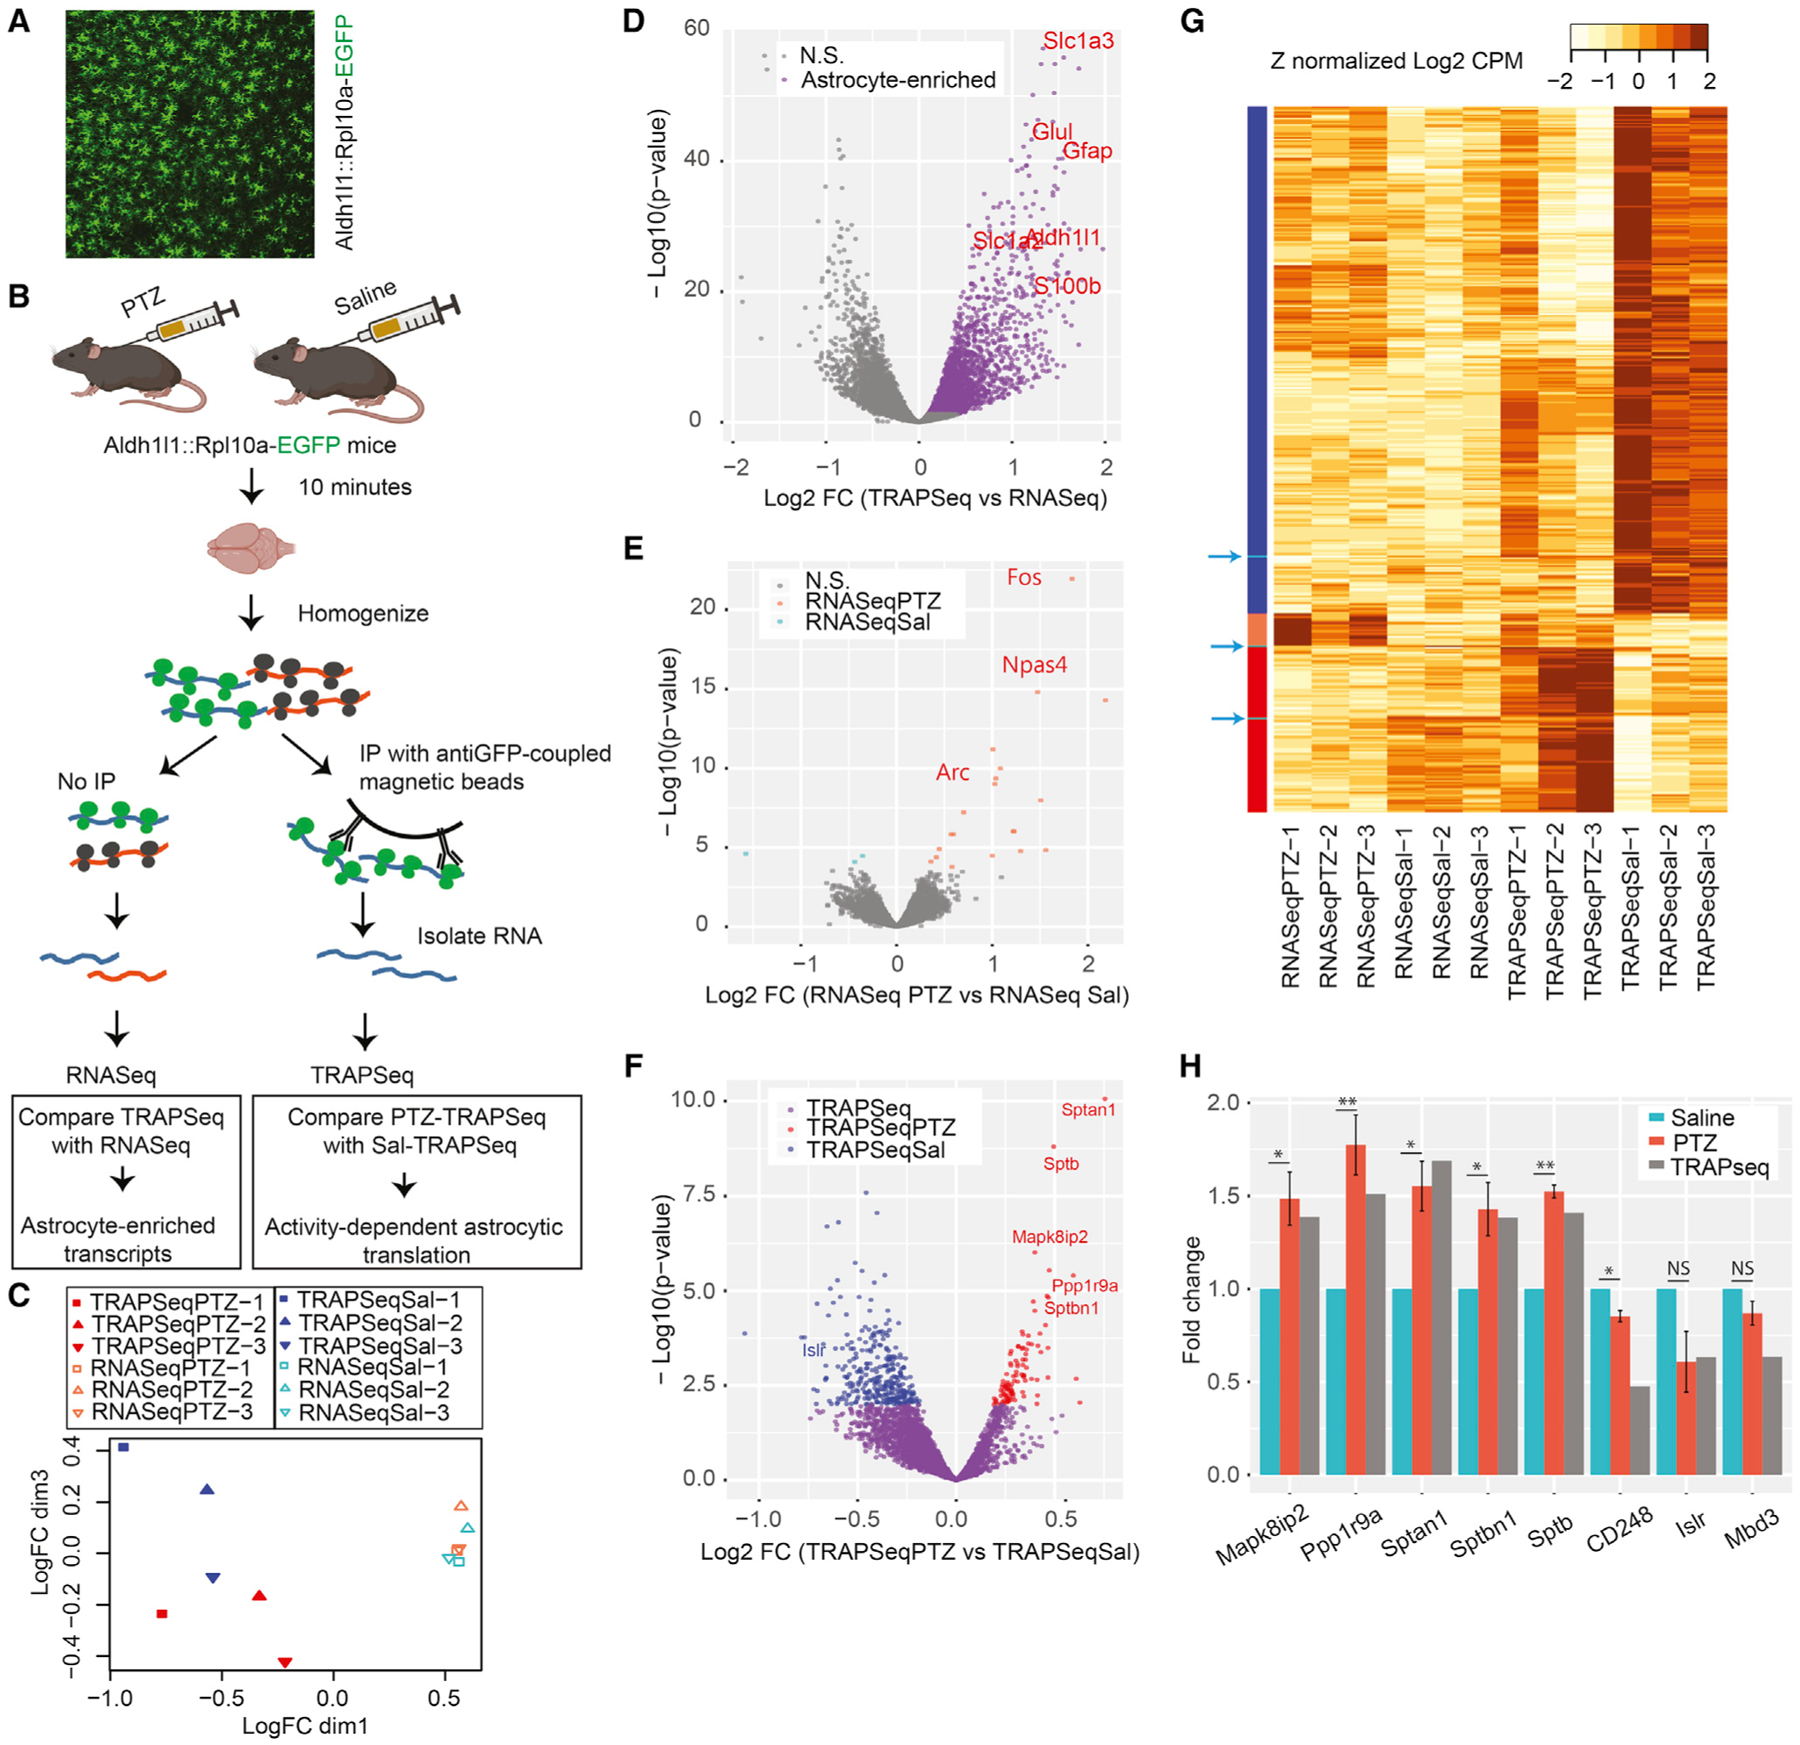
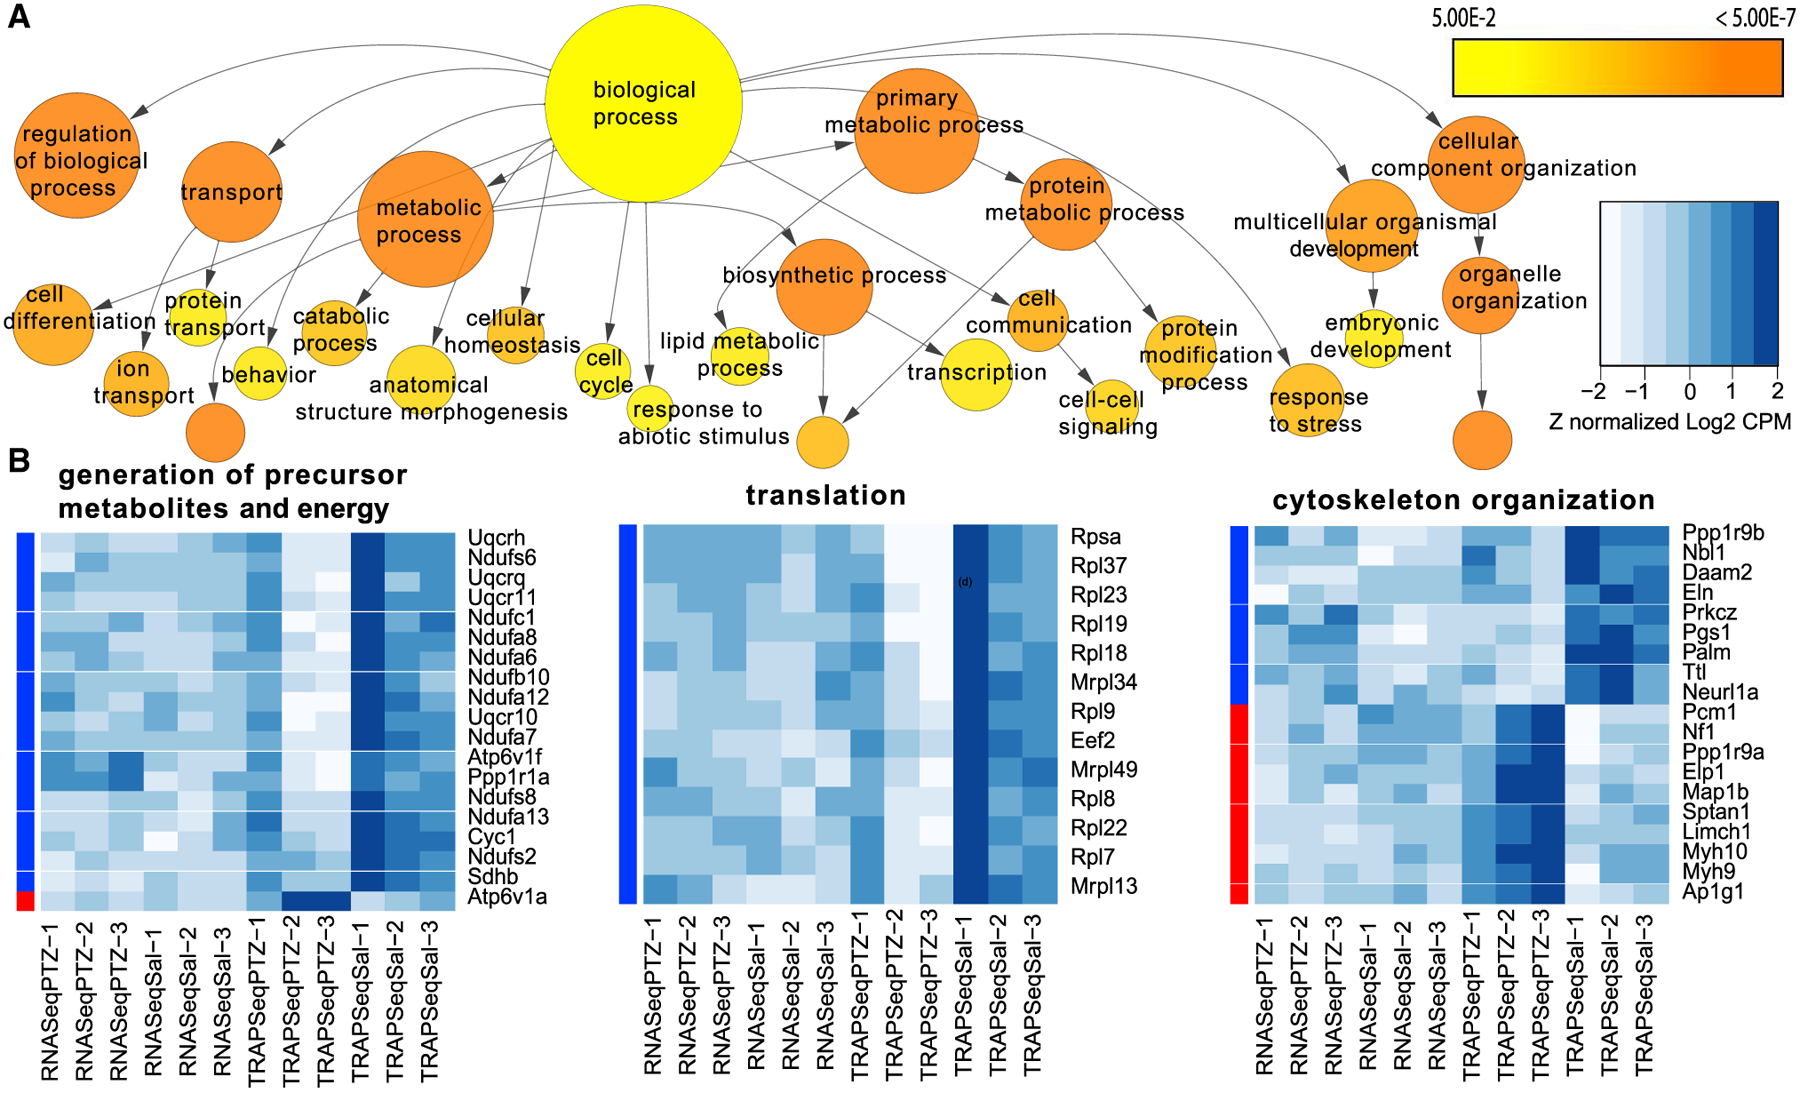
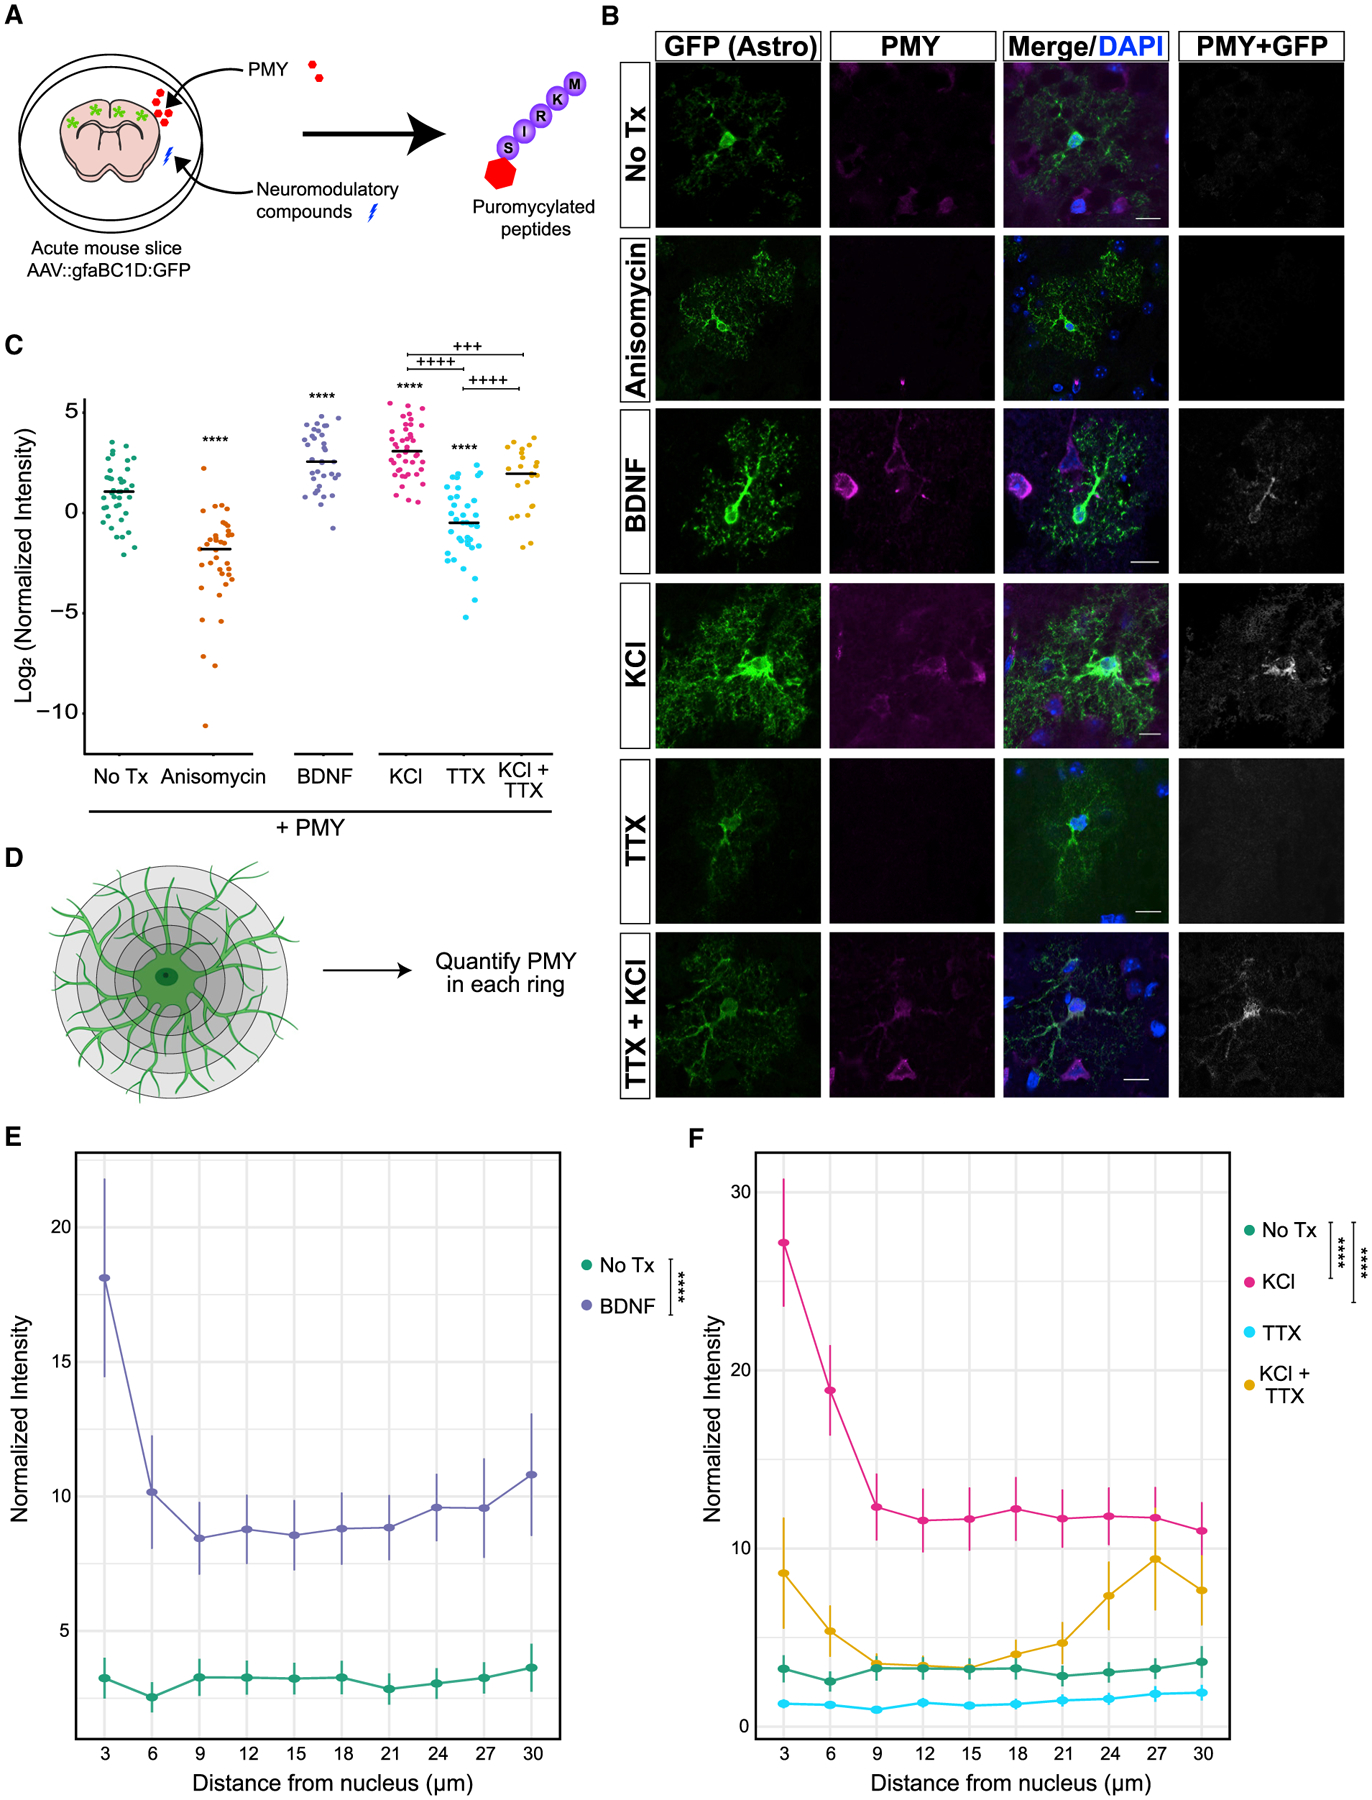
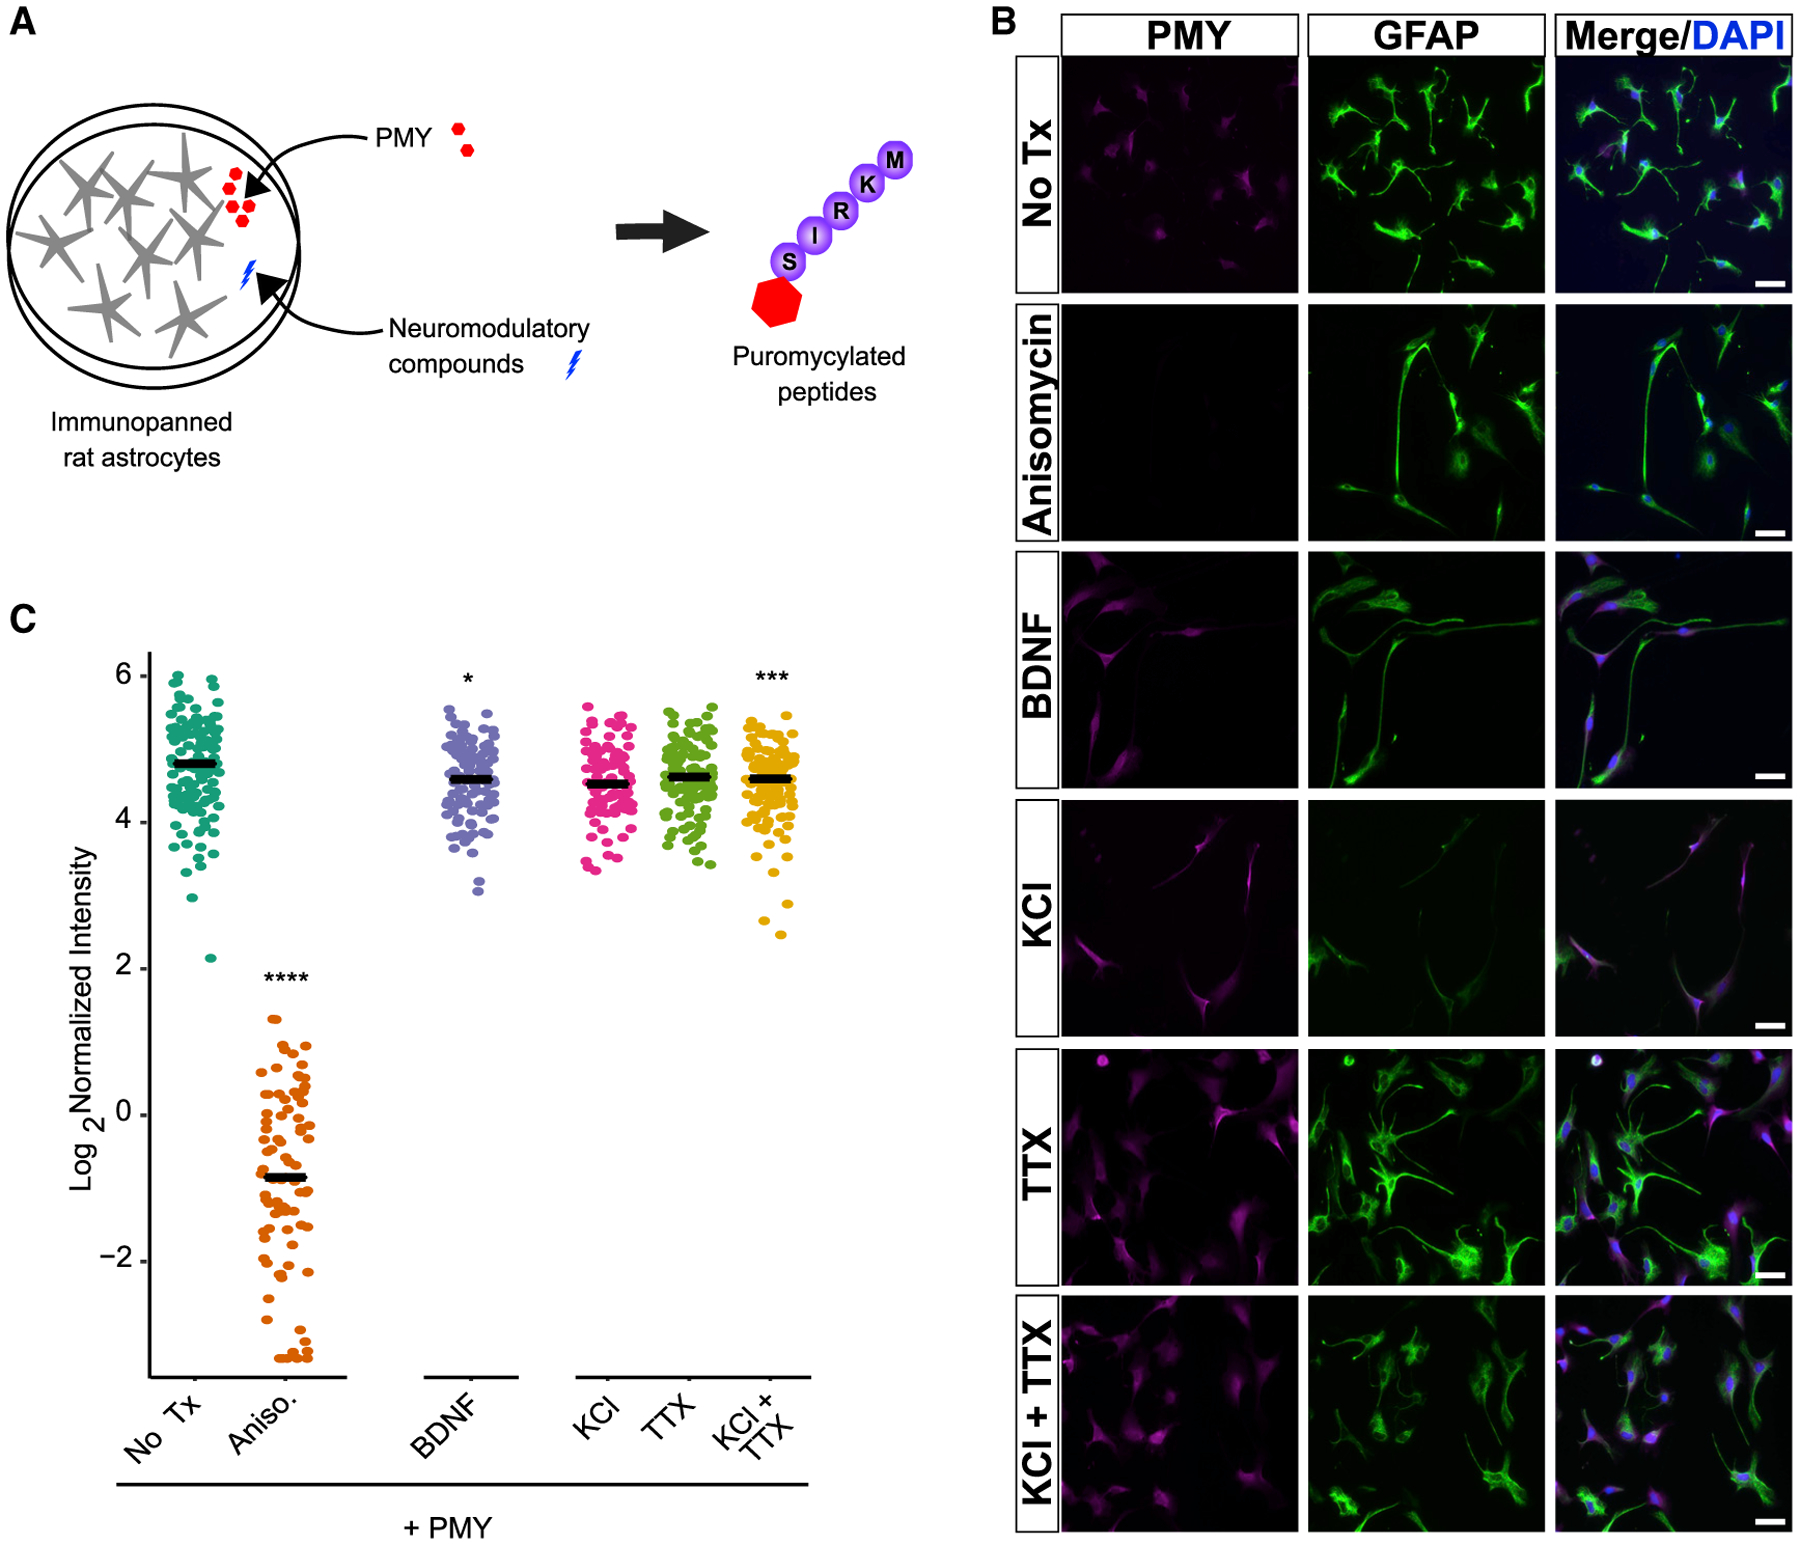
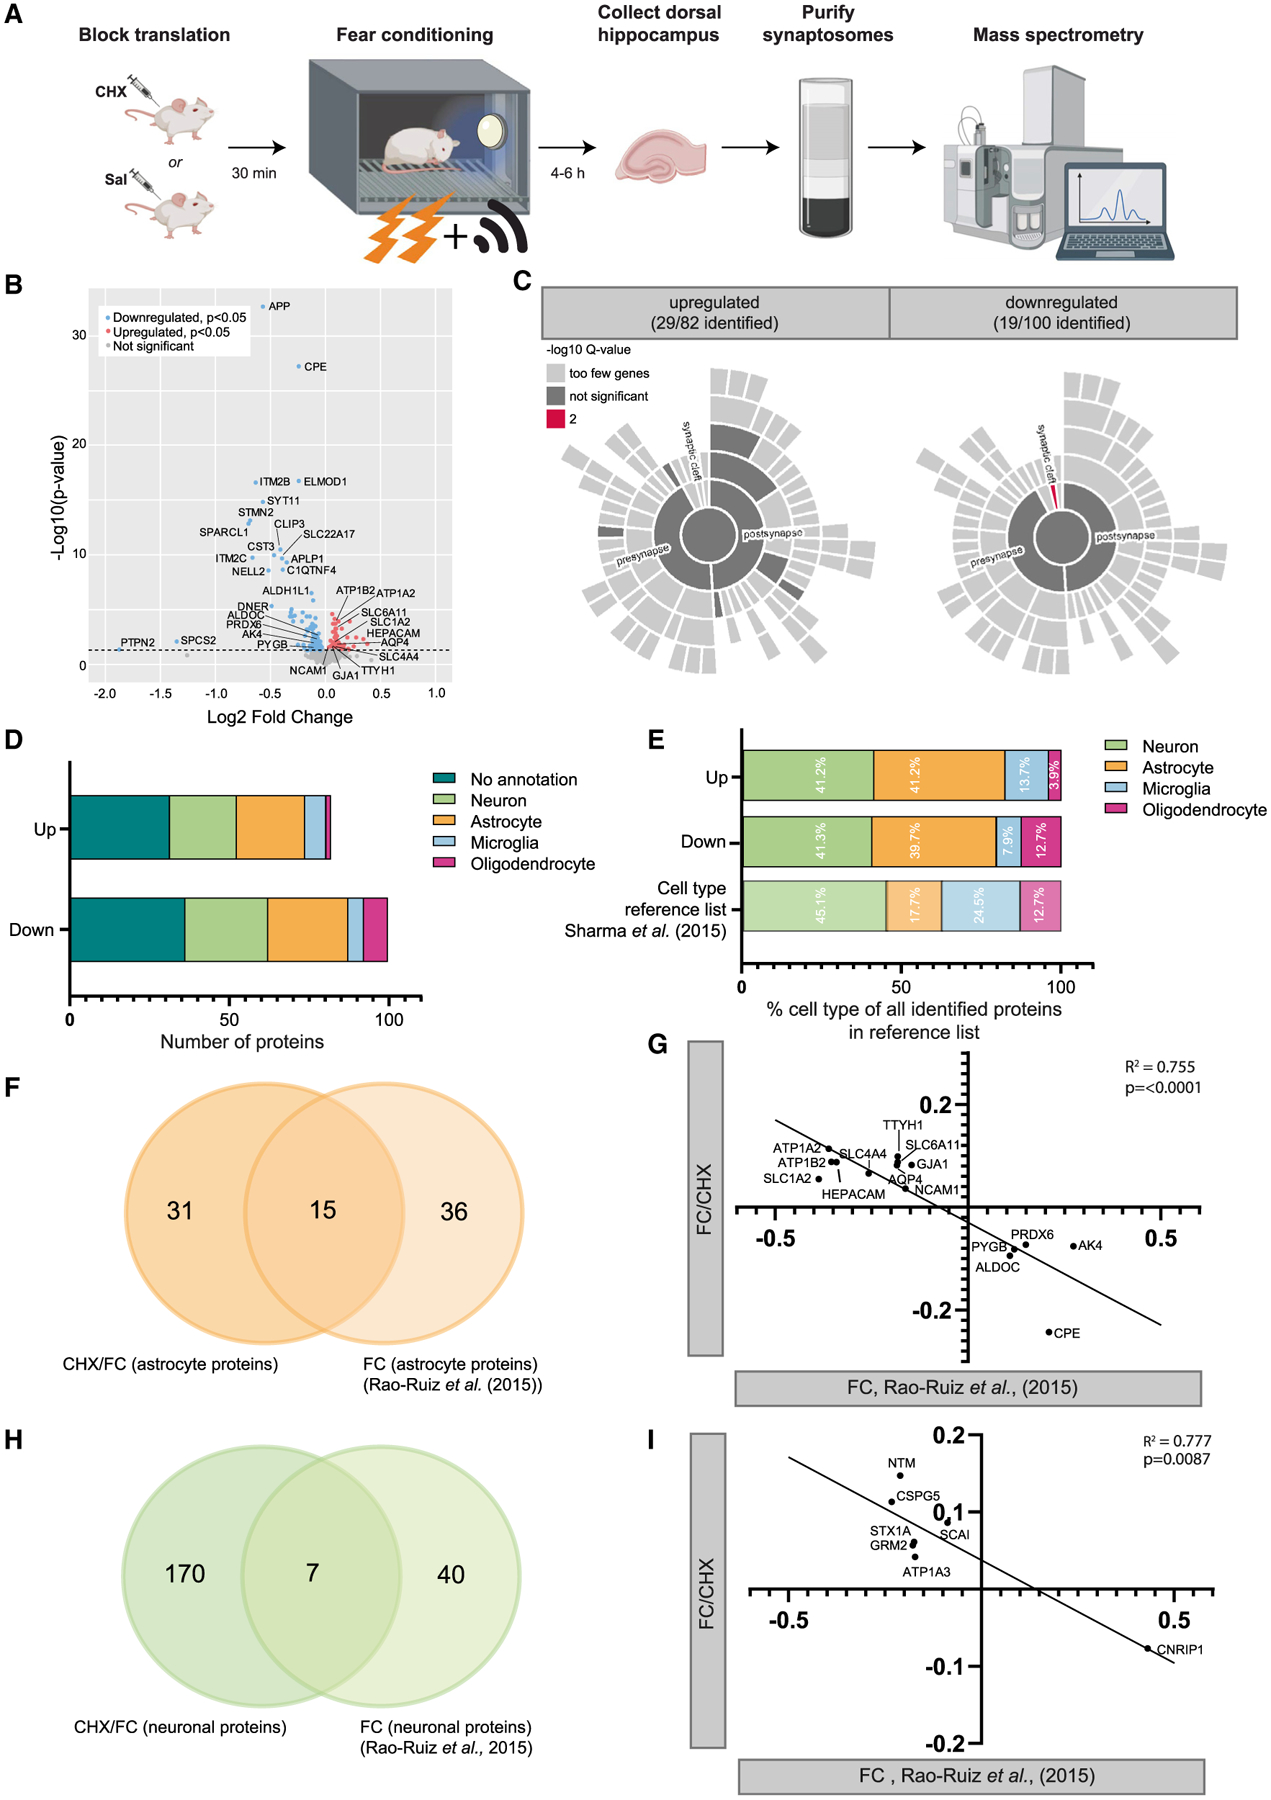
Within eukaryotic cells, translation is regulated independent of transcription, enabling nuanced, localized, and rapid responses to stimuli. Neurons respond transcriptionally and translationally to synaptic activity. Although transcriptional responses are documented in astrocytes, here we test whether astrocytes have programmed translational responses. We show that seizure activity rapidly changes the transcripts on astrocyte ribosomes, some predicted to be downstream of BDNF signaling. In acute slices, we quantify the extent to which cues of neuronal activity activate translation in astrocytes and show that this translational response requires the presence of neurons, indicating that the response is non-cell autonomous. We also show that this induction of new translation extends into the periphery of astrocytes. Finally, synaptic proteomics show that new translation is required for changes that occur in perisynaptic astrocyte protein composition after fear conditioning. Regulation of translation in astrocytes by neuronal activity suggests an additional mechanism by which astrocytes may dynamically modulate nervous system functioning.

Keywords: CP: Neuroscience; TRAP; astrocyte; regulation; seizure; translation.


Conflict of interest statement

Declaration of interests J.D.D. has previously received royalties related to the TRAP method. Y.Z. has consulted for Ono Pharmaceuticals.

Figures

Figure 1.
Figure 1.. Seizure rapidly alters the translational profile of astrocytes
(A) Representative image of an Astrocyte-TRAP mouse showing expression of the GFP-tagged ribosome construct in astrocytes across the cortex. (B) Schematic of immunoprecipitating astrocyte-specific mRNA with and without seizure induction. (C) Multidimensional scaling of 12 samples shows that astrocyte TRAP-seq samples are clearly separated from RNA-seq samples and that stimulated and unstimulated TRAP-seq samples are also distinguished in this unsupervised clustering approach. n = 3 mice per treatment. (D) Volcano plot comparing all TRAP samples with all RNA-seq samples defines transcripts enriched on astrocyte ribosomes (purple), including known astrocyte markers (red genes), as expected. (E) Volcano plot comparing RNA-seq from stimulated and unstimulated mice identifies the subset of transcripts responding rapidly to seizure induction (orange and blue transcripts, FDR < 0.1). Some immediate-early genes are marked. (F) Volcano plot comparing TRAP-seq from stimulated and unstimulated mice identifies the subset of TRAP enriched transcripts (purple) that were upregulated (red) or downregulated (blue) by seizure (FDR < 0.1). Genes of interest are labeled in the respective colors. (G) Heatmap of Z-normalized data for all transcriptionally upregulated (orange bar, left) or downregulated (cyan bars/arrows) transcripts and astrocyte translationally downregulated (blue bars) or upregulated (red bars) transcripts across all conditions. (H) PTZ- and saline-treated mice were subjected to qPCR, and fold changes were calculated as 2−DeltaDeltaCt. A mixed linear model followed by likelihood ratio test was used to test DeltaCt as a function of PTZ treatment. Corresponding TRAP-seq results are included for comparison. n = 3 mice per treatment. *p ≤ 0.05; **p ≤ 0.01.
Figure 2.
Figure 2.. BiNGO analysis reveals biological processes significantly regulated in astrocytes after PTZ treatment
(A) Exploratory GO pathway analysis of all regulated genes identifies trends for transcripts in key metabolic processes (e.g., mitochondrial, cytoskeletal, and ribosomal transcripts) with changes in ribosome occupancy. The color scale indicates significance for hypergeometric test. Category size is scaled to the number of genes. Arrows represent parent-child relationships in GO terms. (B) Heatmaps of the expression of the genes that make up three example categories show that most genes in the mitochondrial and ribosomal categories are downregulated with seizure. For cytoskeletal elements, there is a change between the genes in the category.
Figure 3.
Figure 3.. Astrocyte translation is modulated by BDNF and K+
(A) Schematic showing the ex vivo translation assay. Acute brain slices were treated with test compounds. The resulting translational changes were quantified using puromycin (PMY), which tags nascent peptides and serves as an epitope for the subsequent immunofluorescence. (B) Representative confocal images of post-natal day 21 (P21) cortical astrocytes after puromycylation. Astrocytes were labeled with AAV9:GFP (STAR methods) and incubated for 10 min with PMY and the indicated pharmacological manipulations. Immunostaining for GFP (green) and PMY (magenta) was performed. The PMY + GFP channel indicates colocalized pixels of PMY and GFP and was enhanced for publication. Scale bars, 10 μm. (C) Quantification of PMY intensity in GFP astrocytes. Normalized intensity was calculated by dividing PMY intensity by GFP area (pixels). ANOVA was performed to determine effect of condition; F(5,211) = 53.389, p < 2.2E−16. Post hoc pairwise t tests were performed. Asterisks indicate comparison with no Treatment (Tx) (PMY only), and plus signs indicate comparisons within KCl and TTX conditions. +++p < 0.005, ****/++++p < 0.001. Nmice = 2–3 per condition, Ncells (condition) = 40 (no Tx), 37 (anisomycin), 36 (BDNF), 44 (KCl), 37 (TTX), and 23 (KCl + TTX). (D) Schematic of astrocyte PMY quantification as a function of distance. Concentric rings were drawn from the center of the nucleus starting at a radial distance of 3 μm and increasing to 30 μm maximum at an interval of 3 μm. The total PMY intensity was quantified within each ring and then normalized to the astrocyte area (GFP area) to account for differences in astrocyte volume in each ring. (E and F) Quantification of PMY intensity at increasing distance from the cell soma from the data in (I). Normalized intensity was calculated by dividing PMY intensity by GFP area (pixels). A linear mixed model was performed to account for random variation from each cell and each distance measured. Post hoc Tukey’s test is represented with asterisks. ****p < 0.0001. The cells used in this quantification are the same as in (C).
Figure 4.
Figure 4.. The effect of BDNF and KCl on astrocyte translation requires neurons
(A) Schematic of the assay for astrocyte translation. Purified astrocytes are treated with test compounds, and the resulting translational response is measured using PMY, which tags nascent peptides and is visualized for the subsequent immunofluorescence. (B) Representative fields of immunopanned astrocytes, stained for PMY and GFAP. Scale bar, 50 μm. (C) Quantification of PMY intensity in astrocytes. Mean intensity (signal/area) was calculated for individual cells. Pairwise t tests were performed compared with no Tx. ****p < 0.001, ***p < 0.005, *p < 0.05. Ncells (condition) = 129 (no Tx; i.e., PMY only), 87 (anisomycin), 97 (KCl), 120 (TTX), 104 (BDNF), 111 (KCl + TTX).
Figure 5.
Figure 5.. The astrocytic perisynaptic proteome is altered when translation is inhibited by CHX Tx
(A) Experimental design of blocked translation by cycloheximide (CHX) before fear conditioning, followed by proteomics analysis on hippocampal synaptosomes. (B) Volcano plot depicting proteomics data with expression changes in Fear Conditioned CHX-treated mice (n = 9) (FC/CHX) compared with Fear Conditioned non-treated controls (n = 10) (FC/CTL) (x axis, log2) and statistical significance (y axis). Downregulated significant (p < 0.05) proteins are shown by individual red dots and upregulated proteins by blue dots. Non-significant observed proteins are shown in gray. Significance threshold is represented by the dashed line. (C) Sunburst plots showing the annotation in synaptic compartments using SynGO. Color coding is based on FDR-corrected p values (q values). (D) Cell enrichment analysis based on cell-type-specific proteomics data by Sharma et al. (2015). Data are provided for all upregulated and downregulated proteins separated. Each bar represents a different cell type. (E) Fractions of annotated cell types for proteins regulated by CHX Tx compared with fractions of cell types identified in the reference list for cell type enrichment analysis by Sharma et al. (2015). Percentages are based on all identified regulated proteins with a cell type annotation, divided by “upregulated” and “downregulated.” (F) A Venn diagram showing similarities between astrocyte proteins regulated by FC/CHX and proteins regulated by FC only (Rao-Ruiz et al., 2015). (G) Correlation plot showing high inverse correlation for changes in astrocyte protein levels caused by CHX (FC/CHX – FC/CTL, x axis) versus FC (Rao-Ruiz et al., 2015; y axis). (H) Venn diagram showing similarities between neuronal proteins regulated by FC/CHX and proteins regulated by FC only (Rao-Ruiz et al., 2015). (I) Correlation plot showing high inverse correlation for changes in neuronal protein levels caused by CHX (FC/CHX – FC/CTL, x axis) versus FC only (Rao-Ruiz et al., 2015; y axis).

References

    1. Abrahams BS, Arking DE, Campbell DB, Mefford HC, Morrow EM, Weiss LA, Menashe I, Wadkins T, Banerjee-Basu S, and Packer A (2013). SFARI Gene 2.0: a community-driven knowledgebase for the autism spectrum disorders (ASDs). Mol. Autism 4, 36. 10.1186/2040-2392-4-36. - DOI - PMC - PubMed
    1. Agranoff BW, Davis RE, and Brink JJ (1966). Chemical studies on memory fixation in goldfish. Brain Res. 1, 303–309. 10.1016/0006-8993(66)90095-3. - DOI - PubMed
    1. Aroeira RI, Sebastião AM, and Valente CA (2015). BDNF, via truncated TrkB receptor, modulates GlyT1 and GlyT2 in astrocytes. Glia 63, 2181–2197. 10.1002/glia.22884. - DOI - PubMed
    1. Balkowiec A, and Katz DM (2000). Activity-dependent release of endogenous brain-derived neurotrophic factor from primary sensory neurons detected by ELISA in situ. J. Neurosci 20, 7417–7423. - PMC - PubMed
    1. Batiuk MY, Martirosyan A, Wahis J, de Vin F, Marneffe C, Kusserow C, Koeppen J, Viana JF, Oliveira JF, Voet T, et al. (2020). Identification of region-specific astrocyte subtypes at single cell resolution. Nat. Commun 11, 1220. 10.1038/s41467-019-14198-8. - DOI - PMC - PubMed

Publication types