. 2022 Oct 27;185(22):4099-4116.e13.
doi: 10.1016/j.cell.2022.09.034. Epub 2022 Oct 18.

Differential mosquito attraction to humans is associated with skin-derived carboxylic acid levels

Affiliations

Differential mosquito attraction to humans is associated with skin-derived carboxylic acid levels

Maria Elena De Obaldia et al. Cell. .

Abstract

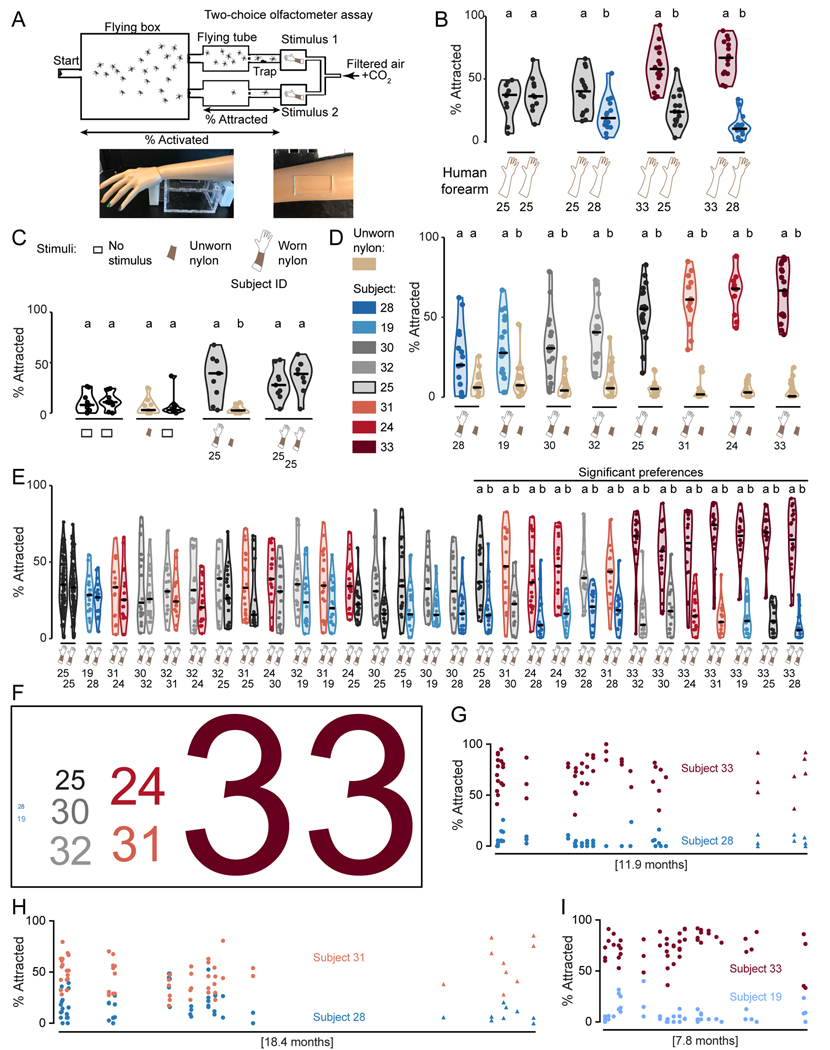
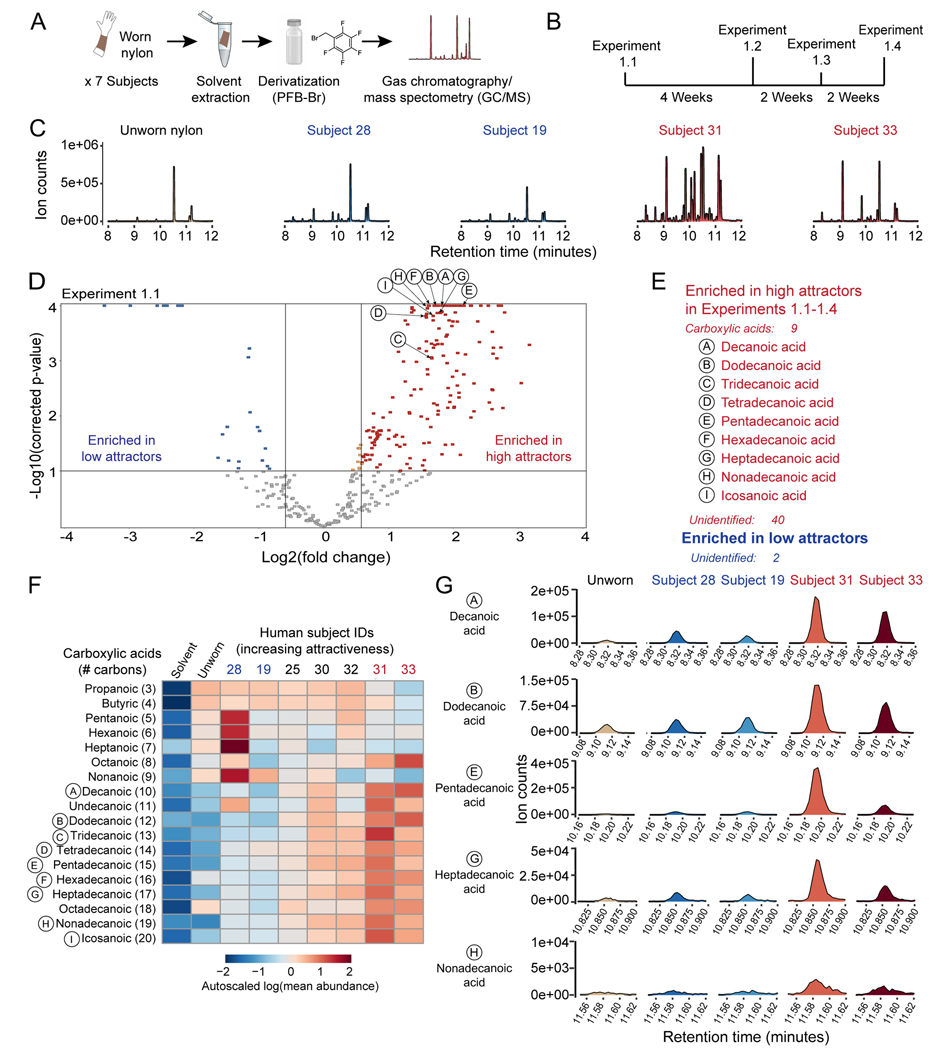
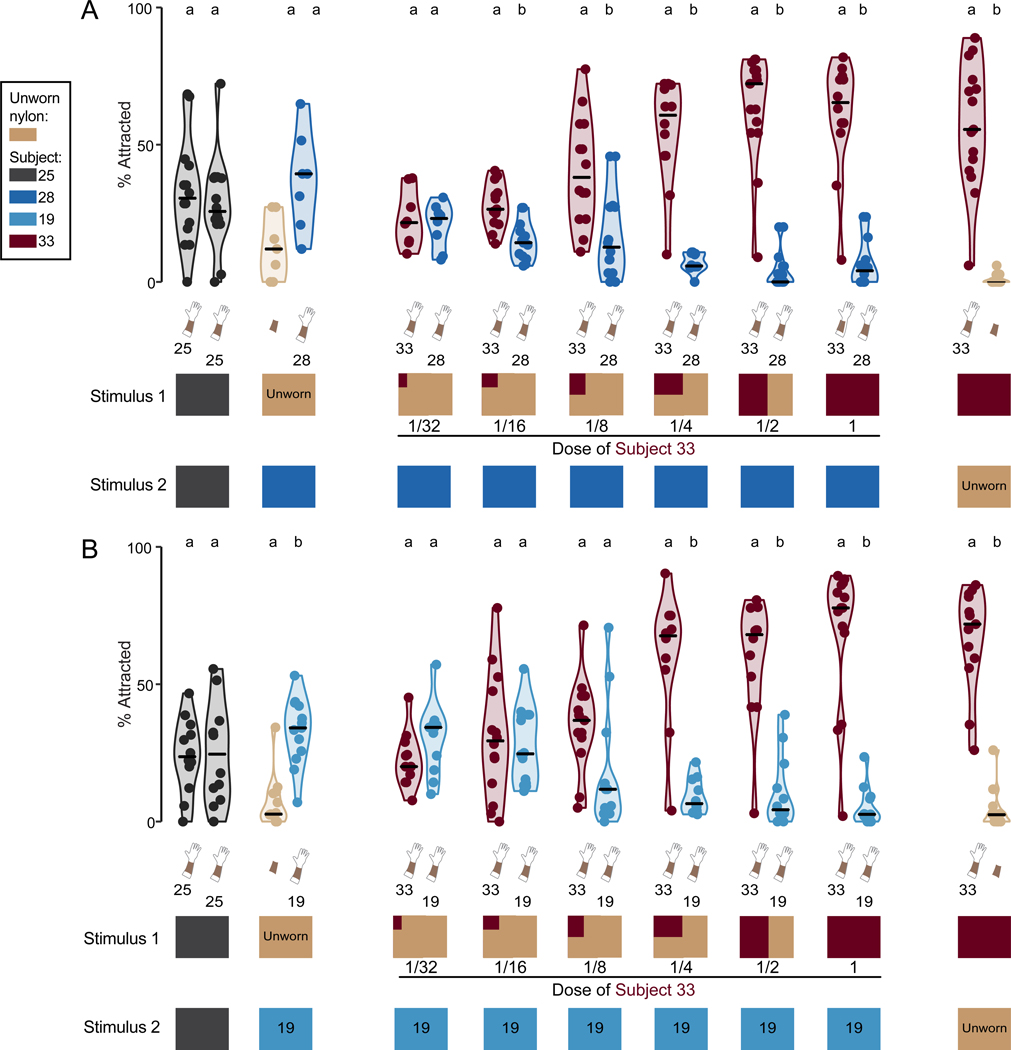
Some people are more attractive to mosquitoes than others, but the mechanistic basis of this phenomenon is poorly understood. We tested mosquito attraction to human skin odor and identified people who are exceptionally attractive or unattractive to mosquitoes. These differences were stable over several years. Chemical analysis revealed that highly attractive people produce significantly more carboxylic acids in their skin emanations. Mutant mosquitoes lacking the chemosensory co-receptors Ir8a, Ir25a, or Ir76b were severely impaired in attraction to human scent, but retained the ability to differentiate highly and weakly attractive people. The link between elevated carboxylic acids in "mosquito-magnet" human skin odor and phenotypes of genetic mutations in carboxylic acid receptors suggests that such compounds contribute to differential mosquito attraction. Understanding why some humans are more attractive than others provides insights into what skin odorants are most important to the mosquito and could inform the development of more effective repellents.

Keywords: Aedes aegypti; behavior; chemosensory receptors; metabolomics; mosquito; olfaction; sebum; skin.


Conflict of interest statement

Declaration of interests The authors declare no competing interests.

Figures

Figure 1:
Figure 1:. Mosquitoes show strong preferences among individual humans
(A) Schematic of two-choice olfactometer assay (top). Photographs (bottom) of a mannequin arm modeling the position of a live human forearm on top of the stimulus box in the two-choice olfactometer (left) and the opening in the stimulus box lid used to expose an area of human skin (5.08 cm x 2.54 cm) in the assay (right). (B-E) Wild-type mosquitoes attracted to live human forearms (B) or a 5.08 cm x 2.54 cm piece of human-worn nylons and controls (C-E) of the indicated subjects in the two-choice olfactometer assay. Subject pairs in E are ordered by nonparametric effect size. (F) Attractiveness scores for human subjects derived from data in E, with subject ID font size scaled to the attractiveness score: Subject 33 (score=144), Subject 24 (score=34), Subject 31 (score=32), Subject 32 (score=26), Subject 30 (score=23), Subject 25 (score=18), Subject 19 (score=1), Subject 28 (score=0). (G-I) Longitudinal two-choice olfactometer data for two wild-type Aedes aegypti mosquito strains, Orlando (circles) and Liverpool (triangles), showing attraction to the indicated subject pairs. The total time elapsed between the first and last experiment shown is indicated, and corresponded to July 12, 2018 to July 3, 2019 (G), February 1, 2018 to August 6, 2019 (H), and July 30, 2018 to March 21, 2019 (I). In B-E, data are displayed as violin plots with median indicated by horizontal black lines and the bounds of the violin corresponding to the range (30–40 mosquitoes/trial). B: n=10–16 trials, C: n=7–8 trials, D: n=12–21 trials, E: n=14–20 trials (except n=81 trials for the Subject 25 vs 25 comparison). Data corresponding to adjacent violin plots labeled with different letters are significantly different (p<0.05, Wilcoxon rank-sum tests with Bonferroni correction).
Figure 2:
Figure 2:. Mosquitoes lacking Orco or Ir8a retain individual human preferences
(A) Schematic of two-choice olfactometer assay indicating the location of mosquitoes that were not activated, activated but not attracted, or attracted in response to a control trial in which Subject 25 nylons were placed in both stimulus boxes. (B,C) Stacked bar plots indicate the mean total percent of mosquitoes that were in each category in all trials for Orco (30–40 mosquitoes/trial, n=30–34 trials, *p<0.01, Wilcoxon rank-sum tests with Bonferroni correction comparing each category across the two genotypes) (B) or Ir8a (30–40 mosquitoes/trial, n=31–33 trials, *p<0.0001, Wilcoxon rank-sum tests with Bonferroni correction comparing each category across the two genotypes) (C). (D) Schematic of two-choice olfactometer assay, indicating the location (purple shading) of all mosquitoes attracted to either stimulus in a control trial in which Subject 25 nylons were placed in both stimulus boxes. (E,F) Pie charts of trials in which 9 or fewer animals entered either trap were excluded for Orco (E) or Ir8a (F). (G,H) Percent of mosquitoes of the indicated genotype attracted to the indicated stimuli in the two-choice olfactometer assay. Data from trials that met the inclusion criteria are displayed as violin plots with median indicated by horizontal black lines and the bounds of the violin corresponding to the range (30–40 mosquitoes/trial, n=11–18 trials, except n=29–31 for the Subject 25 vs 25 comparison). Data corresponding to adjacent violin plots labeled with different letters are significantly different (p<0.05, Wilcoxon rank-sum tests with Bonferroni correction). (I, J) Percent of mosquitoes of the indicated genotype attracted to the indicated stimuli in the two-choice olfactometer assay. Data from trials that met the inclusion criteria are displayed as violin plots with median indicated by horizontal black lines and the bounds of the violin corresponding to the range (30–40 mosquitoes/trial, n=11–22 trials, except n=24–29 for the Subject 25 vs 25 comparison). Data corresponding to adjacent violin plots labeled with different letters are significantly different (p<0.05, Wilcoxon rank-sum tests with Bonferroni correction).
Figure 3:
Figure 3:. Generation and characterization of Ir25a and Ir76b mutants
(A-B) Schematic of the Aedes aegypti Ir76b (A) and Ir25a (B) genomic loci, detailing sgRNA sites and modified protein products of the indicated mutant alleles superimposed on Ir76b and Ir25a protein snake plots, which were generated using Protter v1.0 (Omasits et al., 2014). (C) Schematic of single stimulus olfactometer assay. (D-G) Percent of mosquitoes of the indicated genotypes activated to leave the start canister (D-E) or attracted to the indicated stimuli (F-G) in the single stimulus olfactometer assay. Data are displayed as violin plots with median indicated by horizontal black lines and the bounds of the violin corresponding to the range (10–20 mosquitoes/trial, n=6–16 trials). Kruskal-Wallis test was used to compare each mutant allele to wild-type controls (ns, not significant; *p<0.05). See also Supplemental Figure S1.
Figure 4:
Figure 4:. Mosquitoes lacking Ir76b or Ir25a show reduced attraction to humans but retain individual human preferences
(A) Schematic of two-choice olfactometer assay indicating the location of mosquitoes that were not activated, activated but not attracted, or attracted in response to a control trial in which Subject 25 nylons were placed in both stimulus boxes. Stacked bar plots indicate the mean total percent of mosquitoes that were in each category (30–40 mosquitoes/trial, n=13–16 trials, *p<0.05, Wilcoxon rank-sum tests with Bonferroni correction comparing each category across the two genotypes). (B) Top: schematic of two-choice olfactometer assay, indicating the location (purple shading) of all mosquitoes attracted to either stimulus in a control trial in which Subject 25 nylons were placed in both stimulus boxes. Bottom: trials in which 9 or fewer animals entered either trap were excluded. (C-E) Left: Schematic of Ir76b and Ir25a and ligand-specific subunit (IRx). Right: percent of mosquitoes of the indicated genotype attracted to the indicated stimuli in the two-choice olfactometer assay. Data from trials that met the inclusion criteria are displayed as violin plots with median indicated by horizontal black lines and the bounds of the violin corresponding to the range (30–40 mosquitoes/trial, n=8–13 trials, except n=4–13 for the Subject 25 vs 25 comparison). Data corresponding to adjacent violin plots labeled with different letters are significantly different (p<0.05, Wilcoxon rank-sum tests with Bonferroni correction).
Figure 5:
Figure 5:. Carboxylic acids are enriched on the skin of humans who are highly attractive to mosquitoes
(A) Overview of experimental procedure for gas chromatography/quantitative time of flight mass spectrometry (GC/QTOF-MS) experiments. (B) Timeline of 4 replicate GC/QTOF-MS experiments in initial human subject cohort. (C) Representative chromatograms from the indicated sample groups, including merged extracted ion chromatograms from a set of ~200 features enriched on worn nylons versus unworn nylons and solvent controls in Experiments 1.1–1.4 (Supplemental Table S1). (D) Volcano plot of features enriched on worn nylons versus unworn nylons and solvent controls in Experiment 1.1. Nine identified compounds that were differentially abundant between high and low attractor groups in Experiments 1.1–1.4 are indicated. (E) Table of differential features in Experiments 1.1–1.4. (F) Heatmap quantifying abundance of carboxylic acids with 3–20 carbons in the indicated human subjects, averaged across 4 experiments. (G) Representative extracted ion chromatograms of several carboxylic acids in the two most and least attractive subjects from the initial cohort. See also Supplemental Figure S2 and Supplemental Figure S4.
Figure 6:
Figure 6:. Carboxylic acids are enriched in a validation cohort of highly mosquito attractive humans.
(A) Schematic of single stimulus olfactometer assay. (B) Mosquitoes attracted to nylons from 18 subjects at the extremes of low and high attraction in the single stimulus olfactometer assay, comprising 14 subjects from the GC/QTOF-MS validation study and 4 subjects from the initial cohort. Single stimulus olfactometer assay data from 45 additional subjects, comprising 42 subjects from the GC/QTOF-MS validation study and three subjects from the initial cohort are available on Zenodo (DOI: 10.5281/zenodo.5822538). Data are displayed as violin plots with median indicated by horizontal black lines and the bounds of the violin corresponding to the range (14–24 mosquitoes/trial, n=13–28 trials) (C) Timeline of 4 replicate GC/QTOF-MS experiments (Experiments 2.1–2.4), performed approximately one year after Experiments 1.1–1.4. (D) Volcano plot of features enriched on worn nylons versus unworn nylons and solvent controls in Experiment 2.3. Identified compounds that were differentially abundant between high and low attractors in all Experiments 2.1–2.4 are indicated with an arrow, and labeled with an uppercase letter, corresponding to the table in E. (E) Table describing features that were consistently differentially abundant in high versus low attractors in Experiments 2.1–2.4. (F) Heatmap quantifying abundance of carboxylic acids with 10–20 carbons, averaged across 4 experiments, in the 18 subjects in B. (G) Representative extracted ion chromatograms of three carboxylic acids in the 3 most and 3 least attractive subjects of the 18 subject validation cohort in B. (H) Quantified abundance (median peak areas) of three carboxylic acids in high attractors (n=11) versus low attractors (n=7) across Experiments 2.1–2.4. Data are displayed as violin plots with median indicated by horizontal black lines and the bounds of the violin corresponding to the range. Each plotted point represents the overall median abundance of the compound in one subject across Experiments 2.1–2.4. Data corresponding to adjacent violin plots labeled with different letters are significantly different (Wilcoxon rank-sum test followed by FDR correction p≤0.1). See also Supplemental Figure S3 and Supplemental Figure S4.
Figure 7:
Figure 7:. Dilution of highly attractive human odor eliminates mosquito preferences
(A,B) Percent of mosquitoes attracted to the indicated stimuli in the two-choice olfactometer assay. Mosquitoes were presented with a constant size of nylon worn by a low attractor, either Subject 28 (A) or Subject 19 (B), and decreasing amounts of nylon worn by high attractor Subject 33, corresponding to the indicated fraction of the low attractor nylon size. The total amount of nylon was balanced by adding unworn nylon. Data are displayed as violin plots with median indicated by horizontal black lines and the bounds of the violin corresponding to the range (30–40 mosquitoes/trial, n=11–20 trials). Data corresponding to adjacent violin plots labeled with different letters are significantly different (p<0.05, Wilcoxon rank-sum tests with Bonferroni correction).

Comment in

References

    1. Abuin L, Bargeton B, Ulbrich MH, Isacoff EY, Kellenberger S, and Benton R. (2011). Functional architecture of olfactory ionotropic glutamate receptors. Neuron 69, 44–60. - PMC - PubMed
    1. Acosta EM., Little KA., Bratton BP., Mao X., Payne A., Devenport D., and Gitai Z. (2021). Bacterial DNA on the skin surface overrepresents the viable skin microbiome. bioRxiv, DOI 10.1101/2021.1108.1116.455933. - DOI - PMC - PubMed
    1. Acree F Jr., Turner RB, Gouck HK, Beroza M, and Smith N. (1968). L-Lactic acid: a mosquito attractant isolated from humans. Science 161, 1346–1347. - PubMed
    1. Ai M, Min S, Grosjean Y, Leblanc C, Bell R, Benton R, and Suh GS (2010). Acid sensing by the Drosophila olfactory system. Nature 468, 691–695. - PMC - PubMed
    1. Anjomruz M, Oshaghi MA, Sedaghat MM, Pourfatollah AA, Raeisi A, Vatandoost H, Mohtarami F, Yeryan M, Bakhshi H, and Nikpoor F. (2014). ABO blood groups of residents and the ABO host choice of malaria vectors in southern Iran. Exp Parasitol 136, 63–67. - PubMed

Publication types

LinkOut - more resources