. 2022 Oct 19;42(42):7900-7920.
doi: 10.1523/JNEUROSCI.0707-22.2022. Epub 2022 Sep 7.

Activity-Induced Cortical Glutamatergic Neuron Nascent Proteins

Affiliations

Activity-Induced Cortical Glutamatergic Neuron Nascent Proteins

Lucio M Schiapparelli et al. J Neurosci. .

Erratum in

Abstract

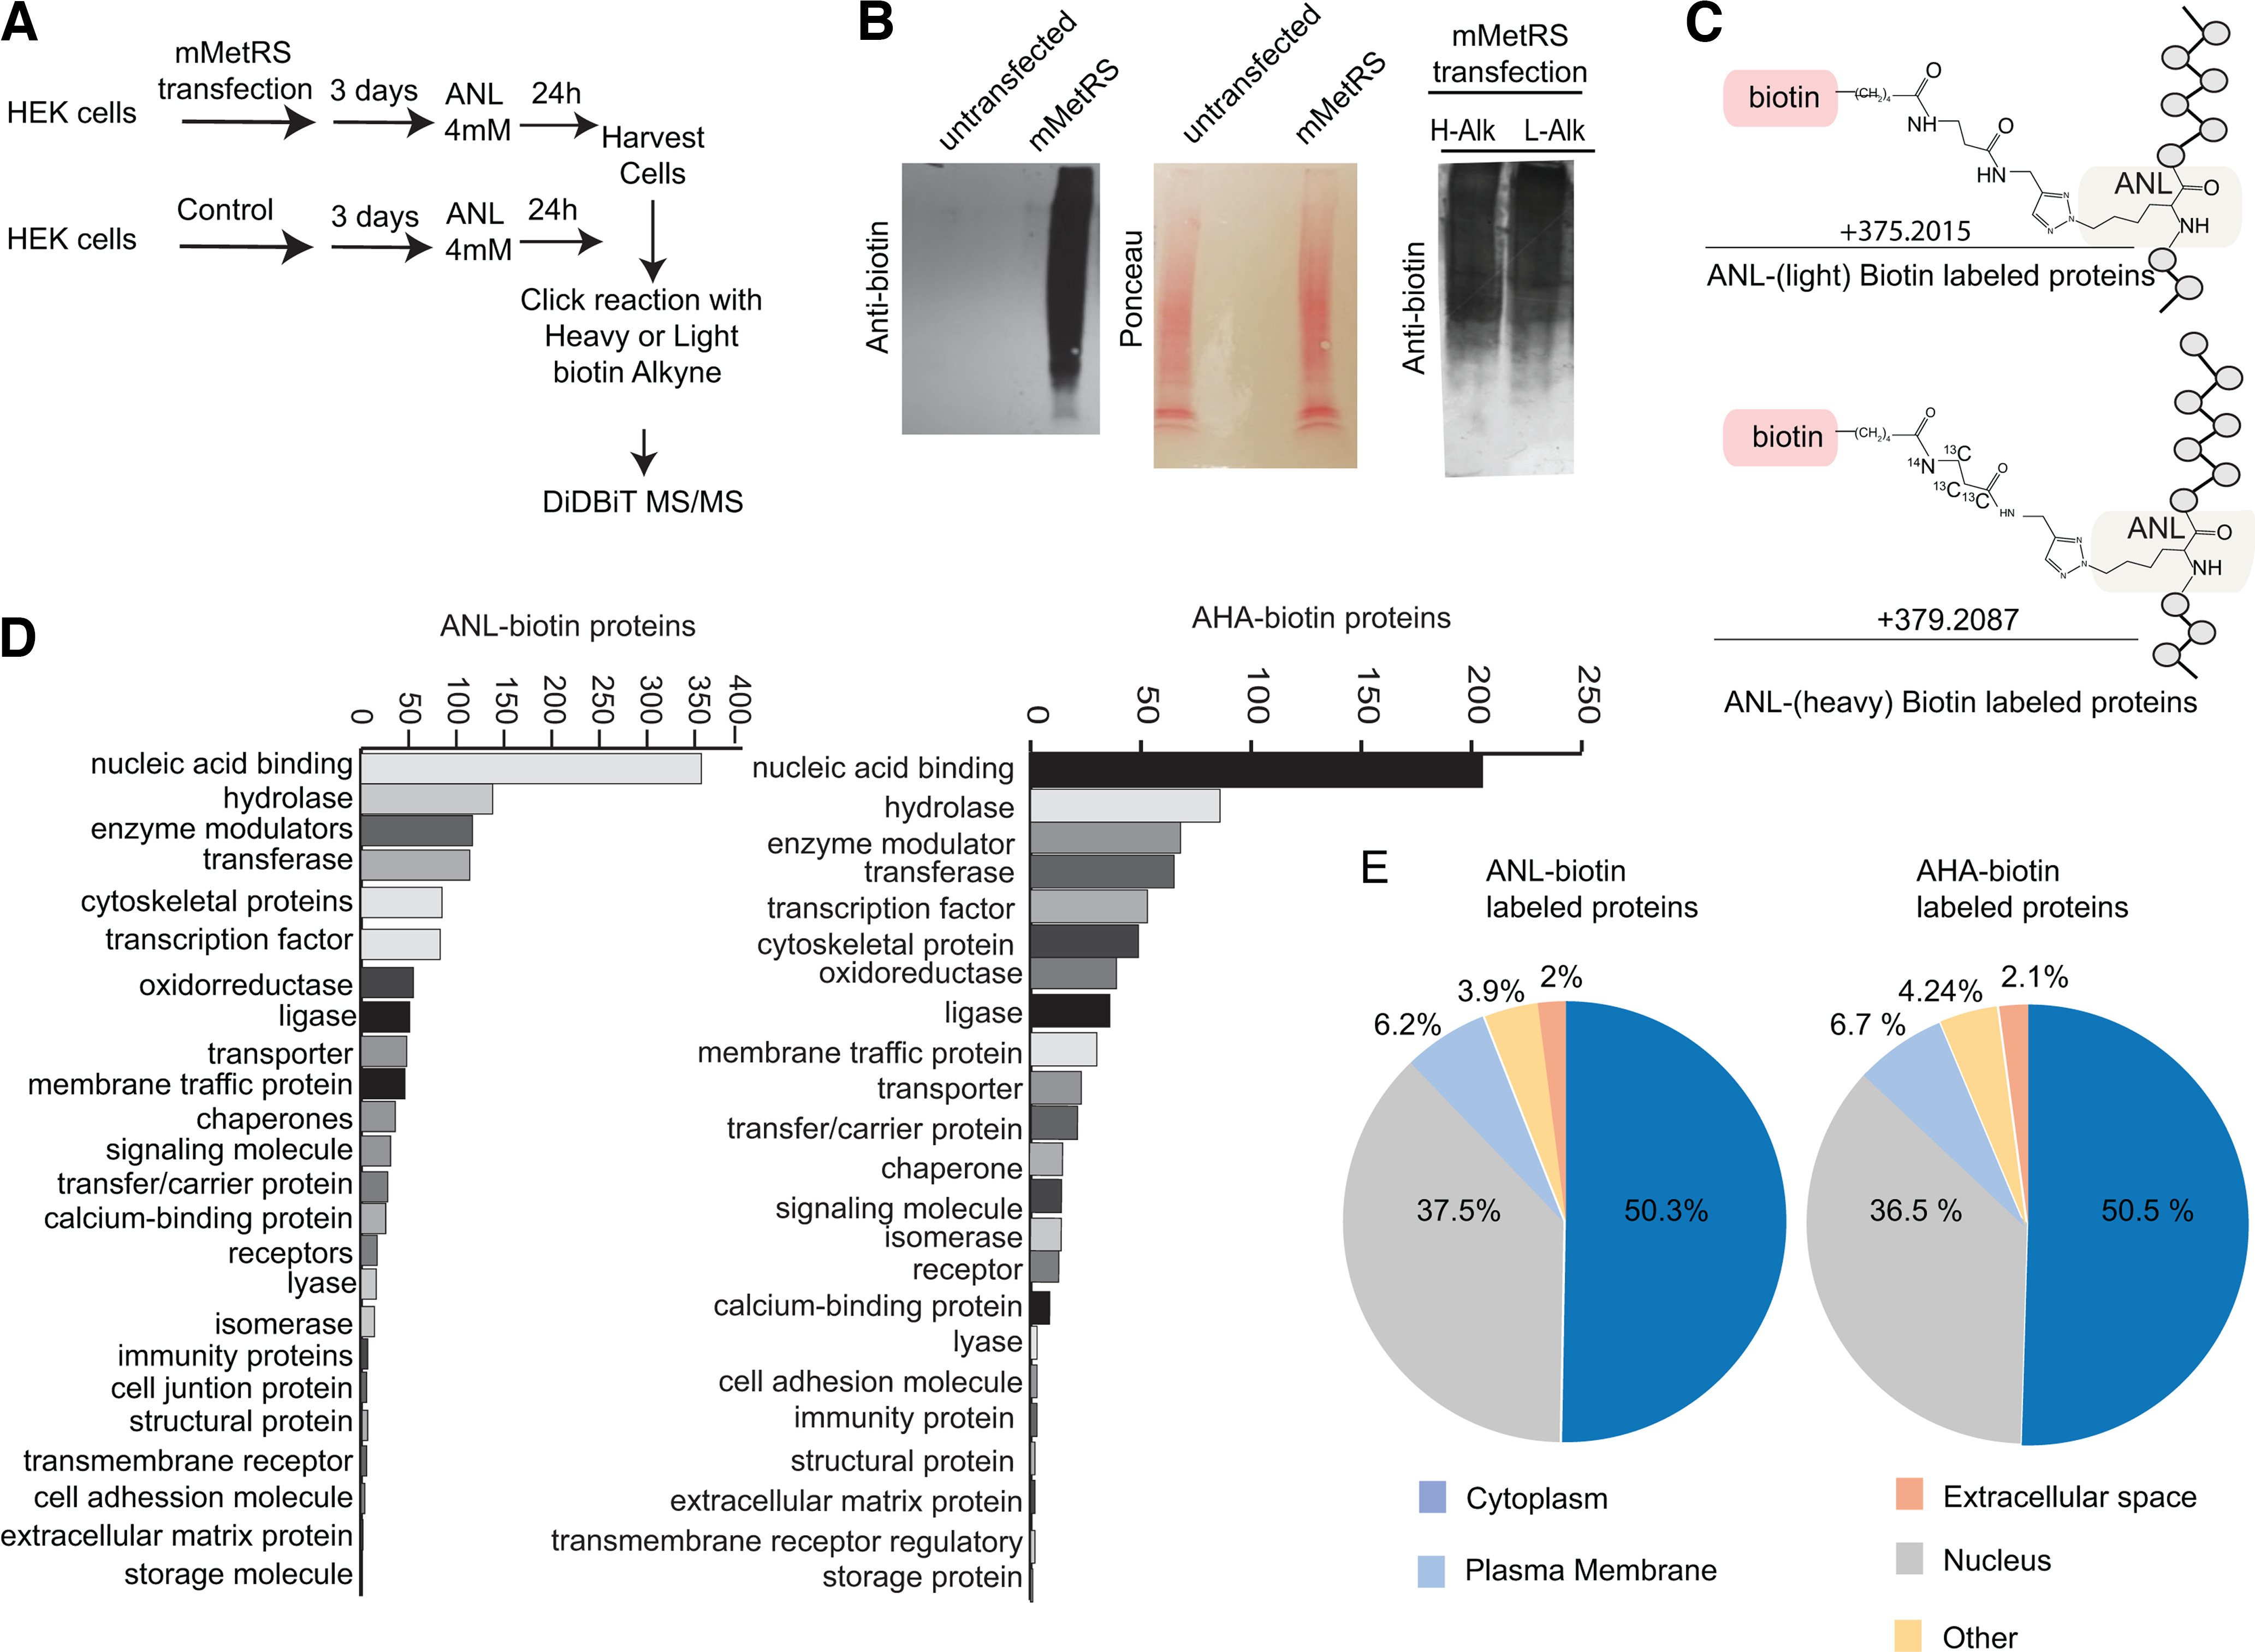
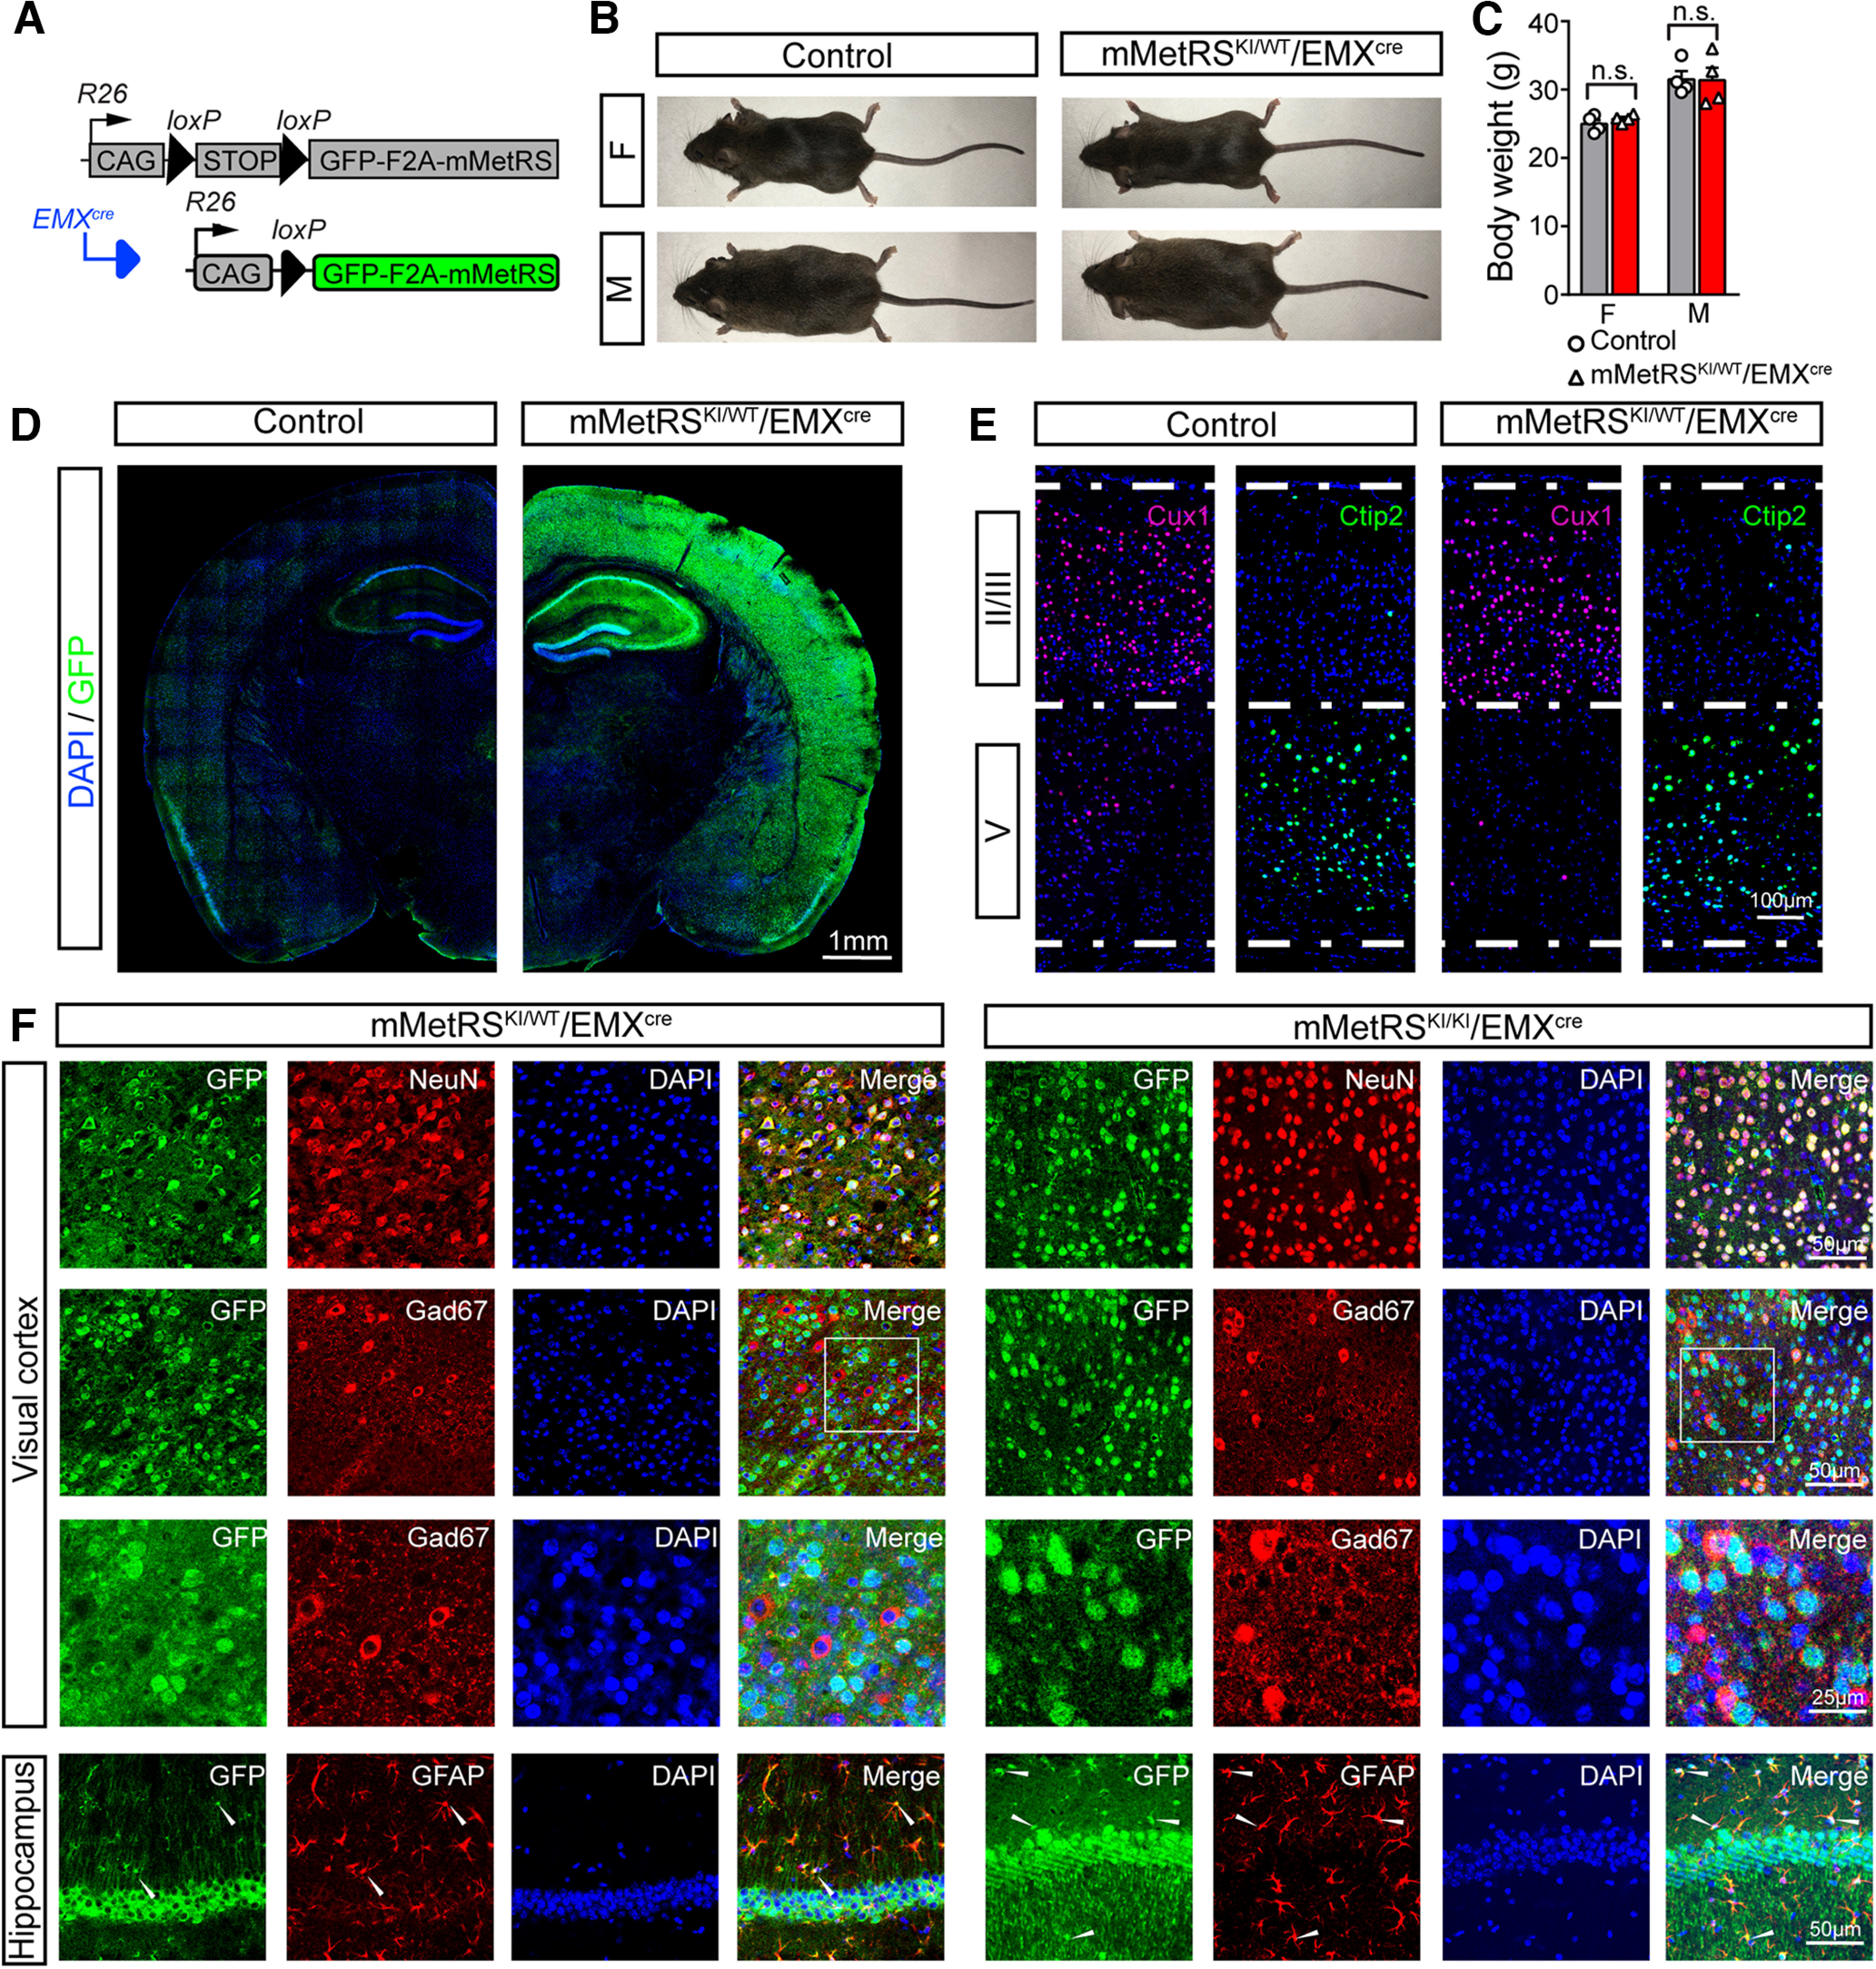
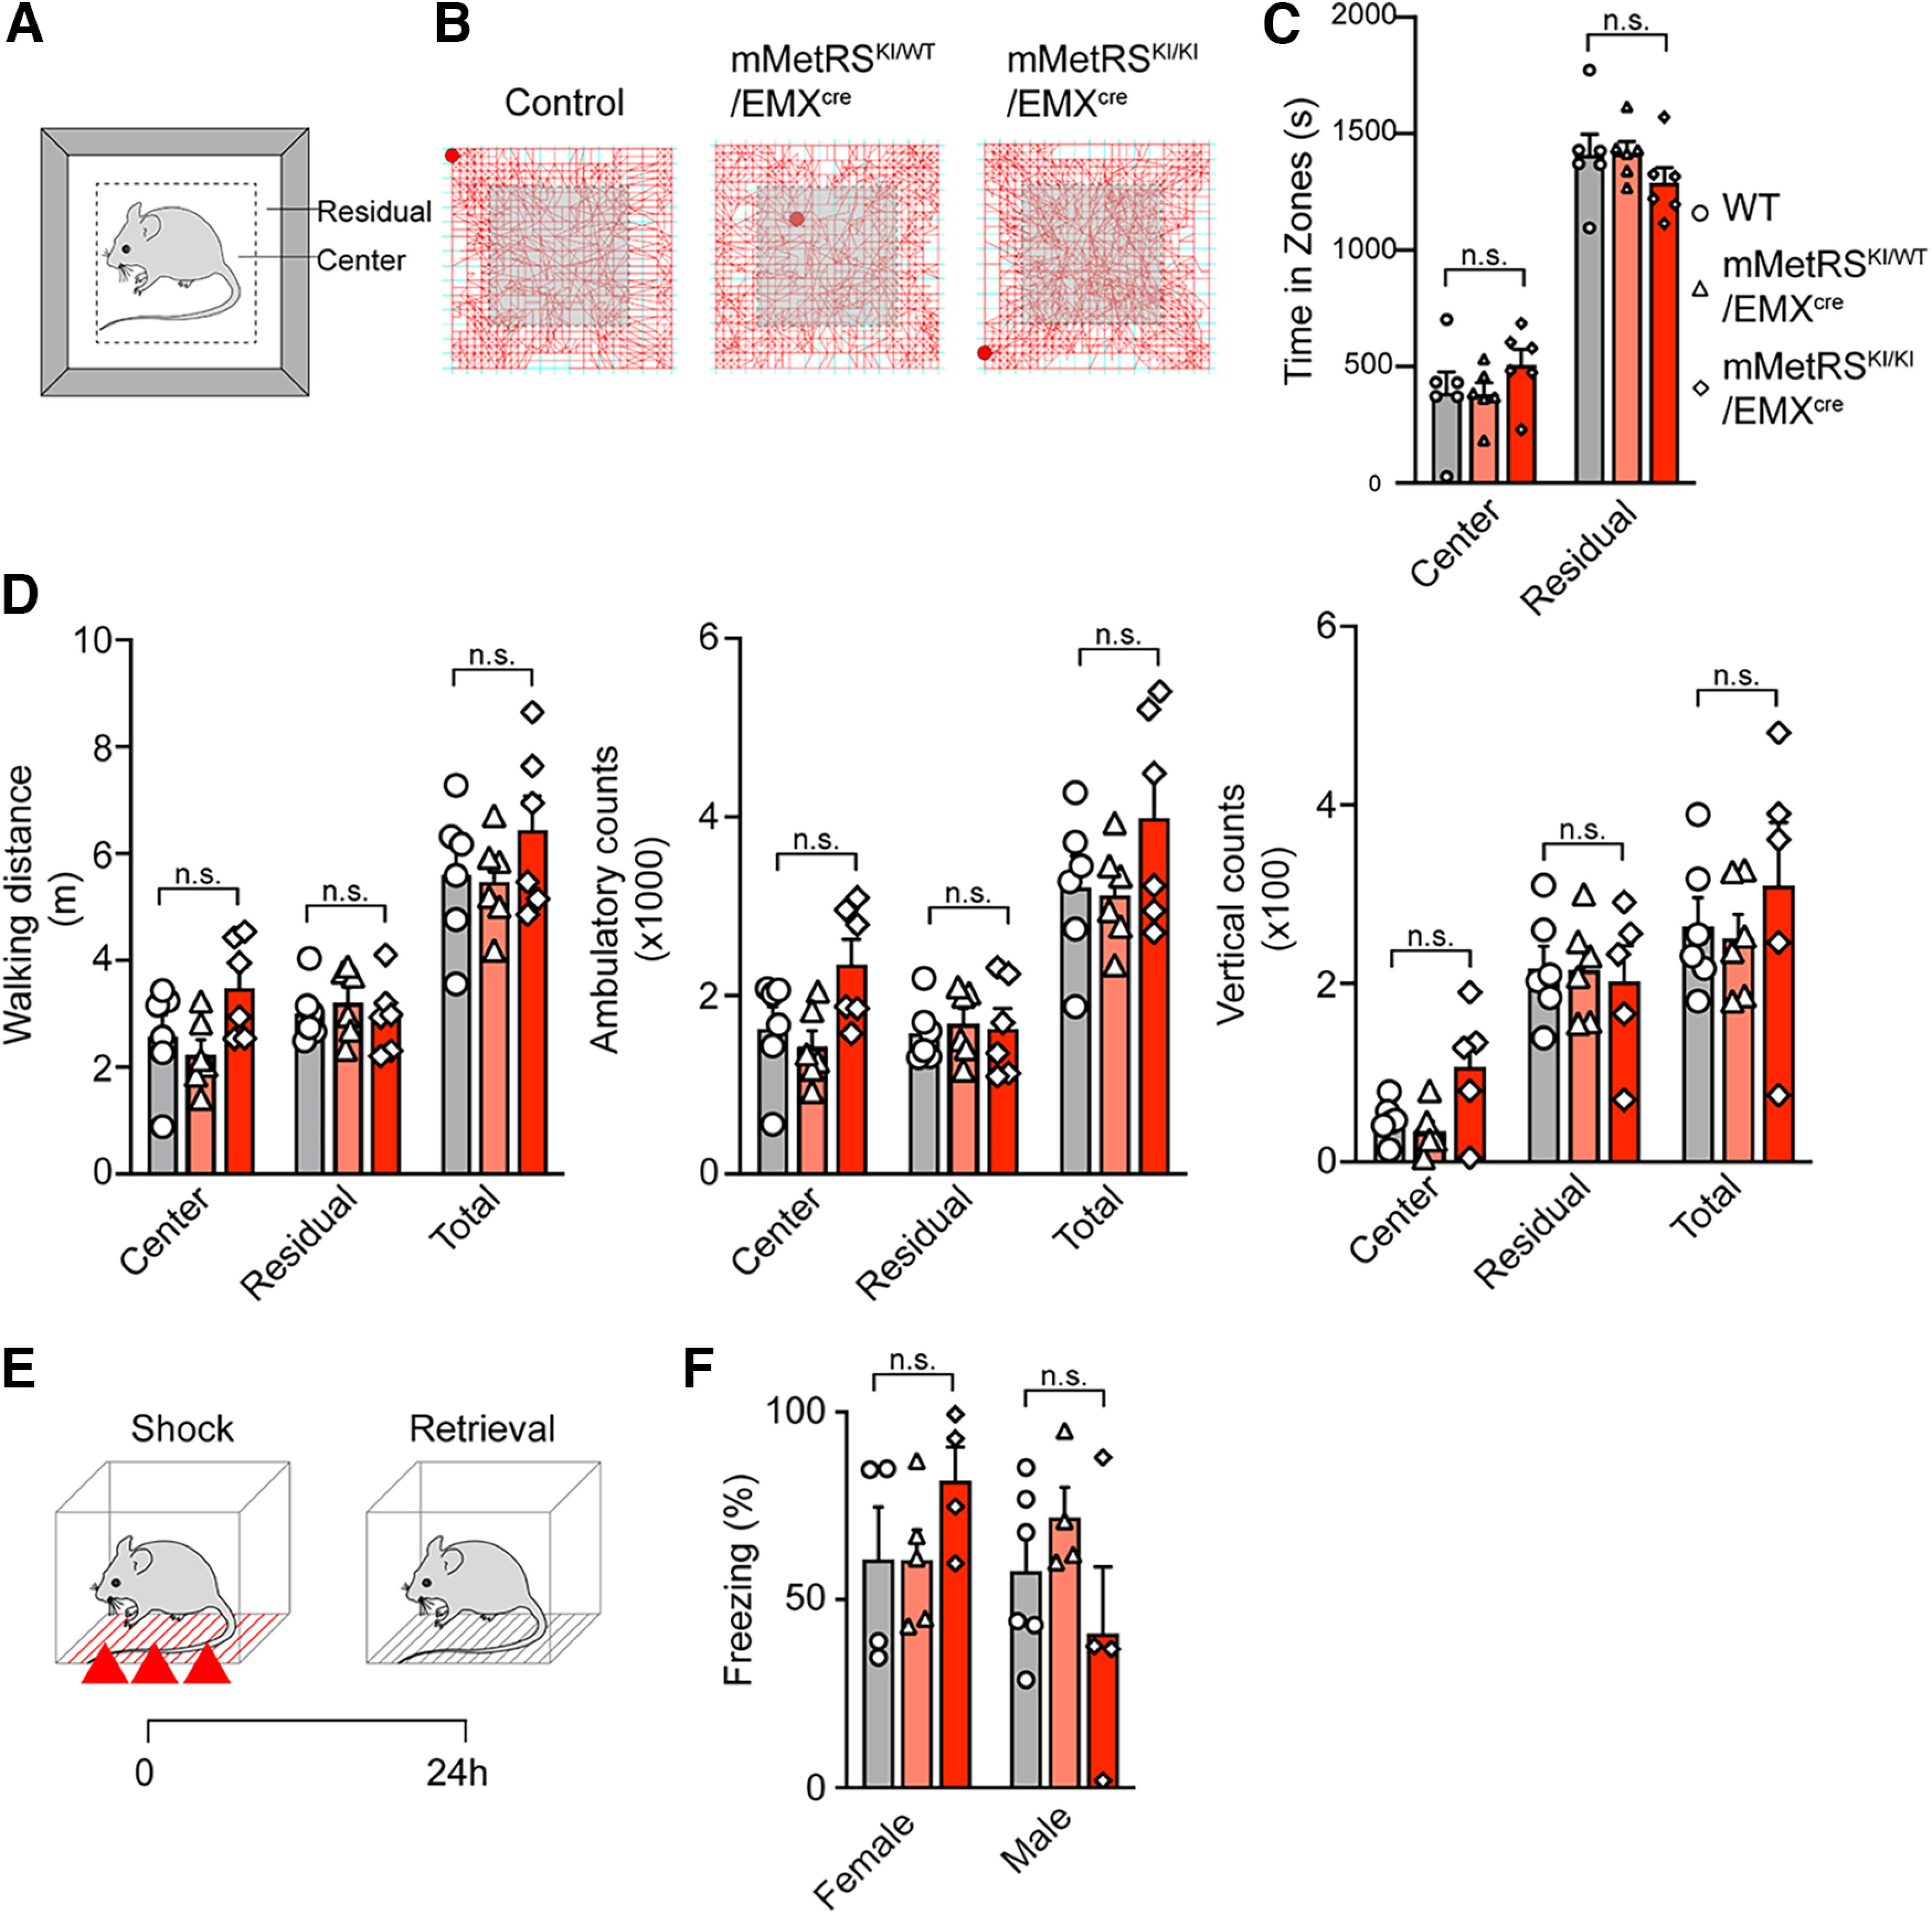
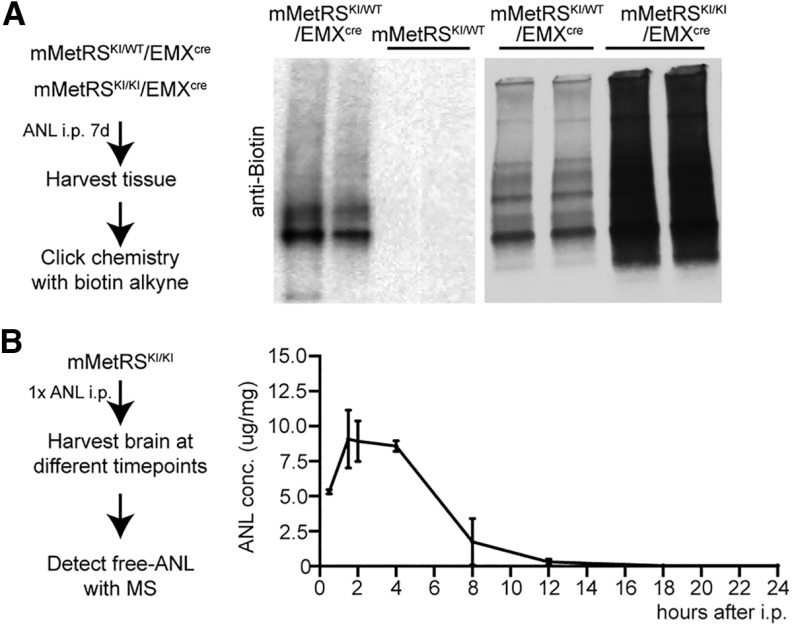
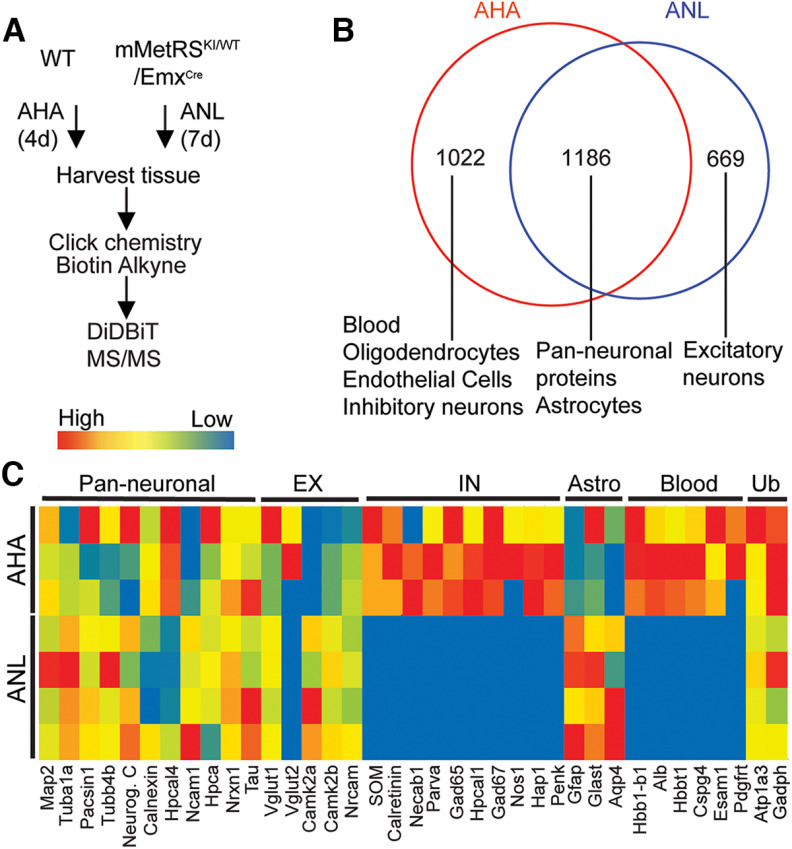
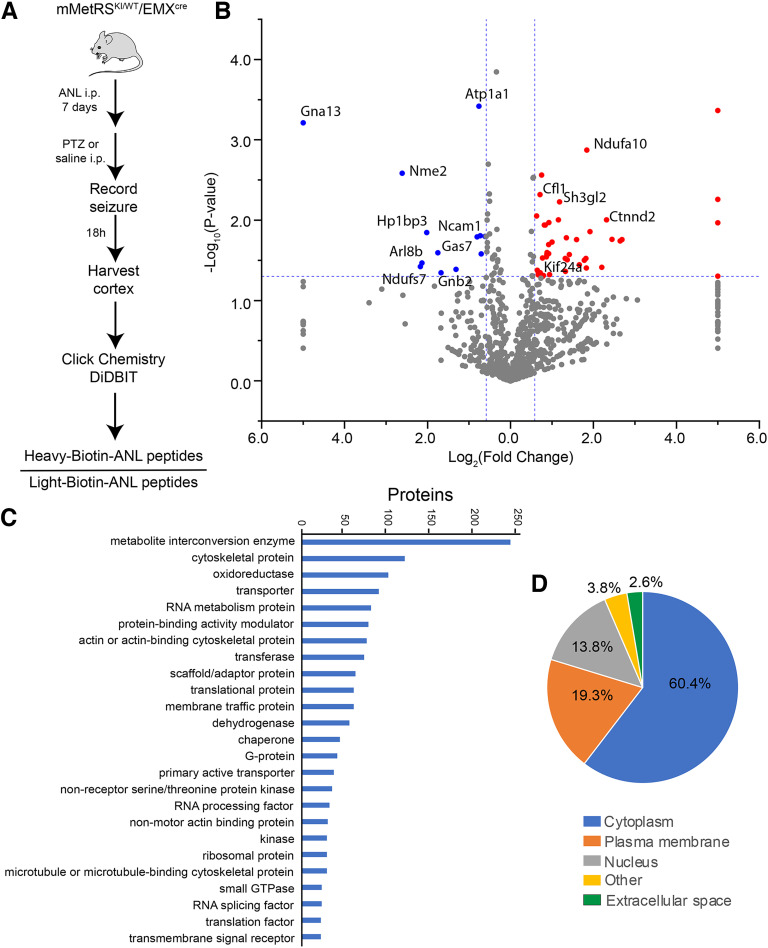
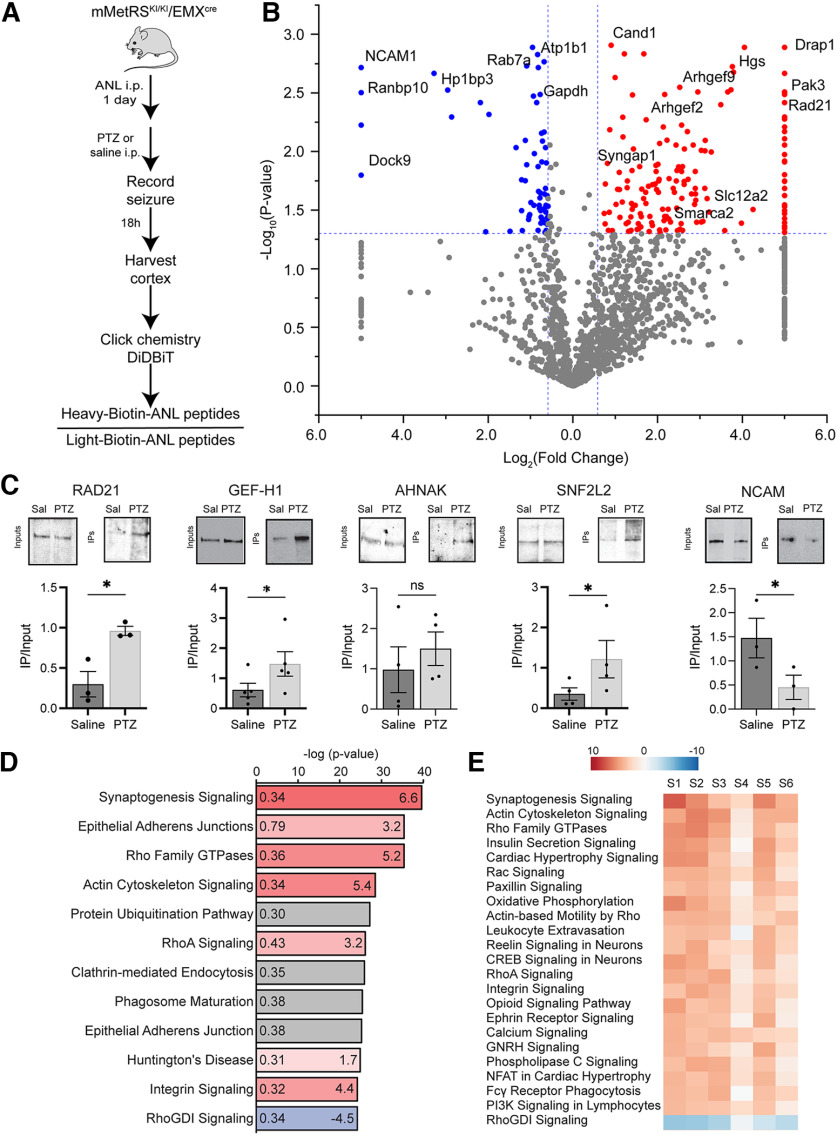
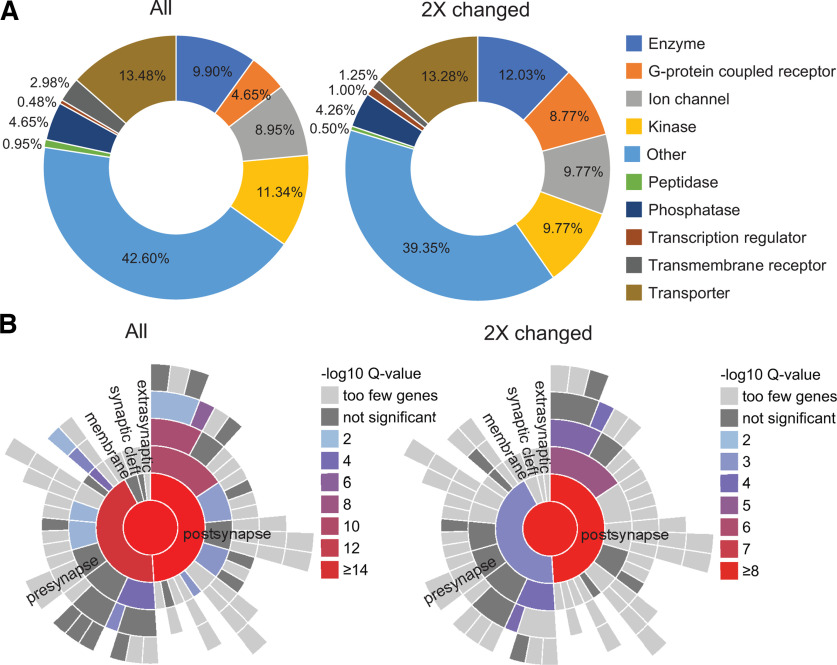
Neuronal activity initiates signaling cascades that culminate in diverse outcomes including structural and functional neuronal plasticity, and metabolic changes. While studies have revealed activity-dependent neuronal cell type-specific transcriptional changes, unbiased quantitative analysis of cell-specific activity-induced dynamics in newly synthesized proteins (NSPs) synthesis in vivo has been complicated by cellular heterogeneity and a relatively low abundance of NSPs within the proteome in the brain. Here we combined targeted expression of mutant MetRS (methionine tRNA synthetase) in genetically defined cortical glutamatergic neurons with tight temporal control of treatment with the noncanonical amino acid, azidonorleucine, to biotinylate NSPs within a short period after pharmacologically induced seizure in male and female mice. By purifying peptides tagged with heavy or light biotin-alkynes and using direct tandem mass spectrometry detection of biotinylated peptides, we quantified activity-induced changes in cortical glutamatergic neuron NSPs. Seizure triggered significant changes in ∼300 NSPs, 33% of which were decreased by seizure. Proteins mediating excitatory and inhibitory synaptic plasticity, including SynGAP1, Pak3, GEPH1, Copine-6, and collybistin, and DNA and chromatin remodeling proteins, including Rad21, Smarca2, and Ddb1, are differentially synthesized in response to activity. Proteins likely to play homeostatic roles in response to activity, such as regulators of proteastasis, intracellular ion control, and cytoskeleton remodeling proteins, are activity induced. Conversely, seizure decreased newly synthetized NCAM, among others, suggesting that seizure induced degradation. Overall, we identified quantitative changes in the activity-induced nascent proteome from genetically defined cortical glutamatergic neurons as a strategy to discover downstream mediators of neuronal plasticity and generate hypotheses regarding their function.SIGNIFICANCE STATEMENT Activity-induced neuronal and synaptic plasticity are mediated by changes in the protein landscape, including changes in the activity-induced newly synthesized proteins; however, identifying neuronal cell type-specific nascent proteome dynamics in the intact brain has been technically challenging. We conducted an unbiased proteomic screen from which we identified significant activity-induced changes in ∼300 newly synthesized proteins in genetically defined cortical glutamatergic neurons within 20 h after pharmacologically induced seizure. Bioinformatic analysis of the dynamic nascent proteome indicates that the newly synthesized proteins play diverse roles in excitatory and inhibitory synaptic plasticity, chromatin remodeling, homeostatic mechanisms, and proteasomal and metabolic functions, extending our understanding of the diversity of plasticity mechanisms.

Keywords: BONCAT; activity dependent; cortex; nascent protein; neuroproteomics; seizure.


Figures

Figure 1.
Figure 1.
Direct detection of newly synthetized ANL-biotin-labeled proteins in mMetRS expressing HEK293T cells. A, Protocol for in vitro ANL labeling. HEK cells were transfected using lipofection with mMetRS and incubated with 4 mm ANL in methionine-free media for 24 h. Cell pellets were washed, homogenized, and processed for click chemistry with heavy or light biotin alkyne. After click reactions, proteins were precipitated and digested, and ANL-biotin-tagged peptides were isolated on NeutrAvidin using the DiDBiT protocol. B, Left, mMetRS-transfected cells, but not untransfected cells, showed incorporation of ANL. Western blots for biotin (left) and corresponding Ponceau staining (right). Right, Western blots of ANL-biotin-tagged proteins from click reactions performed with heavy or light biotin-alkyne show comparable biotin labeling. H-Alk, heavy-alkyne; L-Alk, light-alkyne. C, Chemical structure of the ANL-biotin modification on methionine sites in peptides, with +375.2015 and +379.2087 mass gain for light and heavy biotin-alkynes, respectively, used for direct mass spectrometry identification of tagged peptides. D, Comparable representation of protein classes in ANL-labeled and AHA-labeled newly synthesized proteins using Panther (Extended Data Fig. 1-1, see for proteins in the different categories). E, Comparable subcellular distribution of newly synthesized proteins labeled by ANL and AHA incorporation, according to Ingenuity Pathway Analysis (Extended Data Fig. 1-1, lists of proteins).
Figure 2.
Figure 2.
Characterization of mMetRS/EMXcre lines. A, Schematic of the breeding strategy. EMXcre drives expression of GFP-F2A-mMetRS from the Rosa26floxSTOP-GFP-F2A-mMetRS allele, allowing GFP expression to report mMetRS distribution. B, Images of age-matched animals of mMetRS/EMXcre mutants and their MetRS-negative control littermates at postnatal day 60. C, Body weights of male and female mMetRS/EMXcre mutants and control littermates are comparable (individual datapoints and mean ± SEM values; N = 4, paired t test with Welsh's correction, n.s., not significant). D, GFP expression in cortex and hippocampus in coronal brain sections counterstained with DAPI. E, Confocal images of immunolabeling of layer-specific excitatory cortical neurons with antibodies to Cux1 and Ctip2 in layers II/III and V in DAPI-stained coronal sections in visual cortex, indicating that mMetRS expression does not affect the development of cortical lamination. F, Cellular specificity of GFP-F2A-mMetRS expression in mMetRSKI/WT/EMXcre and mMetRSKI/KI/EMXcre mice. Coronal sections through visual cortex and hippocampus were labeled with DAPI and antibodies against markers of all neurons (NeuN), inhibitory GABAergic neurons (GAD67), or astrocytes (GFAP). GFP is present in NeuN+ neurons, but not in GABAergic neurons. Some GFAP+ astrocytes express GFP, which is consistent with the known EMX expression pattern.
Figure 3.
Figure 3.
mMetRS expression in excitatory cortical neurons does not affect behavior. A–D, Open field tests of locomotor activity. A, Schematic of the open field arena, showing the center and peripheral (residual) regions of the arena. B, Representative foot tracks of mMetRSKI/WT/EMXCre mutants (middle) and mMetRSKI/KI/EMXCre mutants (right), and their control littermates (left). C, Quantification of time spent in central and peripheral zones. D, Quantification of cumulative walking distances, ambulatory counts, and vertical counts. E, F, Analysis of associative memory. E, Workflow for fear conditioning and contextual memory retrieval. Animals are exposed to a series of 3 footshocks and tested for memory retrieval assessed as freezing behavior in the same context 24 h later. F, Short- and long-term memory in males and females, assessed as a percentage of the time spent freezing. All graphs show individual datapoints and averaged values (mean ± SEM). A–D, N = 6 (3 males and 3 females). F, N = 4-6, paired t test with Welsh's correction. C, D, F. Gray, WT; pink, mMetRSKI/WT; red, mMetRSKI/KI. n.s., not significant.
Figure 4.
Figure 4.
Optimization of ANL protein labeling in vivo. A, Comparison of ANL incorporation in heterozygote or homozygote mMetRSKI/WT/EMX and mMetRSKI/KI/EMX mice and mMetRS/WT littermates. Left, Schematic of the protocol. Animals were treated with a daily dose of ANL (830 mg/kg, i.p.) for 1 week, and the brain was harvested 18–20 h after the last ANL treatment. Tissue was processed for click chemistry with biotin-alkyne. Middle, Western blots comparing ANL-biotin-labeled proteins from mMetRSKI/WT/EMXcre and mMetRSWT/WT littermates. No ANL incorporation into proteins is observed in the absence of cre-induced mMetRS expression. Right, Western blots showing more ANL-biotin label in comparable amounts of protein samples from mMetRSKI/KIEMXcre mice compared with mMetRSKI/WT/EMXcre mice. B, Analysis of brain ANL levels after intraperitoneal injection by mass spectrometry. Left, Schematic of the experiment. mMetRS mice received 1 dose of ANL intraperitoneally and brains were harvested at different timepoints after injection. Free ANL in the brain was detected by MS. Right, ANL levels in the brain over time [mean ± SEM; N = 4 mice (2 males and 2 females) paired t test with Welsh's correction]. ANL concentration was calculated by the amount of ANL in ug normalized to the amount of brain tissue analyzed in mg.
Figure 5.
Figure 5.
Genetic control of mMetRS expression allows identification of NSPs in specific neural cell types. A, Schematic of the NSP labeling protocols for AHA and ANL. For global AHA labeling of NSPs, mice were fed AHA-laced chow ad libitum for 4 d. For neural cell type-specific labeling, mMetRSKI/WT/EMXcre mice received daily intraperitoneal injections of ANL (830 mg/kg) for 1 week. For mMetRSKI/WT/EMXcre samples, cortex was dissected from isolated brains and processed for click chemistry, DiDBiT and mass spectrometry protein identification (MS/MS). For AHA samples, the entire brain was processed for click chemistry, DiDBiT, and MS/MS. B, Venn diagram showing overlap between the AHA-labeled and ANL-labeled proteomes. AHA-labeled samples include proteins from blood, vasculature (endothelial cells), oligodendrocytes, and GABAergic neurons that are absent from ANL-labeled samples. Proteins detected in both AHA-labeled and ANL-labeled samples include astrocyte and pan-neuronal proteins. Proteins uniquely labeled with ANL are annotated to excitatory neurons and astrocytes, consistent with the distributions of mMetRS expression in mMetRS/EMXcre mice (Extended Data Fig. 5-1). C, Heat map of relative detection of proteins from excitatory neurons, inhibitory neurons, astrocytes, blood, and ubiquitous proteins (Ub) across 4 independent MS/MS runs of samples from mMetRSKI/WT/EMXcre mice (2 males and 2 females) and 3 independent MS/MS runs of AHA samples (3 males), based on spectral counts from markers of different cellular populations in ANL- and AHA-labeled proteomes (Extended Data Fig. 5-2).
Figure 6.
Figure 6.
Activity-induced nascent proteomic dynamics in excitatory cortical neurons following 7 d of ANL treatment. A, Schematic of experimental protocol. Adult mMetRSKI/WT/EMXcre mice were treated with a daily dose of ANL (830 mg/kg, i.p.) for 1 week followed by a single dose of PTZ (30–39 µg/kg, i.p.) to induce seizure. The brain was harvested 18–20 h later. Cortical tissue was processed to tag ANL-containing proteins with heavy or light isotopically labeled biotin-alkyne using click chemistry before LC-MS/MS analysis of biotinylated peptides. B, Volcano plot showing quantitative proteomic analysis of PTZ versus control samples. Statistically significantly (p < 0.05, |FC|>1.5) increases or decreases are labeled in red or blue, respectively. N = 4 pairs of control and PTZ-treated mice, with 3 pairs of males and 1 pair of females (Extended Data Fig. 6-1, see for list of all quantified peptides). C, D, Protein classes (C) and cellular localization (D) of the NSPs labeled with ANL [Extended Data Figs. 6-2 and 6-3, see for data on Top Protein Categories (Panther) and Protein Subcellular Localization (IPA)].
Figure 7.
Figure 7.
Temporal control of ANL treatment improves MS/MS detection of newly synthetized proteins in excitatory cortical neurons after acute seizure induced by PTZ. A, Experimental design to identify changes in newly synthetized proteins after acute seizure. mMetRSKI/KI/EMXcre mice received a single intraperitoneal dose of 47 μg/kg PTZ together with ANL or saline; 18–20 h later, brains were collected and cortex was isolated and processed for click chemistry with heavy and light biotin alkynes and DiDBiT to isolate biotinylated peptides for mass spectrometry protein identification. B, Volcano plot showing quantitative proteomic analysis of changes in newly synthesized proteins induced by PTZ compared with saline. N = 4 independent experiments (3 pairs of males and 1 pair of females). Significantly increased and decreased (p < 0.05, |FC| > 1.5) newly synthetized proteins are labeled in red and blue, respectively (Extended Data Fig. 7-1, see for list of all quantified peptides; Extended Data Fig. 7-2, see for lists of proteins from the 7 and 1 d ANL treatment experiments). C, Western blots of inputs and IPs comparing selected NSPs in saline-injected and PTZ-injected samples. Quantification of labeling: individual datapoints and mean ± SEM; N = 4 independent samples. *p < 0.05 Student's t test with Welsh's correction. n.s., not significant; sal, saline. D, IPA (QIAGEN) canonical pathway analysis identified the signaling pathways that change the most in response to PTZ treatment compared with saline treatment. The color of bars represents the z score (values provided to right within bars) that predict increases (red) or decreases (blue) in the function of each pathway. The gray bar represents pathways where no prediction can be made (Extended Data Fig. 7-3). E, Comparative analysis showing z scores of the most significantly changed canonical pathways across 6 independent samples (S1-S6; 3 pairs of males and 3 pairs of females; Extended Data Fig. 7-4).
Figure 8.
Figure 8.
Analysis of activity-induced NSPs annotated to different subcellular compartments. A, Doughnut charts showing the relative representation of functional categories of plasma membrane proteins (as annotated by QIAGEN IPA software) in the entire dataset of proteins (All, left) compared with the subset of proteins that were changed at least twofold in response to the PTZ treatment (2× changed, right). Among the more than twofold changed proteins following PTZ treatment, plasma membrane G-protein-coupled receptors and plasma membrane-associated transcriptional regulators showed the highest proportional increase. Peptidases and transmembrane receptors were decreased, and phosphatases and transporters were largely unchanged by PTZ treatment (Extended Data Figs. 8-1, 8-2). B, Activity-induced synaptic NSPs are enriched in postsynaptic proteins. SynGO, a tool focused on synaptic gene ontologies, showed enrichment of diverse proteins with known synaptic functions in our dataset. The distribution of presynaptic versus postsynaptic newly synthesized proteins was heavily skewed toward postsynaptic proteins in the more than twofold changed dataset (right) compared with the entire dataset (left), indicating that PTZ treatment altered the expression of more postsynaptic proteins than presynaptic proteins (Extended Data Figs. 8-3, 8-4, 8-5, 8-6).
Figure 9.
Figure 9.
EP300/PCAF: a master regulator of activity-regulated NSPs and a possible link to long-term cellular changes via chromatin remodeling. The Ingenuity Causal Network Analysis identified the EP300/PCAF complex as the top master regulator predicted to control intermediate regulators that are responsible for protein expression changes observed in our NSP dataset. The figure shown here is a schematic of the molecular interaction network superimposed on cellular compartments, the nucleus, cytoplasm, plasma membrane, and extracellular space. TP53 (p53), EP300, and KAT2b are prominent nodes that interact with EP300/PCAF and that receive and distribute signals from a dispersed network of proteins located in the different subcellular compartments. For molecular relationships, solid lines represent direct interactions and broken lines represent indirect interactions. The arrows represent activation of targets and blocked lines represent inhibition of the targets. The orange and blue lines indicate that the relationship leads to activation or inhibition, respectively. The yellow lines indicate that the findings are inconsistent with the state of downstream molecule. The shapes and colors of the symbols indicate protein class and expression levels, respectively, as detailed in Extended Data Figure 9-4 (Extended Data Figs. 9-1, 9-2, 9-3, see for details).
Figure 10.
Figure 10.
Activity-induced NSPs are enriched in ChIP-seq targets of CREB1. Enrichr transcription analysis of dataset of NSP proteins that were changed more than twofold in response to PTZ treatment. The analysis was performed using the ChEA 2016 gene set library containing functional terms representing transcription factors profiled by ChIP-seq in mammalian cells. A, The top transcription factors, including information about the publication PMID number, cell type, and organism, are plotted by -log (p-value) shown next to the bar. B, Network showing gene content similarity between the gene set libraries represented by the top transcription factors. C, Clustergram showing the top 10 transcription factors (columns) with the top 40 input proteins (rows, left) or all input proteins (rows, right). The colored (red) cells in the matrix show whether the transcript of the input protein is associated with the transcription factor. D, Protein–protein associations mapped using the STRING database of the top 10 transcription factors from the Enrichr analysis using all proteins (left) or the twofold changed proteins in response to PTZ (right) as the input (Extended Data Figs. 10-1, 10-2, 10-3).

References

    1. Alvarez-Castelao B, Schanzenbächer CT, Hanus C, Glock C, Tom Dieck S, Dörrbaum AR, Bartnik I, Nassim-Assir B, Ciirdaeva E, Mueller A, Dieterich DC, Tirrell DA, Langer JD, Schuman EM (2017) Cell-type-specific metabolic labeling of nascent proteomes in vivo. Nat Biotechnol 35:1196–1201. 10.1038/nbt.4016 - DOI - PubMed
    1. Alvarez-Castelao B, Schanzenbächer CT, Langer JD, Schuman EM (2019) Cell-type-specific metabolic labeling, detection and identification of nascent proteomes in vivo. Nat Protoc 14:556–575. 10.1038/s41596-018-0106-6 - DOI - PubMed
    1. Ashok C, Selvam M, Ponne S, Parcha PK, Raja KMP, Baluchamy S (2020) CREB acts as a common transcription factor for major epigenetic repressors; DNMT3B, EZH2, CUL4B and E2F6. Med Oncol 37:68. 10.1007/s12032-020-01395-5 - DOI - PubMed
    1. Bencurova P, Baloun J, Hynst J, Oppelt J, Kubova H, Pospisilova S, Brazdil M (2021) Dynamic miRNA changes during the process of epileptogenesis in an infantile and adult-onset model. Sci Rep 11:9649. 10.1038/s41598-021-89084-9 - DOI - PMC - PubMed
    1. Boda B, Alberi S, Nikonenko I, Node-Langlois R, Jourdain P, Moosmayer M, Parisi-Jourdain L, Muller D (2004) The mental retardation protein PAK3 contributes to synapse formation and plasticity in hippocampus. J Neurosci 24:10816–10825. 10.1523/JNEUROSCI.2931-04.2004 - DOI - PMC - PubMed

Publication types