

Validity and Performance of Blood Biomarkers for Alzheimer Disease to Predict Dementia Risk in a Large Clinic-Based Cohort
- PMID: 36261295
- PMCID: PMC9931079
- DOI: 10.1212/WNL.0000000000201479
Validity and Performance of Blood Biomarkers for Alzheimer Disease to Predict Dementia Risk in a Large Clinic-Based Cohort
Abstract
Background and objective: Blood biomarkers for Alzheimer disease (AD) have consistently proven to be associated with CSF or PET biomarkers and effectively discriminate AD from other neurodegenerative diseases. Our aim was to test their utility in clinical practice, from a multicentric unselected prospective cohort where patients presented with a large spectrum of cognitive deficits or complaints.
Methods: The MEMENTO cohort enrolled 2,323 outpatients with subjective cognitive complaint (SCC) or mild cognitive impairment (MCI) consulting in 26 French memory clinics. Participants had neuropsychological assessments, MRI, and blood sampling at baseline. CSF sampling and amyloid PET were optional. Baseline blood Aβ42/40 ratio, total tau, p181-tau, and neurofilament light chain (NfL) were measured using a Simoa HD-X analyzer. An expert committee validated incident dementia cases during a 5-year follow-up period.
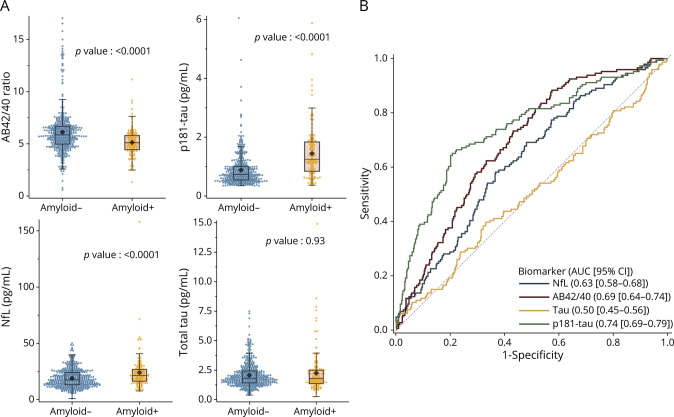
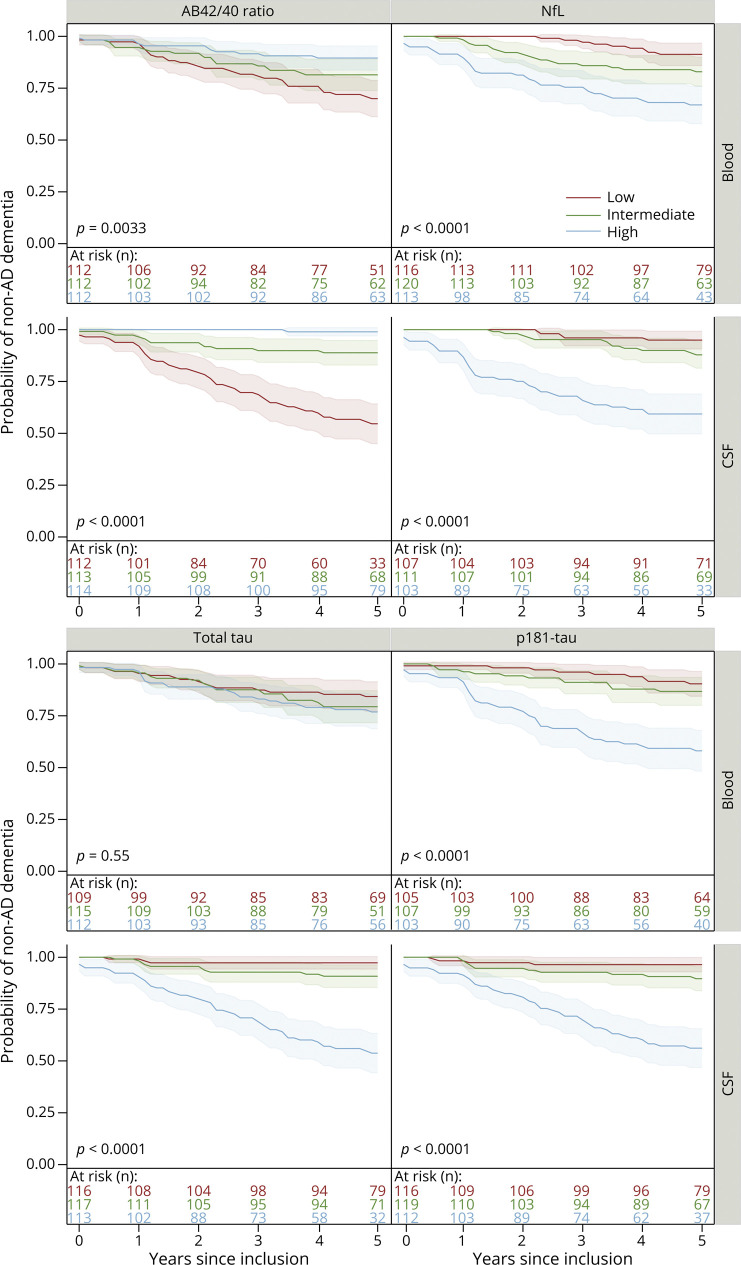
Results: Overall, 2,277 individuals had at least 1 baseline blood biomarker available (n = 357 for CSF subsample, n = 649 for PET subsample), among whom 257 were diagnosed with clinical AD/mixed dementia during follow-up. All blood biomarkers but total tau were mildly correlated with their equivalence in the CSF (r = 0.33 to 0.46, p < 0.0001) and were associated with amyloid-PET status (p < 0.0001). Blood p181-tau was the best blood biomarker to identify amyloid-PET positivity (area under the curve = 0.74 [95% CI = 0.69; 0.79]). Higher blood and CSF p181-tau and NfL concentrations were associated with accelerated time to AD dementia onset with similar incidence rates, whereas blood Aβ42/40 was less efficient than CSF Aβ42/40. Blood p181-tau alone was the best blood predictor of 5-year AD/mixed dementia risk (c-index = 0.73 [95% CI = 0.69; 0.77]); its accuracy was higher in patients with clinical dementia rating (CDR) = 0 (c-index = 0.83 [95% CI = 0.69; 0.97]) than in patients with CDR = 0.5 (c-index = 0.70 [95% CI = 0.66; 0.74]). A "clinical" reference model (combining demographics and neuropsychological assessment) predicted AD/mixed dementia risk with a c-index = 0.88 [95% CI = 0.86-0.91] and performance increased to 0.90 [95% CI = 0.88; 0.92] when adding blood p181-tau + Aβ42/40. A "research" reference model (clinical model + apolipoprotein E genotype and AD signature on MRI) had a c-index = 0.91 [95% CI = 0.89-0.93] increasing to 0.92 [95% CI = 0.90; 0.93] when adding blood p181-tau + Aβ42/40. Chronic kidney disease and vascular comorbidities did not affect predictive performances.
Discussion: In a clinic-based cohort of patients with SCC or MCI, blood biomarkers may be good hallmarks of underlying pathology but add little to 5-year dementia risk prediction models including traditional predictors.
Copyright © 2022 The Author(s). Published by Wolters Kluwer Health, Inc. on behalf of the American Academy of Neurology.
Figures
References
-
- Dubois B, Feldman HH, Jacova C, et al. Revising the definition of Alzheimer's disease: a new lexicon. Lancet Neurol. 2010;9(11):1118-1127. - PubMed
-
- Planche V, Villain N. US Food and Drug Administration approval of aducanumab-is amyloid load a valid surrogate end point for alzheimer disease clinical trials?. JAMA Neurol. 2021;78(11):1307. - PubMed
Publication types
MeSH terms
Substances
LinkOut - more resources
Full Text Sources
Medical
Research Materials