. 2022 Oct 19;13(1):5889.
doi: 10.1038/s41467-022-33630-0.

The unfolded protein response reverses the effects of glucose on lifespan in chemically-sterilized C. elegans

Affiliations

The unfolded protein response reverses the effects of glucose on lifespan in chemically-sterilized C. elegans

Caroline Beaudoin-Chabot et al. Nat Commun. .

Abstract

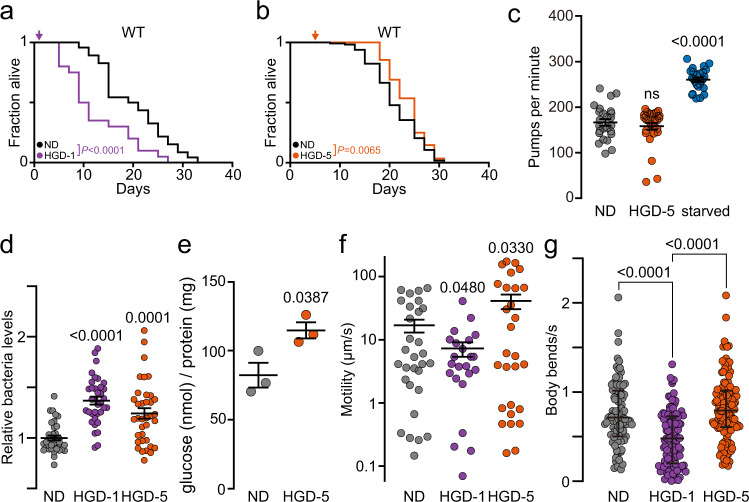
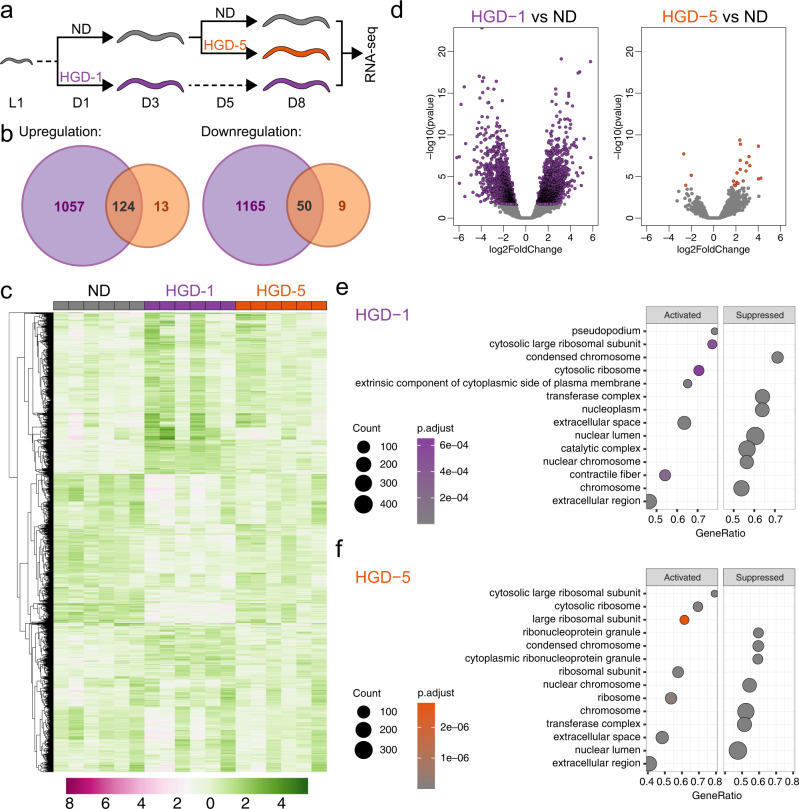
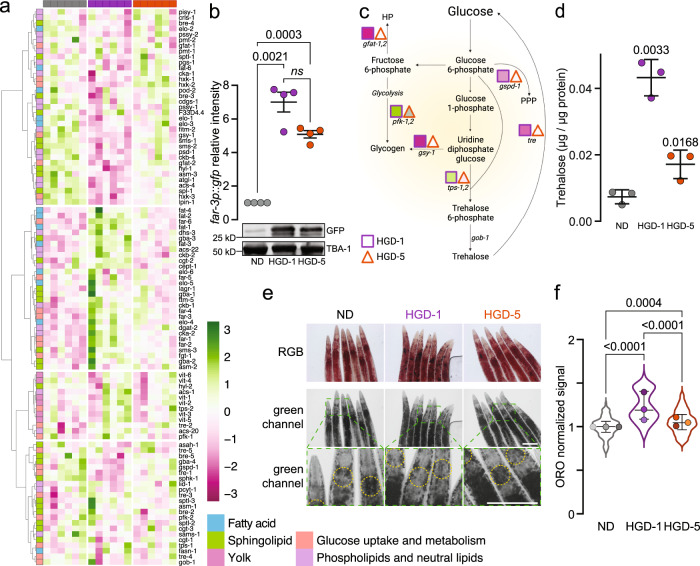
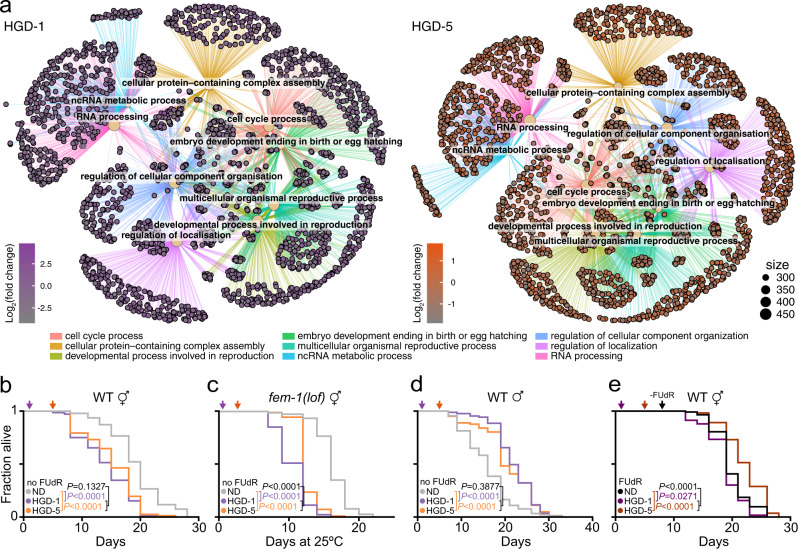
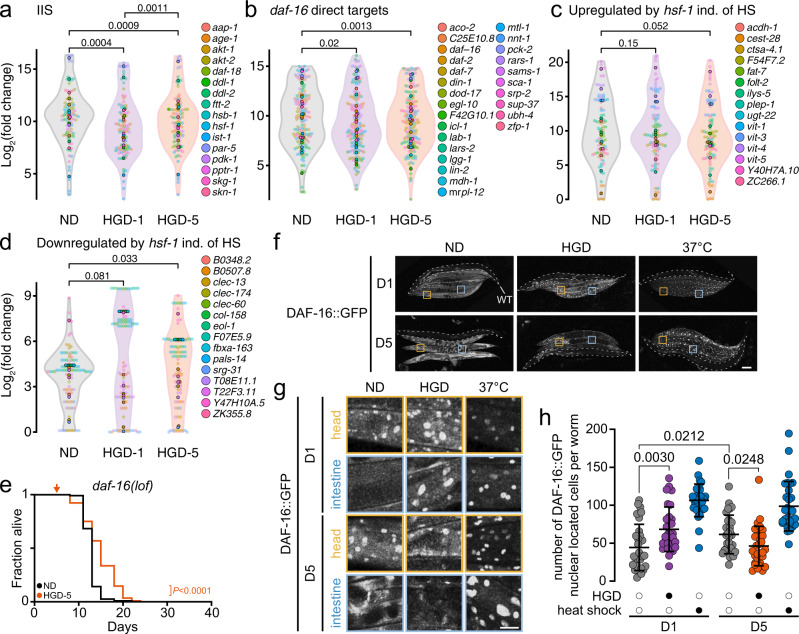
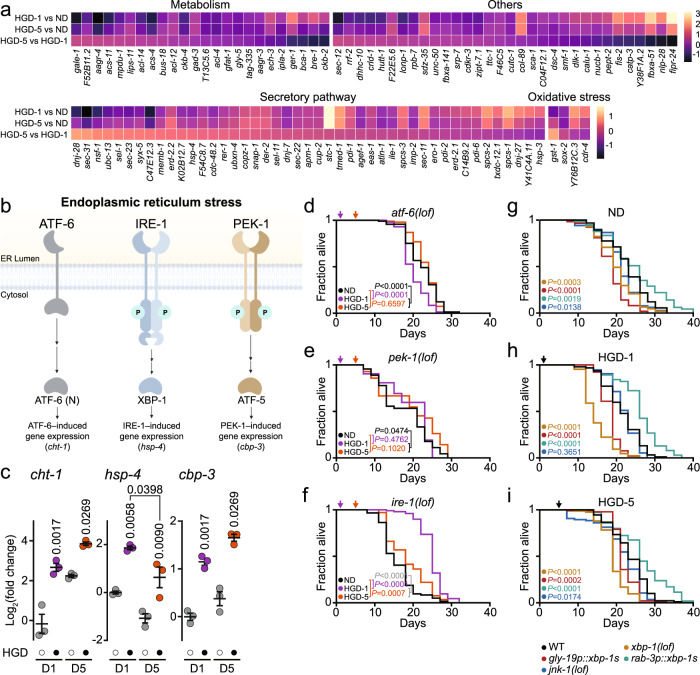
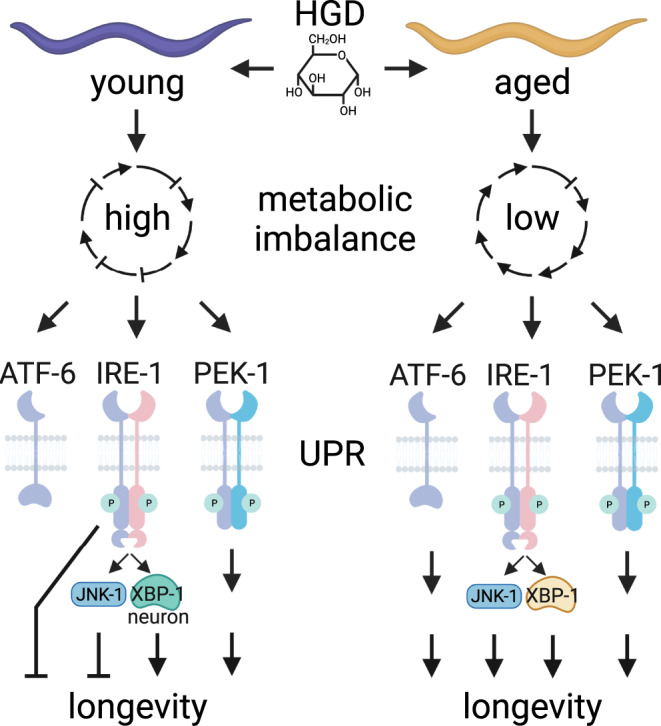
Metabolic diseases often share common traits, including accumulation of unfolded proteins in the endoplasmic reticulum (ER). Upon ER stress, the unfolded protein response (UPR) is activated to limit cellular damage which weakens with age. Here, we show that Caenorhabditis elegans fed a bacterial diet supplemented high glucose at day 5 of adulthood (HGD-5) extends their lifespan, whereas exposed at day 1 (HGD-1) experience shortened longevity. We observed a metabolic shift only in HGD-1, while glucose and infertility synergistically prolonged the lifespan of HGD-5, independently of DAF-16. Notably, we identified that UPR stress sensors ATF-6 and PEK-1 contributed to the longevity of HGD-5 worms, while ire-1 ablation drastically increased HGD-1 lifespan. Together, we postulate that HGD activates the otherwise quiescent UPR in aged worms to overcome ageing-related stress and restore ER homeostasis. In contrast, young animals subjected to HGD provokes unresolved ER stress, conversely leading to a detrimental stress response.


Conflict of interest statement

The authors declare no competing interests.

Figures

Fig. 1
Fig. 1. Glucose extends lifespan of aged but not of young adult worms.
a Lifespan assays of WT nematodes fed with UV-killed E. coli OP50 diet (normal diet, ND) alone or supplemented with 2% glucose (high glucose diet, HGD) at 1-day old (D1, HGD-1) and b 5-day old (D5, HGD-5) worms (NDa, n = 170; HGD-1, n = 90; NDb, n = 722; HGD-5, n = 772 including biological replicates). c Pharyngeal pumping rate (ND, n = 25; HGD-5, n = 28; starved, n = 25), d Bacteria intake relative to bacteria clearance within WT ND after 3 day incubation (ND, n = 417; HGD-1, n = 424; HGD-5, n = 473), e Glucose levels inside of worms and f motility on bacteria-free nematode growth media (NGM) agar of worms (ND, n = 30; HGD-1, n = 23; HGD-5, n = 28) in D5 WT on 24 h ND, HGD or 4 h starvation. g Thrashing assay for WT, HGD-1 and HGD-5 worms at day 12. P values compared to WT on ND (ND, n = 91; HGD-1, n = 105; HGD-5, n = 130). ns, non-significant with P > 0.05. Data shown are the mean ± SEM. Statistical analysis was subjected to log-rank test for lifespan (a, b) or one-way ANOVA with Tukey’s test (c–g).
Fig. 2
Fig. 2. HGD induces global transcriptomic changes in young but not aged animals.
a Experimental design of bulk RNA-seq. A single pool of synchronised worms was grown on ND until day 1 of adulthood (D1). From the same single pool, a subset of worms was fed on HGD at day 1 (HGD-1). The second subset of worms grown on ND was fed on HGD at day 5 (HGD-5) of adulthood (D5). Wrms fed ND, HGD-1, and HGD-5 were harvested at D8 (n = 6). b Venn diagram represents differentially expressed genes in HGD-1 and HGD-5 compared to ND. c Hierarchical clustering of the top 10,000 differently expressed genes in all samples. d Volcano plots of HGD-1 and HGD-5 compared to ND where coloured data points represent differentially expressed genes. Functional annotation analysis in HGD-1 (e) and HGD-5 (f).
Fig. 3
Fig. 3. The metabolic landscape is differently modified in young and aged animals fed HGD.
a Heat maps of glucose and lipid metabolism genes. b Quantification and representative immunoblot of GFP levels in day 10 far-3p::gfp animals fed ND, HGD-1 and HGD-5 (n = 4). c Major glucose metabolic pathways in C. elegans, f6p fructose-6-phosphate, g1p glucose-1-phosphate, g6p glucose-6-phosphate, HP hexosamine pathway, PPP pentose phosphate pathway, UDP-G uridine diphosphate glucose. Adapted from Seo et al. and created with BioRender.com. d Trehalose levels of worms treated as in WT, HGD-1 and HGD-5 at day 10 (n = 3). e Representative images of Oil Red O (ORO) staining of ND, HGD-1 and HGD-5 animals harvested on day 10. Lipid droplets were quantified from the green channel within regions of interest (yellow-dashed circles) as previously reported. Scale bar represents 100 μm. f Quantification of ORO-stained lipid droplets at the pharynx of animal as in e (ND, n = 127; HGD-1, n = 110; HGD-5, n = 112 including biological replicates). Data shown are the mean ± SEM. Statistical analysis was subjected to one-way ANOVA with Tukey’s test.
Fig. 4
Fig. 4. Glucose and infertility synergistically drive the lifespan of aged animals.
a Cnetplots depict the linkages of genes and biological concepts in HGD-1 and HGD-5 compared to ND, respectively, where each nod shows the most enriched pathways. b-c Lifespan assays of WT (ND, n = 287; HGD-1, n = 255; HGD-5, n = 255 including biological replicates) (b) or fem-1(lof) hermaphrodite (ND, n = 186; HGD-1, n = 191; HGD-5, n = 209 including biological replicates) (c) animals fed normal diets (ND) or high glucose diet (HGD) from 1- (HGD-1) or 5-day old (HGD-5) in the absence of 5-Fluoro-2′-deoxyuridine (FUdR). d Lifespan assays of WT male animals fed ND, HGD-1, or HGD-5 in the absence of FUdR (ND, n = 150; HGD-1, n = 139; HGD-5, n = 143 including biological replicates). e Lifespan assays of WT hermaphrodite animals fed on ND, HGD-1, HGD-5 in the presence of FUdR from L4 to D8 (ND, n = 213; HGD-1, n = 216; HGD-5, n = 208 including biological replicates). Data shown are the mean ± SEM. Statistical analysis was subjected to log-rank test for lifespan.
Fig. 5
Fig. 5. Glucose extends lifespan in aged worms independently of the DAF-16 (FOXO).
Differentially regulated genes downstream of the insulin/insulin-like growth factor signalling (IIS) (a), daf-16 (b), hsf-1 independently (ind.) of heat shock (HS) (c, d) in animals fed on the normal diet (ND) or high-glucose diet (HGD) from 5-day old (HGD-5). e Lifespan assays of daf-16(lof) animals fed on the ND or HGD-5 (ND, n = 502; HGD-5, n = 536 including biological replicates). f, g Representative images of DAF-16::GFP localisation in 1- (D1) and 5-day old (D5) worms on 16 h ND, HGD (filled circles) or 1 h heat shock (filled circles) at 37 °C (n = 60 for each condition including biological replicates). Scale bars represent 100 μm (f) and 25 μm (g). Highlighted worms with dashed lines are WT animals. h Quantification of GFP in panel f (n = 30). P values to ND of WT. Data shown are the mean ± SEM. Statistical analysis was subjected to one-way ANOVA with Tukey’s test (ad, h) or log-rank test for lifespan (e).
Fig. 6
Fig. 6. The UPR responsiveness is remodelled in aged worms extending lifespan upon HGD.
a Differentially expressed genes related to the UPR comparing each diet group with one another. b Overview of the unfolded protein response (UPR) in C. elegans. Created with BioRender.com. c qPCR comparing expression of genes cht-1, hsp-4, and F40F12.7 induced from UPR branches ATF-6, IRE-1, and PEK-1, respectively, in 1- and 5-day-old WT worms fed 24 h normal diet (ND, open circles) or high glucose diet (HGD, filled circles). Data shown are the mean ± SEM (n = 3). dg Lifespan assay of 1- and 5-day-old atf-6(lof) (ND, n = 287; HGD-1, n = 99; HGD-5, n = 280 including biological replicates) (d) and pek-1(lof) (ND, n = 215; HGD-1, n = 52; HGD-5, n = 104 including biological replicates) (e) worm mutants fed ND or HGD. f Lifespan assay of ire-1(lof) worm mutant treated as in d (ND, n = 229; HGD-1, n = 387; HGD-5, n = 263 including biological replicates). Lifespan assays of WT, xbp-1(lof), gly-19p::xbp-1s, rab-3p::xbp-1s and jnk-1(lof) fed ND (g), HGD-1 (h) or HGD-5 (i). Statistical analysis was subjected to one-way ANOVA with Tukey’s test (c) or log-rank test for lifespan (di).
Fig. 7
Fig. 7. HGD-induced UPR modulates longevity differently in young and aged animals.
C. elegans fed high glucose diet (HGD) at a young (day 1 of adulthood) or older (day 5 of adulthood) age induces a high and low metabolic imbalance, respectively. In turn, HGD reduces the longevity of young animals in an IRE-1-dependent manner while promoting an increase in lifespan via the ER stress sensors ATF-6 and PEK-1 in aged animals. The proposed model is applicable to chemically-sterilized worms. Created with BioRender.com.

References

    1. Lin MH, Wu MC, Lu S, Lin J. Glycemic index, glycemic load and insulinemic index of Chinese starchy foods. World J. Gastroenterol. 2010;16:4973–4979. doi: 10.3748/wjg.v16.i39.4973. - DOI - PMC - PubMed
    1. Venn BJ, Green TJ. Glycemic index and glycemic load: measurement issues and their effect on diet-disease relationships. Eur. J. Clin. Nutr. 2007;61:S122–S131. doi: 10.1038/sj.ejcn.1602942. - DOI - PubMed
    1. Aston LM. Glycaemic index and metabolic disease risk. Proc. Nutr. Soc. 2006;65:125–134. doi: 10.1079/PNS2005485. - DOI - PubMed
    1. Schulz TJ, et al. Glucose restriction extends Caenorhabditis elegans life span by inducing mitochondrial respiration and increasing oxidative stress. Cell Metab. 2007;6:280–293. doi: 10.1016/j.cmet.2007.08.011. - DOI - PubMed
    1. Lee SJ, Murphy CT, Kenyon C. Glucose shortens the life span of C. elegans by downregulating DAF-16/FOXO activity and aquaporin gene expression. Cell Metab. 2009;10:379–391. doi: 10.1016/j.cmet.2009.10.003. - DOI - PMC - PubMed

Publication types

MeSH terms