Randomized Controlled Trial
. 2022 Oct 19;13(1):6198.
doi: 10.1038/s41467-022-34054-6.

Reduced alcohol preference and intake after fecal transplant in patients with alcohol use disorder is transmissible to germ-free mice

Affiliations
Randomized Controlled Trial

Reduced alcohol preference and intake after fecal transplant in patients with alcohol use disorder is transmissible to germ-free mice

Jennifer T Wolstenholme et al. Nat Commun. .

Abstract

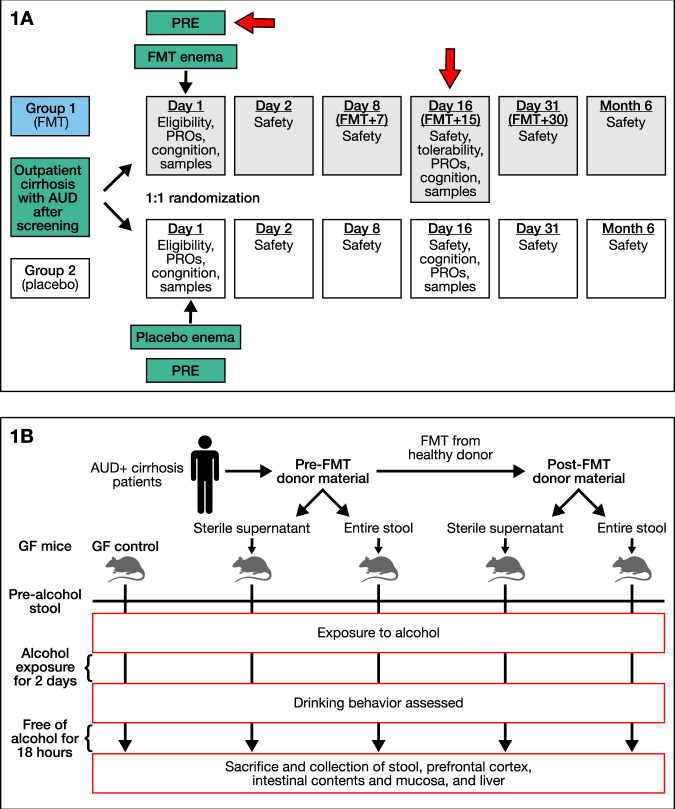
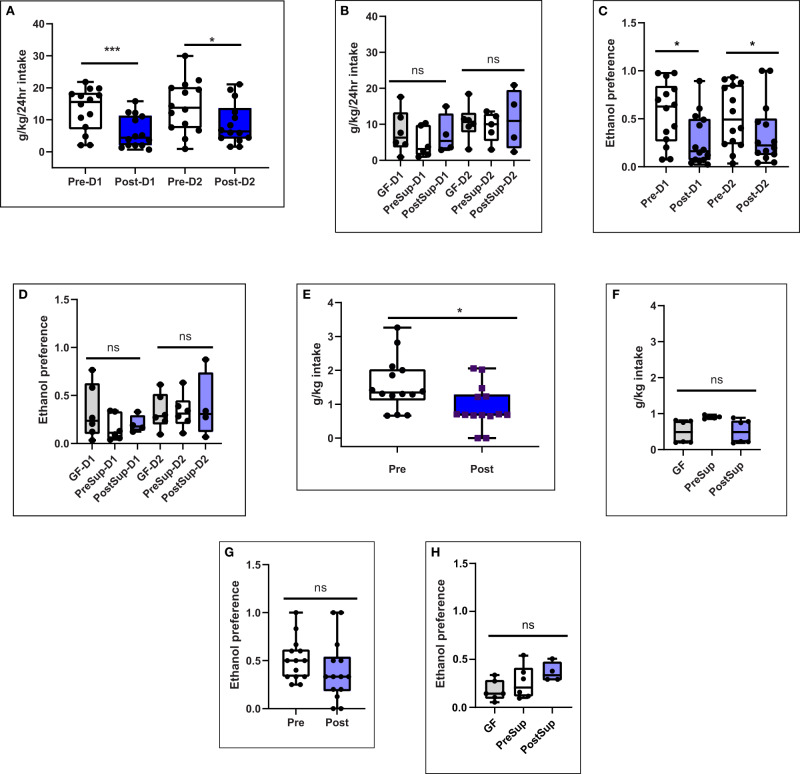
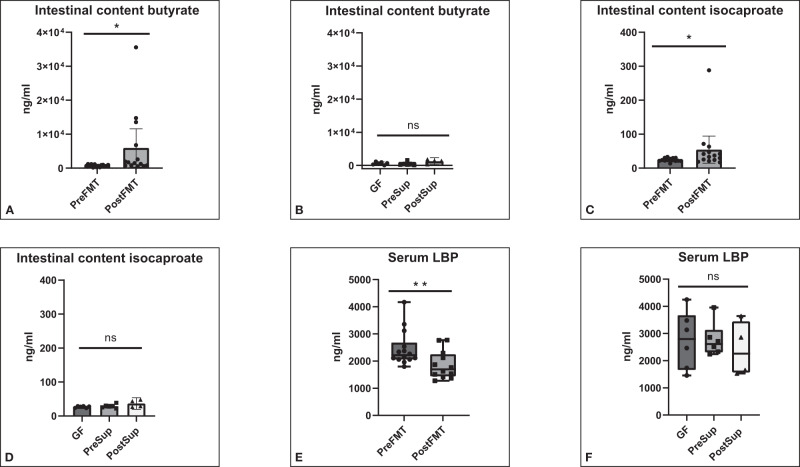
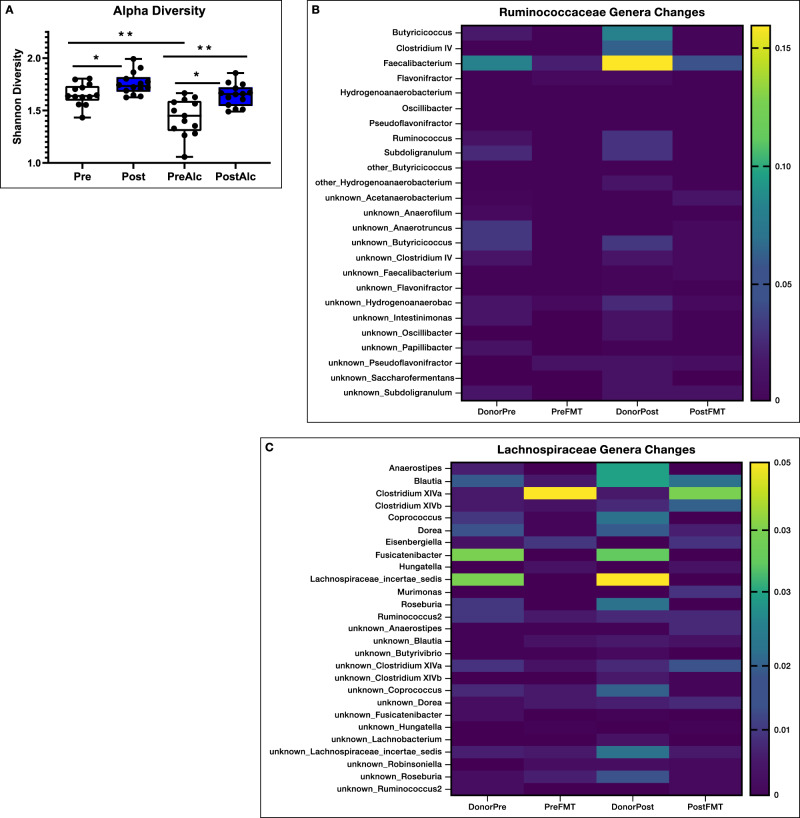
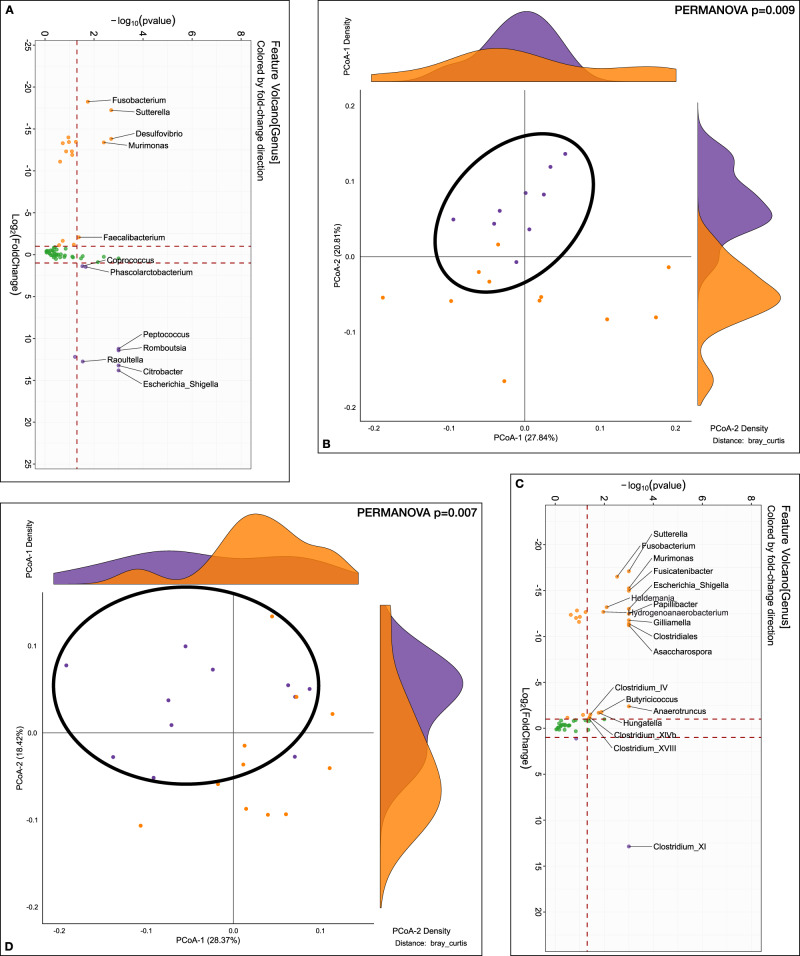
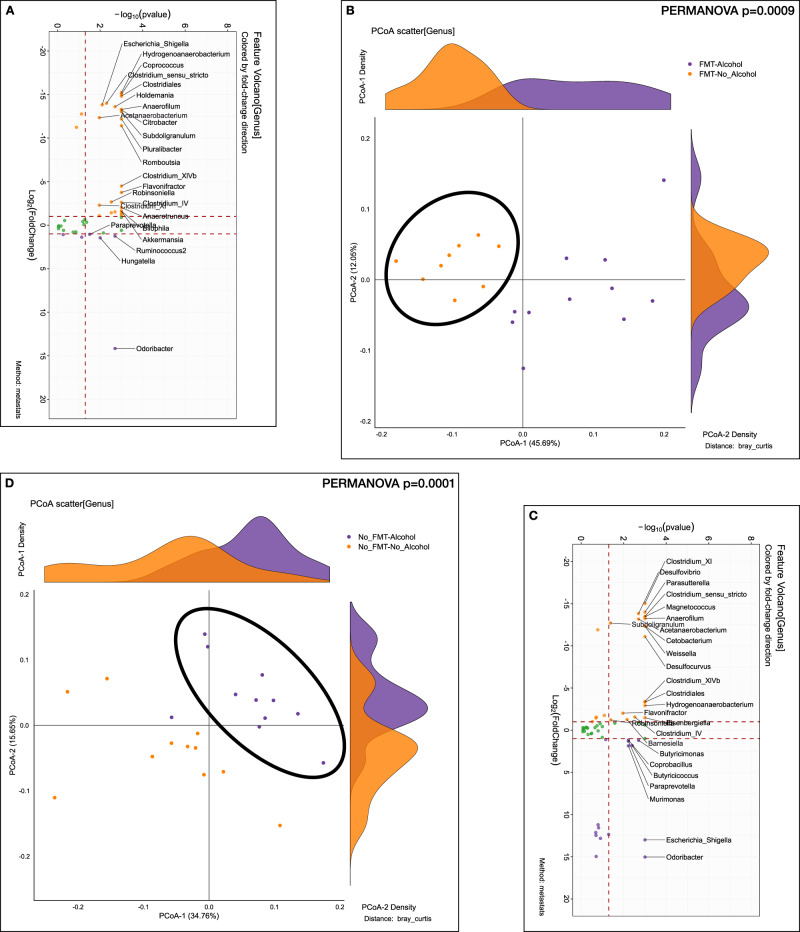
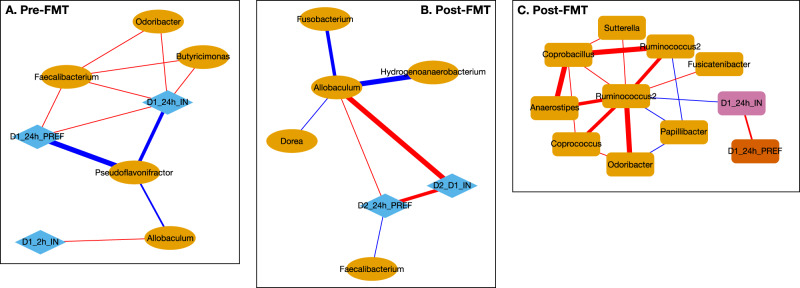
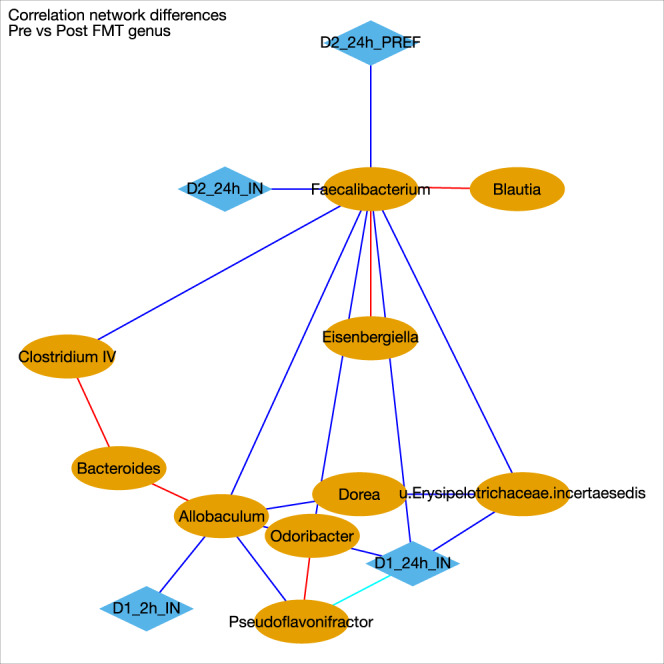
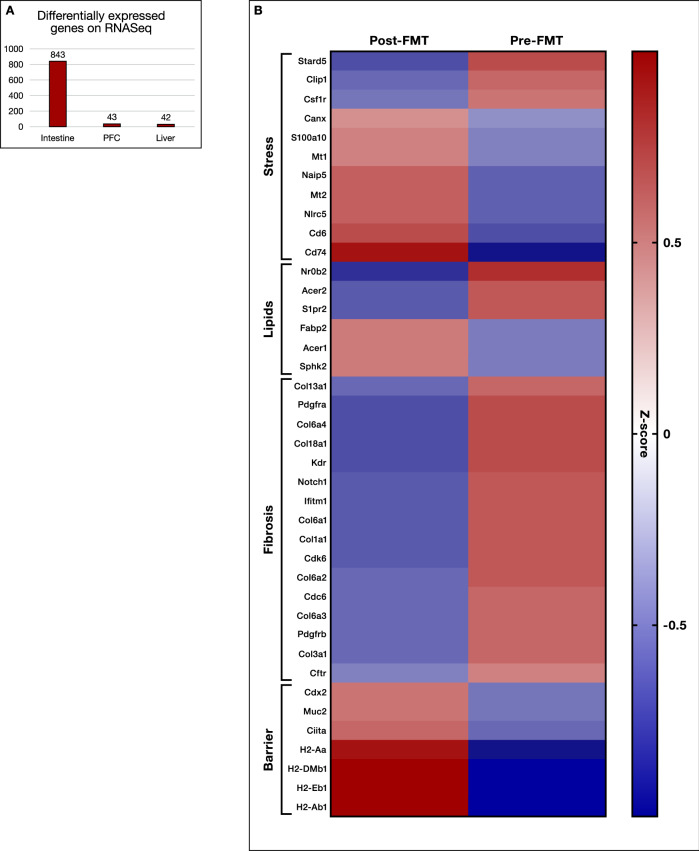
Alcohol use disorder is a major cause of morbidity, which requires newer treatment approaches. We previously showed in a randomized clinical trial that alcohol craving and consumption reduces after fecal transplantation. Here, to determine if this could be transmitted through microbial transfer, germ-free male C57BL/6 mice received stool or sterile supernatants collected from the trial participants pre-/post-fecal transplant. We found that mice colonized with post-fecal transplant stool but not supernatants reduced ethanol acceptance, intake and preference versus pre-fecal transplant colonized mice. Microbial taxa that were higher in post-fecal transplant humans were also associated with lower murine alcohol intake and preference. A majority of the differentially expressed genes (immune response, inflammation, oxidative stress response, and epithelial cell proliferation) occurred in the intestine rather than the liver and prefrontal cortex. These findings suggest a potential for therapeutically targeting gut microbiota and the microbial-intestinal interface to alter gut-liver-brain axis and reduce alcohol consumption in humans.


Conflict of interest statement

The authors declare no competing interests.

Figures

Fig. 1
Fig. 1. Study design.
A Human RCT design with red arrows at the timepoints stools from humans were collected for colonization into germ-free mice. B Animal experiment design from human to male germ-free C57BL/6J mouse stool transfer and sterile supernatant collection with stool collection pre and post-alcohol exposure with necropsy 18 h post-last alcohol exposure. A group of germ-free mice were also used as controls. N = 6–14 mice/group.
Fig. 2
Fig. 2. Alcohol Intake and preference is reduced in post-FMT male mice.
A, B 24-hour two-bottle choice alcohol intake for 20% ethanol or water on days 1 and 2. A Pre and post-FMT stool colonized mice (D1 comparison p = 0.0058, D2 comparison p = 0.035) using one-sided Mann–Whitney tests, B Germ-free mice and those colonized using sterile supernatants from pre and post-FMT mice were not significantly different using using one-sided Kruskal–Wallis tests. C Pre and post-FMT stool colonized mice, D Germ-free mice and those colonized using sterile supernatants from pre and post-FMT mice. EH Initial alcohol intake and preference measured during the 2-h initial binge on day 1. E Pre-FMT stool colonized mice had lower intake in the binge than post-FMT stool colonized mice (p = 0.03, Mann–Whitney test one-sided), F Germ-free mice and those colonized using sterile supernatants from pre and post-FMT mice were not significantly different on the binge, G Initial alcohol acceptance measured as a 2-h initial binge on day 1 was statistically similar across pre/post-FMT stool or H: between germ-free mice and those administered the supernatants.Pre Pre-FMT entire stool, Post Post-FMT entire stool, GF germ-free, PreSup GF supernatant Pre-FMT, PostSup GF supernatant Post-FMT, D1 day 1, D2 day 2. ***p < 0.001,*p < 0.05, NS not significant. Data presented as median, 95% CI (boxplot) with individual values and the entire range in the error bars. 14 mice per group for entire stool. 6 per group in GF, PreSup and 4 in PostSup experiments.
Fig. 3
Fig. 3. Intestinal contents SCFA (short-chain fatty acids) increased while serum LBP decreased with post-FMT stool colonization compared to pre-FMT.
A Butyrate after colonization with entire stool, B Butyrate in germ-free mice and those colonized using sterile supernatants from pre and post-FMT mice. C Isocaproate after colonization with entire stool, D Isocaproate in germ-free mice and those colonized using sterile supernatants from pre and post-FMT mice. Data presented as mean and 95% CI (boxplot) with individual values and the entire range in the error bars. E Serum lipopolysaccharide binding protein (LBP) reduced after colonization with entire stool in post-FMT vs pre-FMT (p = 0.0074 Mann–Whitney test), F Serum LBP in germ-free mice and those colonized using sterile supernatants from pre and post-FMT mice (p = 0.88 Kruskal–Wallis test). Data presented as median and 95% CI (boxplot) and individual values and the entire range in the error bars. Pre Pre-FMT entire stool, Post Post-FMT entire stool, GF germ-free, PreSup GF supernatant Pre-FMT, PostSup GF supernatant Post-FMT, D1 day 1, D2 day 2. ***p < 0.001,*p < 0.05, NS not significant. 14 mice per group for entire stool. 6 per group in GF, PreSup and 4 in PostSup experiments.
Fig. 4
Fig. 4. Stool microbial diversity and transmission of Lachnospiraceae and Ruminococcaceae constituents.
A Shannon diversity index of stool microbiota showed lower alpha-diversity in pre-FMT versus post-FMT even before alcohol exposure. Alcohol exposure further worsened this in both groups. Pre Pre-FMT but not exposed to alcohol, Post Post-FMT but not exposed to alcohol, PreAlc Pre-FMT after alcohol exposure, PostAlc Post-FMT after alcohol exposure, **p < 0.01, *p < 0.05, Mann–Whitney for unpaired and Wilcoxon signed rank test for paired analyses (before/after alcohol) one-sided. There were 14 mice per group. Data presented as median, 95% CI (boxplot) with individual values and the entire range in the error bars. B Ruminococcaceae and C Lachnospiraceae genera heatmap of average relative abundance from human donors pre and post to GF mice. DonorPre: combined stools from patients with cirrhosis who were actively drinking that were collected before the FMT from a healthy human, DonorPost combined stools from the same patients with cirrhosis in DonorPre collected 15 days after the FMT from a healthy human, Pre-FMT stools from germ-free mice colonized with stools from DonorPre, Post-FMT stools from germ-free mice colonized with stools from DonorPost. Higher relative abundance of several genera belonging to Ruminococcaceae and Lachnospiraceae in DonorPost vs DonorPre, which was reflected in their respective mouse recipients.
Fig. 5
Fig. 5. Stool microbiota analyses before and after alcohol preference experiment.
A, B Comparison between mouse recipients’ fecal samples at genus level before alcohol exposuret, Purple: Pre-FMT, Orange: Post-FMT. A log2fold changes Volcano plotted against the log10 p value differences between the pre-FMT (purple) and post-FMT (orange). B β-diversity analysis using Bray-Curtis distance on PCoA showing significant separation between groups (PERMANOVA, p = 0.009). C, D Comparison between mouse recipients’ fecal samples at genus level after alcohol preference experiment, Purple: Pre-FMT, Orange: Post-FMT. C log2fold changes Volcano plotted against the log10 p value differences showing greater abundance of genera post-FMT (orange). D β-diversity analysis using Bray-Curtis distance on PCoA showing significant separation between groups (PERMANOVA, p = 0.007).
Fig. 6
Fig. 6. Stool microbiota analyses within the Pre-FMT and within the Post-FMT group before/after alcohol preference.
A, B Comparison between mouse recipients’ fecal samples at the genus level before/after alcohol preference experiment within Pre-FMT. Purple: After alcohol, Orange: Before alcohol. A log2fold changes Volcano plotted against the log10 p value differences between the before alcohol (orange) and after alcohol (purple). B β-diversity analysis using Bray-Curtis distance on PCoA showing significant separation before/after alcohol preference (PERMANOVA, p = 0.0009). C, D Comparison between mouse recipients’ fecal samples at genus level before/after alcohol preference experiment within Post-FMT. Purple: After alcohol, Orange: Before alcohol. C log2fold changes Volcano plotted against the log10 p value differences between the before alcohol (orange) and after alcohol (purple). D β-diversity analysis using Bray-Curtis distance on PCoA showing significant separation before/after alcohol preference (PERMANOVA, p = 0.0001).
Fig. 7
Fig. 7. Correlation networks between alcohol intake and preference and stool microbial genera.
Red Edge: positive, Blue Edge: negative correlation, D1_2hI_IN: binge intake day 1, D1_24h_PREF: 24 h preference day 1, D1_24h_IN: day 1 intake, D2_24h_PREF: 24 h preference day 2, D2_D1_IN: total intake, Pink nodes are microbial genera. Pre-FMT are mice colonized with stool from donors before FMT, while post-FMT are the separate group of mice colonized with stool from donors after healthy human FMT. A Pre-FMT stool colonized mice correlation network with Faecalibacterium and Day 1 preference and intake. B Post- FMT stool colonized mice network with Faecalibacterium and Allobaculum for Day 2 intake and preference. C Post-FMT network with Ruminococcus Day 1 preference and intake.
Fig. 8
Fig. 8. Correlation Differences in mice after colonization.
Blue: shift from positive to negative (Pre-FMT to post-FMT), Red: shift negative to positive(Pre-FMT to post-FMT), Cyan: loss in negative correlation from Pre-FMT to post-FMT, which means post-FMT the negative correlation between the 2 nodes that was present pre-FMT is now not present. Pink nodes are microbial genera. D1_2hI_IN: binge intake day 1, D1_24h_IN: 24 hour preference day 1, D2_24h_IN: day 2 intake, D2_24h_PREF: 24 h preference day 2, Pink nodes are microbial genera.
Fig. 9
Fig. 9. Differentially Expressed Genes (DEGs)on Tissue RNA-Seq.
A Number of DEGs between pre and post-FMT mice were highest in small intestine compared to liver or prefrontal cortex (PFC). B Heatmap of relevant small intestinal genes differentially expressed between pre and post-FMT colonized mice exposed to alcohol arranged according to the functional group.

References

    1. Yoon YH, Chen CM, Slater ME, Jung MK, White AM. Trends in premature deaths from alcoholic liver disease in the U.S., 1999-2018. Am. J. Prev. Med. 2020;59:469–480. doi: 10.1016/j.amepre.2020.04.024. - DOI - PMC - PubMed
    1. Pollard MS, Tucker JS, Green HD., Jr. Changes in adult alcohol use and consequences during the COVID-19 pandemic in the US. JAMA Netw. Open. 2020;3:e2022942. doi: 10.1001/jamanetworkopen.2020.22942. - DOI - PMC - PubMed
    1. Crabb DW, Im GY, Szabo G, Mellinger JL, Lucey MR. Diagnosis and treatment of alcohol-associated liver diseases: 2019 practice guidance from the American Association for the study of liver diseases. Hepatology. 2020;71:306–333. doi: 10.1002/hep.30866. - DOI - PubMed
    1. Bajaj JS, et al. Altered profile of human gut microbiome is associated with cirrhosis and its complications. J. Hepatol. 2014;60:940–947. doi: 10.1016/j.jhep.2013.12.019. - DOI - PMC - PubMed
    1. Bajaj JS, et al. Continued alcohol misuse in human cirrhosis is associated with an impaired gut-liver axis. Alcohol Clin. Exp. Res. 2017;41:1857–1865. doi: 10.1111/acer.13498. - DOI - PubMed

Publication types