. 2022 Oct 19;13(1):6204.
doi: 10.1038/s41467-022-33906-5.

Host genetic factors related to innate immunity, environmental sensing and cellular functions are associated with human skin microbiota

Affiliations

Host genetic factors related to innate immunity, environmental sensing and cellular functions are associated with human skin microbiota

Lucas Moitinho-Silva et al. Nat Commun. .

Abstract

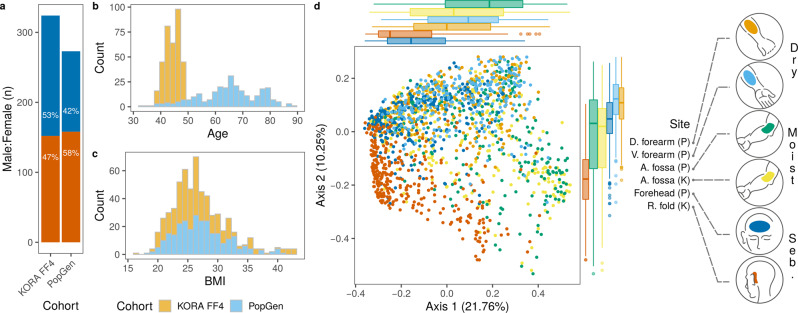
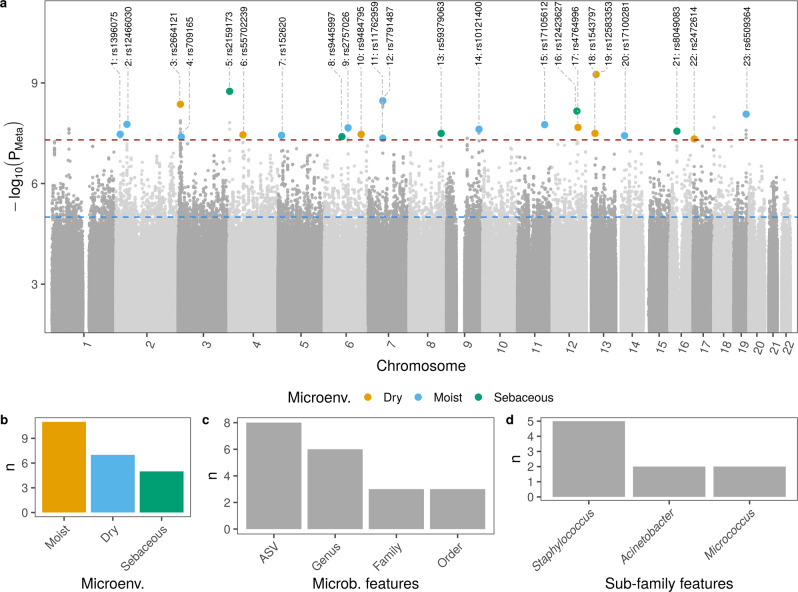
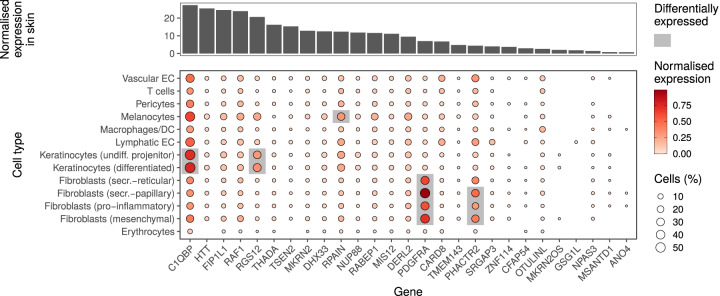
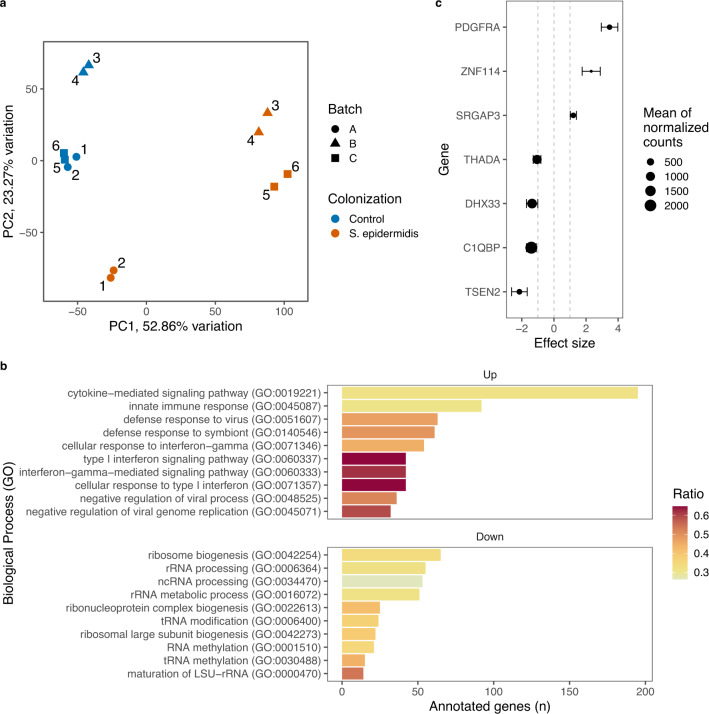
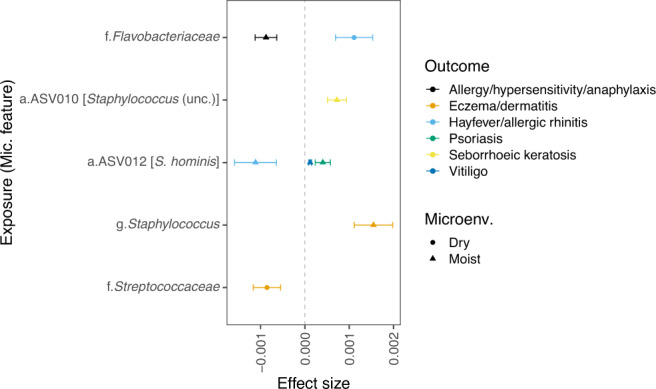
Despite the increasing knowledge about factors shaping the human microbiome, the host genetic factors that modulate the skin-microbiome interactions are still largely understudied. This contrasts with recent efforts to characterize host genes that influence the gut microbiota. Here, we investigated the effect of genetics on skin microbiota across three different skin microenvironments through meta-analyses of genome-wide association studies (GWAS) of two population-based German cohorts. We identified 23 genome-wide significant loci harboring 30 candidate genes involved in innate immune signaling, environmental sensing, cell differentiation, proliferation and fibroblast activity. However, no locus passed the strict threshold for study-wide significance (P < 6.3 × 10⁻¹⁰ for 80 features included in the analysis). Mendelian randomization (MR) analysis indicated the influence of staphylococci on eczema/dermatitis and suggested modulating effects of the microbiota on other skin diseases. Finally, transcriptional profiles of keratinocytes significantly changed after in vitro co-culturing with Staphylococcus epidermidis, chosen as a representative of skin commensals. Seven candidate genes from the GWAS were found overlapping with differential expression in the co-culturing experiments, warranting further research of the skin commensal and host genetic makeup interaction.


Conflict of interest statement

The authors declare no competing interests.

Figures

Fig. 1
Fig. 1. Characteristics of KORA FF4 and PopGen cohorts.
a Female (orange) and male (blue) composition of cohorts. b age and, c body mass index (BMI) distribution in cohorts. d ordination of skin microbiome profiles based on Bray-Curtis dissimilarity and principal coordinates analysis. Samples (n = 1,656) were colored by the skin site and represent dry [dorsal (D.) forearm (n = 260) and volar (V.) forearm (n = 251)], moist [antecubital (A.) fossa (n = 318 in KORA FF4, n = 258 in PopGen)] and sebaceous [seb.; forehead (n = 252) and retroauricular (R.) fold (n = 317)] microenvironments. Cohort names were abbreviated, PopGen (P) and KORA FF4 (K). Marginal boxplots are shown to visualize sample distributions along axes. The boxplot area represents the interquartile range (IQR) divided by the median. Lines extend to a maximum of 1.5 × IQR beyond the area. Points are outliers. Percentage of variation explained by each axis is shown in parentheses.
Fig. 2
Fig. 2. Results from the GWAS.
a Manhattan plot of per skin microenvironment meta-analysis. Lowest P value of each position is shown and identified by locus ID and rsID. Meta-analysis P values were obtained using the software METAL and METASOFT or by combining P values from data sets that originated from dry skin sites, see Methods. Significant positions are colored according to skin microenvironment and listed, where leading genetic variant, protein coding genes selected by fine-mapping as containing possible causal variants and microbial features are reported. Table 1 contains the list of loci characteristics and genes. b Count of significantly associated loci per microenvironment. c Level of microbial features with highest number of significant associations. d Sub-family features with the highest number of significant associations.
Fig. 3
Fig. 3. Expression of human genes associated with the skin microbiome in public databases.
Candidate protein coding genes were selected by GWAS in skin. Upper panel shows the normalized transcriptional expression of genes in skin tissue. Data are from Human Protein Atlas version 20.1, which additionally includes data sets from the GTEx and the Functional annotation of the mammalian genome (FANTOM5) projects. Bottom panel shows candidate gene expression in different skin cell types. Single-cell expression was normalized by cell type. Genes differently expressed in each cell type in comparison with the others are highlighted. Displayed log-normalized gene expression data and differential expression analyses are retrieved from Solé-Boldo et al.. Candidate genes were mapped by gene symbol.
Fig. 4
Fig. 4. GWAS genes expressed by keratinocytes co-cultured with Staphylococcus epidermidis.
a Bacteria were added to two-dimension keratinocyte cultures, which were cultivated in six replicates, two per weekly batch. First and second dimensions of principal component analysis of gene expression after variance stabilizing transformation (vst) are shown. Differential expression analysis was performed to compare the expression of keratinocyte genes in culture with and without S. epidermidis. b Enrichment of biological processes mapped to Gene Ontology (GO) was performed on differentially expressed genes [q < 0.05 (derived from Wald test on negative binomial generalized linear models) and absolute logarithmic (log2) fold change >1]. Top ten lowest adjusted P values (Fisher exact test) of each up and down regulated processes are shown, ordered by number of detected genes. Large subunit ribosomal ribonucleic acid (LSU-rRNA), transfer RNA (tRNA) and noncoding RNA (ncRNA) are abbreviated. c Change in the transcription of GWAS selected genes which were differentially expressed are shown. Approximate posterior estimation for generalized linear model (apeglm) shrinkage was applied to effect size (log2 fold change). Error bars represent posterior standard deviation.
Fig. 5
Fig. 5. Results from Mendelian Randomization analysis.
All exposure-to-outcome pairs with qtrait) <0.05 in the inverse-variance weighted 2-sample MR are shown. Error bars represent standard error. Microbial features are prefixed with their level, amplicon variant sequence (a.), genus (g.) and family (f.). Additional details and sensitive analyses can be found in Supplementary Data 5.

References

    1. Zhernakova A, et al. Population-based metagenomics analysis reveals markers for gut microbiome composition and diversity. Science. 2016;352:565–569. doi: 10.1126/science.aad3369. - DOI - PMC - PubMed
    1. Falony G, et al. Population-level analysis of gut microbiome variation. Science. 2016;352:560–564. doi: 10.1126/science.aad3503. - DOI - PubMed
    1. Moitinho-Silva, L. et al. Host traits, lifestyle and environment are associated with the human skin bacteria. Br J Dermatol, 10.1111/bjd.20072 (2021). - PubMed
    1. Si J, Lee S, Park JM, Sung J, Ko G. Genetic associations and shared environmental effects on the skin microbiome of Korean twins. BMC Genomics. 2015;16:992. doi: 10.1186/s12864-015-2131-y. - DOI - PMC - PubMed
    1. Baurecht H, et al. Epidermal lipid composition, barrier integrity, and eczematous inflammation are associated with skin microbiome configuration. J. Allergy Clin. Immunol. 2018;141:1668–1676.e1616. doi: 10.1016/j.jaci.2018.01.019. - DOI - PubMed

Publication types

LinkOut - more resources