. 2022 Nov;611(7934):124-132.
doi: 10.1038/s41586-022-05328-2. Epub 2022 Oct 19.

Behavioural and dopaminergic signatures of resilience

Affiliations

Behavioural and dopaminergic signatures of resilience

Lindsay Willmore et al. Nature. 2022 Nov.

Abstract

Chronic stress can have lasting adverse consequences in some individuals, yet others are resilient to the same stressor1,2. Susceptible and resilient individuals exhibit differences in the intrinsic properties of mesolimbic dopamine (DA) neurons after the stressful experience is over3-8. However, the causal links between DA, behaviour during stress and individual differences in resilience are unknown. Here we recorded behaviour in mice simultaneously with DA neuron activity in projections to the nucleus accumbens (NAc) (which signals reward9-12) and the tail striatum (TS) (which signals threat13-16) during social defeat. Supervised and unsupervised behavioural quantification revealed that during stress, resilient and susceptible mice use different behavioural strategies and have distinct activity patterns in DA terminals in the NAc (but not the TS). Neurally, resilient mice have greater activity near the aggressor, including at the onset of fighting back. Conversely, susceptible mice have greater activity at the offset of attacks and onset of fleeing. We also performed optogenetic stimulation of NAc-projecting DA neurons in open loop (randomly timed) during defeat or timed to specific behaviours using real-time behavioural classification. Both open-loop and fighting-back-timed activation promoted resilience and reorganized behaviour during defeat towards resilience-associated patterns. Together, these data provide a link between DA neural activity, resilience and resilience-associated behaviour during the experience of stress.


Conflict of interest statement

Competing interests The authors declare no competing interests.

Figures

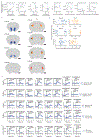
Extended Data Fig. 1 |
Extended Data Fig. 1 |. Pretests do not predict susceptibility while additional post-hoc tests confirm resilient and susceptible phenotypes.
a, Timeline of behaviors for mice undergoing behavioral and neural recordings across chronic social defeat stress. b, In the social interaction test, social interaction ratio and time (N = 22 controls, 13 susceptible, 19 resilient males in bk; 1-way ANOVA for social interaction ratio with mouse category as factors, F(51,2) = 7.015, p = 0.002, t-Test control vs susceptible p = 0.001, resilient vs susceptible p = 0.009, control vs resilient p = 0.646; 1-way ANOVA for social interaction social interaction time with mouse category as factors, F(51,2) = 42.9, p = 1.18E-11, t-Test control vs susceptible p = 1.6E-9, resilient vs susceptible p = 1.6E-9, control vs resilient p = 0.9). In social interaction test, object interaction ratio and time (1-way ANOVA object interaction ratio with mouse category as factors, F(51,2) = 9.442, p = 3.3E-4; t-Test control vs susceptible p = 0.003, resilient vs susceptible p = 0.001, control vs resilient p = 0.5; 1-way ANOVA for object interaction time with mouse category as factors, F(51,2) = 27.26, p = 8.86E-9; t-test control vs susceptible p = 0.003, resilient vs susceptible p = 0.001, control vs resilient p = 0.6). c, Fraction of sucrose over total volume consumed in a 2-bottle sucrose preference test (1-way ANOVA for sucrose preference with mouse category as factors, F(51,2) = 3.21, p = 0.048; t-Test control vs susceptible p = 0.039, resilient vs susceptible p = 0.024, control vs resilient p = 0.9). d, Relationship between sucrose preference and SI time (2-sided pearson correlation coefficient R = 0.29, p = 0.03). e, Change in weight across defeat (top), absolute weight (bottom), mean±SEM plotted (t-test for difference of means between resilient vs. susceptible and resilient vs. control groups, green stars indicate resilient vs susceptible and black indicate resilient vs control significance, see Supplementary Table 1 for statistical values). f, Relationship between SI time and the change in weight during defeat (2-sided GEE, grouped by mouse, Z = 2.01, p = 0.045). g, Number of crossings between chambers of a 2-chamber arena (1-way ANOVA for crossings with stimulation groups as factors, F(51,2) = 5.77 p = 0.006; post-hoc t-Test susceptible vs control p = 0.011 and resilient vs control p = 0.008). h, Percent of time immobile (speed < 1 cm/s) during exploration of a 2-chamber arena (1-way ANOVA for crossings with stimulation groups as factors, F(51,2) = 3.16 p = 0.05; post-hoc t-Test susceptible vs control p = 0.032 and resilient vs control p = 0.071). i, Schematic of tube test for social hierarchy (top), example of tube test wins for a homecage of mice (colored by individual) measured across 7 days. j, No relationship between dominance (percentage of wins in the last 3 days of the tube test) and social interaction time in the social interaction test (N = 22 controls, 13 susceptible, 19 resilient; 2-sided Pearson’s correlation coefficient R = −0.038, p = 0.78). k, Summary of j (1-way ANOVA for social interaction social interaction time with mouse category as factors, F(51,2) = 0.342, p = 0.712). l, Time spent in proximity with a male of the same strain (C57/BL6), in a freely moving environment (2-way mixed ANOVA with resilience group and time point as factors: group x time F(64,2) = 0.319, p = 0.728) m, Time spent in proximity with a female of the same strain (C57), in a freely moving environment. (2-way mixed ANOVA with resilience group and time point as factors: group x time F(64,2) = 0.189, p = 0.828) n, Difference in time spent with a male or female social target after vs before defeat, mean±SEM plotted. N = 11 control, 8 susceptible, and 16 resilient males in ln. Across panels, *p < 0.05, **p < 0.01, ***p < 0.001.
Extended Data Fig. 2 |
Extended Data Fig. 2 |. Evolution of defeat behaviors across defeat days.
Amount of time spent in classified behaviors across days, mean±SEM plotted (2-sided GEE for time attacked: effect of resilience group Z = 0.23, p = 0.76, effect of day Z = −0.613, p = 0.54; 2-sided GEE for time investigated Z = −0.43, p = 0.66, effect of day Z = 4.01, p = 6.2E-5; 2-sided GEE for fighting while attacked: effect of resilience group Z = 2.09, p = 0.037, effect of day Z = 0.02, p = 0.98, 2-sided GEE for fleeing while attacked: effect of resilience group Z = −1.48, p = 0.14, effect of day t = 1.76, p = 0.078, N = 19 resilient and 13 susceptible mice. *** indicates p < 0.001).
Extended Data Fig. 3 |
Extended Data Fig. 3 |. t-SNE clusters of social postures represent discrete behaviors, some of which are preferentially occupied by resilient or susceptible mice.
a, Average raw feature value within each t-SNE cluster (scale in the full range of each variable, Str: Stressed mouse, Agg: Aggressor mouse). b, Average t-SNE cluster occupancies for each individual, split by susceptible and resilient groups (2-sample, 2-sided T-test *p < 0.05; 2-sample Levene Test p< 0.05, N = 13 susceptible males and 19 resilient, see Supplementary Table 1 for statistical values). c, Density of behaviors annotated with supervised classifiers within t-SNE space, bold font indicating clusters that differentiate resilient and susceptible mice (Fig. 1o–r).
Extended Data Fig. 4 |
Extended Data Fig. 4 |. Behavioral and physiological differences across defeated females.
a, Distribution of social interaction (SI) times in the post-hoc SI test (see Fig. 1b) in unstressed control and stressed females split into resilient and susceptible groups (N = 4 controls, 4 susceptible, 4 resilient females, mean±SEM plotted). b, Change in weight across defeat by females in control, resilient, or susceptible groups, mean±SEM plotted. c, Fraction of sucrose over total volume consumed in a 2-bottle sucrose preference test, mean±SEM plotted. d, Number of entries into the open arms of an elevated plus maze, mean±SEM plotted. e, Time to consume a yogurt treat in novelty suppressed feeding assay, mean±SEM plotted. f, Time spent by individual mice in each behavior of interest (2-sided GEE: being attacked p = 0.76; being investigated p = 0.26; fighting while attacked, p = 0.16; fleeing while attacked p = 0.20; means plotted with 30th to 70th percentile error bands across the 10 defeat days; N.S., not significant). g, Difference in time males and females spent fighting back while attacked during defeat (2-sample t-Test, t = −7.45, p = 6.2E-9, N = 32 males, 8 females, mean±SEM plotted, ***p < 0.001).
Extended Data Fig. 5 |
Extended Data Fig. 5 |. Simultaneous fast scan cyclic voltammetry and fiber photometry calcium recordings in the TS.
a, Schematic for recording dopamine release and calcium fluorescence in the tail of the striatum (TS). b, Example 3-D color plot from a single recording site, where the medial forebrain bundle (MFB) was stimulated with 24 pulses at 60 Hz at time 0 (average of 5 trials shown). Inset shows the voltammogram at 0.5s after stimulation (white dotted line in color plot), which shows oxidation and reduction peaks consistent with the profile of dopamine. c, Time course of simultaneously measured calcium fluorescence and dopamine current (average over the same 5 trials shown in b). d, Calcium fluorescence and dopamine concentration peaks increase together with the number of pulses of stimulation delivered to the MFB (mean±SEM plotted, N = 6 recording sites). VTA-NAc data obtained with permission from Parker et al 2016 (N = 4 recording sites).
Extended Data Fig. 6 |
Extended Data Fig. 6 |. DAT∷GCaMP6f responses to air puff, food reward, and defeat are similar in males and females.
a, In males, DAT∷GCaMP6f aligned to air puff onset, averaged within and across mice (N = 19 males, paired t-Test for average activity after vs before puff, TS: t = 4.61, p = 2.2E-4; NAc: t = −3.1, p = 0.0062). b, Same as a but in females (N = 12 females, paired t-Test for average activity after vs before puff, TS: t = 3.05, p = 0.011; NAc: t = −1.2, p = 0.25). c, In males, DAT∷GCaMP6f aligned to palatable food reward approach, averaged within and across mice (N = 18 males, paired t-Test for average activity after vs before approach, TS: t = 1.63, p = 0.12; NAc: t = 4.31, p = 4.7E-4). d, Same as c but in females (N = 11 females, paired t-Test for average activity after vs before approach, TS: t = 1.74, p = 0.11; NAc: t = 6.67, p = 5.6E-5). e, Average proximity onset- and offset-aligned TS(DAT∷GCaMP6f) across stressed males (top) and females (bottom). f, TS(DAT∷GCaMP6f) in the 0.5s at the onset or offset of social encounters (gray shaded zones in e) in males (top) and females (bottom) from resilient and susceptible groups across the 10 days of defeat. Solid line shows mean across mice and shaded region shows standard error. (2-sided GEE regression for male onset activity: main effect of day Z = 5.71, p = 1.1E-8; resilience Z = −0.83, p = 0.407; 2-sided GEE regression for male offset activity: main effect of day Z = 0.45, p = 0.65; resilience Z = 0.107, p = 0.917; 2-sided GEE regression for female onset activity: main effect of day Z = 0.673, p = 0.501; resilience Z = −1.912, p = 0.054; 2-sided GEE regression for female offset activity: main effect of day Z = −1.07, p = 0.28; resilience Z = 3.033, p = 0.003; interaction between day and resilience Z = 2.326, p = 0.02). g, Same as e for NAc(DAT∷GCaMP6f). h, Same as f for NAc(DAT∷GCaMP6f) (2-sided GEE regression for male onset activity: main effect of day Z = −1.328, p = 0.184; resilience Z = 1.98, p = 0.048; 2-sided GEE regression for male offset activity: main effect of day Z = 4.966, p = 6.8E-7; resilience Z = −2.06, p = 0.040; 2-sided GEE regression for female onset activity: main effect of day Z = 1.369, p = 0.171; resilience Z = 1.369, p = 0.402; 2-sided GEE regression for female offset activity: main effect of day Z = −0.074, p = 0.941; resilience Z = −1.29, p = 0.199). Across panels, *p < 0.05, **p < 0.01, ***p < 0.001.
Extended Data Fig. 7 |
Extended Data Fig. 7 |. In males and females, relationships DAT∷GCaMP6f and social zone or object zone entry or exit during the SI test.
a, Same data as in Fig. 2i, separated by male (left, N = 17) and female mice (right, N = 7). (2-sided pearson correlations between GCaMP and social interaction test social interaction (SI) time: Male entry R = 0.53, p = 0.03; male exit R = −0.15, p = 0.57; female entry R = 0.51, p = 0.24; female exit R = −0.73, p = 0.06). b, Average social interaction zone entry- and exit-aligned TS(DAT∷GCaMP6f) across stressed animals (mean plotted with standard error, N = 6 susceptible males, 4 susceptible females, 10 resilient males, 3 resilient females in bg). c, Relationship between individuals’ SI time and average TS(DAT∷GCaMP6f) in the 1s after entry into the social interaction zone (left, 2-sided pearson correlation, R = −0.32 p = 0.13) and in the 1s after exit from the social interaction zone (right, 2-sided pearson correlation, R = 0.25, p = 0.23). d, Average object zone entry- and exit-aligned TS(DAT∷GCaMP6f) across stressed animals. e, Relationship between individuals’ SI test interaction time and average TS(DAT∷GCaMP6f) in the 1s after entry into and exit from the object interaction zone (entry: 2-sided earson correlation, R = 0.06 p = 0.8; exit: 2-sided pearson correlation, R = 0.34, p = 0.107). f, Same as in d for NAc(DAT∷GCaMP6f). g, Relationship between individuals’ SI test interaction time and average NAc(DAT∷GCaMP6f) in the 1s surrounding entry into and exit from the object interaction zone (entry: 2-sided pearson correlation, R = 0.15 p = 0.47; exit: 2-sided pearson correlation, R = 0.15, p = 0.47). In b,d,f: mean±SEM plotted.
Extended Data Fig. 8 |
Extended Data Fig. 8 |. Fiber location for photometry recording and behavior encoding by the TS does not predict resilience in males.
a, Relationship between average time spent engaging in each behavior and kernel weight for NAc(DAT∷GCaMP6f) encoded by corresponding behavioral events (2-sided pearson correlation, *p < 0.05, N = 19 males, purple designating resilient animals, green showing susceptible, see Supplementary Table 1 for statistical values). b, Anatomical locations of photometry fiber tips targeted to the nucleus accumbens (NAc) and tail of the striatum (TS), overlaid on regions defined by the Paxinos Atlas (scale bar 1mm, Paxinos splits TS into subregions of the caudal caudoputamen). Animals omitted on the basis of poor signal shown in red, or omitted on the basis of poor targeting shown in magenta, included animals shown in black. c, Lack of relationship between location of recording fiber tips and SI time. d, Average kernel weights for behaviors encoding NAc(DAT∷GCaMP6f) in mice grouped by fiber location in the NAc (p-values shown for 2-sided t-test for difference in means in average activity from 0.5 to 1.5s following the behavior event, see Supplementary Table 1 for statistical values). e, Average kernel weights for behaviors encoding TS (DAT∷GCaMP6f) in mice grouped by susceptibility (p-values shown for 2-sided t-test for difference in means in average activity from 0.5 to 1.5s following the behavior event, N = 7 susceptible (green) and 12 resilient (purple) mice, see Supplementary Table 1 for statistical values). Across panels, *p < 0.05, **p < 0.01.
Extended Data Fig. 9 |
Extended Data Fig. 9 |. Additional characterization of optogenetic manipulation of DA neural activity during defeat.
a, Arena schematic and example stimulation session trace from a 2-chamber real-time place preference assay. 20-Hz laser stimulation was delivered whenever a mouse’s centroid was in the “laser side” of the chamber, sides counterbalanced across mice (top). Preference for the laser-stimulation side of a chamber in mice expressing or not expressing excitatory opsin. No stimulation was delivered in the baseline condition (bottom). b, Animals receiving fight-back-triggered optogenetic activation expressed either ChRmine or ChR2 and were delivered 20 Hz laser stimulation with the following parameters: ChRmine mice received green laser stimulation in sets of 3 pulses without pause for the duration of fighting bouts while ChR2 mice received blue laser stimulation in sets of 10 pulses with a 0.5s pause between pulse sets for the duration of fighting bouts. c, Example of a defeat session with laser light delivery triggered on fighting of the closed-loop mouse and simultaneously delivered to his open-loop neighbor, bottom inset is a 10s segment. d, Statistics across fight-back-triggered stimulation: Distribution of latency to trigger stimulation from capture of a fighting video frame, with a median of 100ms (left). Distribution of durations of stimulation bouts, 94% of which were less than 1s (middle). Distribution of the amount of defeat time in which light was delivered (mean is 2.99% of the defeat session) (right). e, Attack-offset aligned laser stimulation during escape-triggered activation. f, In escape-triggered activation, distribution of the amount of defeat time in which light was delivered (mean is 0.75% of the defeat session). g, Time spent in random forest labeled fighting behavior early (days 1,2) versus late (days 9,10) in defeat, mean±SEM plotted. (Paired 2-sided t-Tests: 2-way FDR corrected: open-loop t = 0.38 p = 0.71, no opsin t = −0.41 p = 0.71; 2-way FDR corrected: escape-triggered t = −2.33 p = 0.10, no opsin t = −1.14 p = 0.34). h, Average expression of random forest labeled fleeing behavior early (days 1,2) versus late (days 9,10) in defeat, mean±SEM plotted. (Paired 2-sided t-Tests: 3-way FDR corrected: open-loop t = 1.12 p = 0.42, fight-triggered t = −0.29 p = 0.78, no opsin t = −1.49 p = 0.42). i, Percent of time immobile (speed < 1 cm/s) during exploration of a 2-chamber arena (2-sided t-Test, difference in mean immobility between open-loop (N = 14 males) and no opsin control (N = 14 males) group, mean±SEM plotted: t = −1.57, p = 0.12). j, Same as i for fight-back-triggered (N = 16 males) and no opsin (N = 14 males) controls, mean±SEM plotted (2-sided t-Test, t = −3.05, p = 0.005). k, Same as i for escape-triggered (N = 8 males) and control (N = 4 males) groups, mean±SEM plotted (2-sided t-Test, t = −0.80, p = 0.39). l, Schematic of inhibition of dopaminergic cell bodies in the VTA (Dio-NpHR injection and fiber implant over the VTA of DAT∷Cre males). m, Real-time place aversion assay, with constant 7 mW green light delivery on the stimulation side of the chamber. Preference for the non-stimulation side of a chamber in mice expressing or not expressing inhibitory opsin, mean±SEM plotted. No stimulation was delivered in the baseline condition. n, Schematic for closed-loop, attack-triggered inhibition during defeat. o, In attack-triggered inhibition, distribution of the amount of defeat time in which light was delivered (mean is 7.93% of the defeat session). p, Density map of where in t-SNE behavior space animals were when receiving inhibition. q, Difference in occupancy of t-SNE clusters between inhibition (N = 12 males) and no opsin control (N = 10 males) groups (same mice in rx), measured by individual clusters’ chi2 statistics; black bold numbers label behaviors differentially expressed by resilient and susceptible mice in our observational study. r, Average time across 10 days of defeat being attacked (2-sided -Test, attack-triggered inhibition vs no opsin control, t = −3.03, p = 0.0066). s, Average time across 10 days of defeat fleeing (t = −3.92, p = 8.5E-4). t, Social interaction (SI) time in the SI test (2-sided t-Test, difference in SI time between inhibition and no opsin control groups: 2-sided t-Test, t = 0.04, p = 0.96). u, Average distance between stressed and aggressor mice during the first 5 min of the barrier-separated sensory period across the 10 days of defeat (2-sided Levene test for difference in variance, W = 4.92, p = 0.038). v, Number of entries into the open arms of an elevated plus maze (2-sided t-Test, difference in mean entries between inhibition and no opsin control, t = −0.64, p = 0.53). w, Number of crossings between chambers of 2-chamber arena (2-sided t-Test, difference in mean crossings between inhibition and no opsin control groups: t = −0.024, p = 0.98). x, Percent of time immobile (speed < 1 cm/s) during exploration of a 2-chamber arena (2-sided t-Test, difference in mean immobility between inhibition and no opsin control groups: t = −0.47, p = 0.64). In rx, mean±SEM plotted. Across panels, *p < 0.05, **p < 0.01, ***p < 0.001.
Extended Data Fig. 10 |
Extended Data Fig. 10 |. Difference in NAc(DAT∷GCaMP6f) after versus during direct contact phase of defeat is higher in susceptible compared to resilient individuals.
a, Schematic showing phases of defeat stress during and after direct contact. b, Example traces of NAc(DAT∷GCaMP6f) during (left) and after (right) the direct contact phase of defeat from day 10 in an example resilient mouse (top) and susceptible mouse (bottom). Transients represented by red dots. Area under the curve (AOC) in next panels refers to the integral between the half max surrounding each transient. c, Difference in NAc (DAT∷GCaMP6f) after vs during the contact phase of defeat, mean±SEM plotted (Mixed linear model for difference in AOC by day, resilience category, and their interaction; interaction effect N = 19 males, Z = −2.037, p = 0.042; 2-sided t-Test for difference in ratio of activity in susceptible vs resilient individuals, day 8: t = −3.607, p = 0.02 after Bonferroni correction for 10 tests across 10 days, *p < 0.05). d, Difference in TS(DAT∷GCaMP6f) after vs during the direct contact phase of defeat, mean±SEM plotted (Mixed linear model for difference in AOC by day, resilience category, and their interaction; no significant effects).
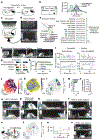
Fig. 1 |
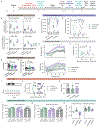
Fig. 1 |. Resilience and susceptibility can be associated with different behaviour profiles during defeat.
a, Schematic of the chronic social defeat experiment. b, Left, Schematic of the social interaction (SI) test. Right, The distribution of SI times in unstressed control mice (N = 22) and in resilient (N = 19) and susceptible (N = 13) stressed mice. c, Schematic of side and top-down views of defeat, recorded by one camera. d, Video frame with body-part tracking. e, Left, Subset of postural features (mice created with BioRender. com). Right, All 12 features for supervised (fi) and unsupervised (jr) behaviour quantification. f, Video frames of behaviours of interest. g, Manual (Hand) annotation and binary random forest (RF) classification of behaviours. h, Behaviour classification accuracy. i, Relationship between time in behaviours of interest and SI time. GEEs: attacked, P = 0.909; investigated, P = 0.040; fighting, P = 0.016; fleeing, P = 0.104; N = 32 mice; points show means, lines show 30–70th percentile across days. j, t-SNE embedding from an example defeat session coloured by distance between mice. k, Smoothed histogram of t-SNE embeddings from all defeat sessions, with clusters numbered by increasing distance between mice. l, Difference in occupancy of t-SNE clusters between resilient (N = 19) and susceptible (N = 13) mice. Clusters with the largest differences are highlighted in bold (see or). m, Behaviours with the largest difference in l (purple, resilient-biased; green, susceptible-biased; same mice as in l). n, Leave-one-mouse-out cross-validation accuracy (0.81) of predicting resilience versus susceptibility from occupancy of t-SNE clusters; dotted line shows 1 s.d. above chance (0.5) accuracy on shuffled data (one-sided normal test for proportion > 0.5, P = 3.0 × 10⁻⁶; same mice as l and m). or, Two video frames from clusters with the largest differences between resilient and susceptible mice. o, t-SNE 1: fight back. p, t-SNE 3: head investigated. q, t-SNE 16: avoidance. r, t-SNE 15: distant vigilance. s, Schematic of the social defeat towards females experiment. t, Difference in occupancy of t-SNE clusters between resilient (N = 4) and susceptible (N = 4) females; the cluster with the greatest difference is highlighted in bold. u, Relationship between time spent in t-SNE 5 and SI time. GEE: Z = 4.58, P = 8.6 × 10⁻⁵, Bonferroni-corrected for 18 comparisons; N = 8 mice; points show means, lines show 30–70th percentile across days. v, Two video frames from t-SNE 5 (close vigilance). Across panels, *P < 0.05, **P < 0.01, ***P < 0.001, NS, not significant.
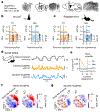
Fig. 2 |
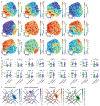
Fig. 2 |. DAT∷GCaMP6f responses in the TS and NAc are oppositely modulated in proximity to the aggressor.
a, Location of fibre photometry recordings from dopaminergic (DAT+) projections in the NAc and TS in the same mouse, recovered using light-sheet microscopy (representative across N = 19 males, 7 females). Scale bars, 400 μm (red, fibre tip diameter) or 1 mm (black) or 400 μm diameter (red, fibre tips). b, Average TS(DAT∷GCaMP6f) (left) and NAc(DAT∷GCaMP6f) (right) responses aligned to air-puff onset within and across all mice (N = 19 males, 8 females, paired two-sided t-test for average activity after versus before puff: TS, t = 5.11, P = 5.4 × 10⁻⁶; NAc, t = −1.34, P = 0.19). c, Average TS(DAT∷GCaMP6f) (left) and NAc(DAT∷GCaMP6f) (right) responses aligned to approach onset of food reward within and across mice (N = 19 males, 7 females, paired two-sided t-test for average activity after versus before approach: TS, t = 2.36, P = 0.025; NAc, t = 6.59, P = 3.8 × 10⁻⁷). d, Example DAT∷GCaMP6f traces in TS(DAT∷GCaMP6f) and NAc(DAT∷GCaMP6f) mice aligned to distance between aggressor and stressed mice. The grey dotted line shows the 10.5 cm threshold used to define close proximity. e, Relationship between distance between mouse centroids and TS(DAT∷GCaMP6f) or NAc(DAT∷GCaMP6f) responses. Close proximity is defined as distances below which NAc(DAT∷GCaMP6f) is negative (10.5 cm). f, Mean TS(DAT∷GCaMP6f) responses across t-SNE behaviour space in defeated males (left) and females (right). The proximal–distal line shows the axis in the behaviour map defined by proximity between mice during defeat (N = 19 males, 8 females). g, Same as f but for NAc(DAT∷GCaMP6f) responses. Across panels, *P < 0.05, **P < 0.01, ***p < 0.001.
Fig. 3 |
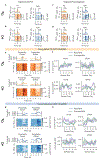
Fig. 3 |. DAT∷GCaMP6f responses in proximity to aggressors in the NAc, but not the TS, are correlated with resilience.
a, Aggressor proximity onset-aligned and offset-aligned TS(DAT∷GCaMP6f) responses during defeat. Data show the mean ± s.e.m. across mice and mean within mouse sorted from susceptible (green, N = 7 males, 4 females) to resilient (purple, N = 12 males, 4 females). Grey region indicates 0.5 s surrounding the extrema. b, Average TS(DAT∷GCaMP6f) responses (grey region in a) from resilient and susceptible groups across defeat (mean ± s.e.m.). c, TS(DAT∷GCaMP6f) responses (grey region in a) versus SI time. Two-sided GEE: onset activity by SI time, day and their interaction: main effect of SI time, Z = −0.24, P = 0.81; main effect of day, Z = 4.973, P = 6.6 × 10⁻⁷. Two-sided GEE: offset activity by SI time, day and their interaction: main effect of SI time, Z = 0.388, P = 0.70; main effect of day, Z = −0.059, P = 0.953. df, Same as ac, respectively, but for NAc(DAT∷GCaMP6f) responses. For f, GEE: onset activity by SI time, day and their interaction: main effect of SI time, Z = 1.98, P = 0.032; main effect of day, Z = −0.93, P = 0.35. Two-sided GEE: offset activity by SI time, day and their interaction: main effect of SI time, Z = −2.77, P = 5.7 × 10⁻³; main effect of day, Z = 3.84, P = 1.2 × 10. g, Example traces of DAT∷GCaMP6f in the TS and the NAc during SI test. h, Social zone entry-aligned and exit-aligned NAc(DAT∷GCaMP6f) responses across stressed mice (mean ± s.e.m., N = 6 susceptible males, 4 susceptible females, 10 resilient males, 3 resilient females), i, Average NAc(DAT∷GCaMP6f) responses in the 1 s surrounding entry or exit from the social zone versus SI time. Entry: two-sided correlation, R = 0.51 P = 0.01; exit: two-sided correlation, R = −0.39, P = 0.062; same number of mice as in h. Across panels, *P < 0.05, **P < 0.01, ***P < 0.001.
Fig. 4 |
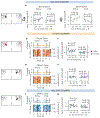
Fig. 4 |. Increased NAc(DAT∷GCaMP6f) responses at the onset of fighting back are correlated with resilience, whereas increased responses at fleeing onset and attack offset are correlated with susceptibility.
a, Schematic of the linear encoding model for the relationship between behavioural events and NAc(DAT∷GCaMP6f) responses. Far left, The full list of behavioural event types. Centre, The convolution of events of one type with 7 cubic splines spanning from 1 s before to 2 s after the event to produce the predictors for the model associated with that event. Right, The learned weights (β values) multiplied by the corresponding predictors sum to estimate the neural activity. An example of behaviour events and observed and predicted NAc(DAT∷GCaMP6f) responses. b, Example of observed (top) and model-predicted (bottom) NAc(DAT∷GCaMP6f) responses across all the social proximity bouts across defeat from an example mouse, aligned to onset (left) and offset (right) of proximity. c, Kernels for behavioural events, averaged across individuals in resilient and susceptible groups (top; mean ± s.e.m. plotted). Relationship between individual’s SI time and average kernel weight in the shaded region in the above kernel weight plots (bottom). Two-sided Pearson’s correlation between SI time and average kernel weight: fight onset, R = 0.47, P = 0.043; fight offset, R = −0.43, R = 0.065; flee onset, R = −0.80, P = 3.7 × 10⁻⁵; flee offset, R = 0.58, P = 0.009; attacked onset, R = 0.51, P = 0.025; attacked offset, R = −0.60, P = 0.006; investigated onset, R = 0.28, P = 0.24; investigated offset, R = −0.08, P = 0.74. In all panels, N = 7 susceptible, 12 resilient males. *P < 0.05,**P < 0.01,***P < 0.001.
Fig. 5 |
Fig. 5 |. DAT∷NAc activation during defeat can bias individuals towards resilience.
a, Left, Neural activation strategy. Right, example histological image with fibre placement. Scale bars, 200 μm (fibre tips) or 1 mm. b, Schematic of open-loop and closed-loop optogenetics. c, Probability of stimulation across behaviour space in the open-loop activation group. d, t-SNE cluster occupancy difference between open-loop (N = 14 males) and control (N = 14 males) groups (same mice for ei). Highlighted in bold are groups differentially expressed by resilient and susceptible mice in our observational study (Fig. 1). e, Across open-loop activation mice, SI time versus average time in t-SNE 15 (distant vigilance; see also Fig. 1r). Two-sided correlation R = 0.74, P = 0.0026, N = 14. f, Difference in SI time between open-loop and control groups (t = 2.19, P = 0.037). g, Difference between open-loop and control groups in average distance between stressed and aggressor mice during the first 5 min of the barrier-separated sensory period (t = −2.90, P = 0.008). h, Difference in open-arm entries in the elevated plus maze between open-loop and control groups (t = 2.56, P = 0.016). i, Difference in chamber crossings in the two-chamber arena between open-loop and control groups (t = 2.45, P = 0.02). j,k, Same as for c and d, respectively, but for fight-back-triggered activation (N = 16 males) and control (N = 14 males) groups (same mice for lp). l, Time spent in fighting behaviour early (day 1 and 2) versus late (day 9 and 10) in defeat. Paired t-tests: two-way false discovery rate (FDR) corrected: fight-back-triggered, t = 2.77 P = 0.029; control, t = −0.41 P = 0.69. m, Same as f, but for fight-back-triggered activation (t = 2.29, P = 0.030). n, Same as g, but for fight-back-triggered activation (t = −2.99, P = 0.006). o, Same as h, but for fight-back-triggered activation (t = 2.87, P = 0.008). p, Same as i, but for fight-back-triggered activation (t = 2.64, P = 0.013). q,r, Same as c and d, respectively, but for escape-triggered activation (N = 8 males) and control (N = 5 males) groups (same mice for s,u,v). s, Time spent fleeing early (day 1 and 2) versus late (day 9 and 10) in defeat. Paired t-tests: two-way FDR corrected: escape-triggered, t = 6.42 P = 7.2 × 10⁻⁴; control t = 0.68, P = 0.54. t, Same as f, but for escape-triggered activation (t = 0.17, P = 0.87, N = 8 experimental, 4 control mice). u, Same as g, but for escape-triggered activation (t = −3.94, P = 0.07). v, Same as h, but for escape-triggered activation (t = −0.10, P = 0.92). w, Same as i, but for escape-triggered activation (t = 1.76, P = 0.11, N = 8 experimental, 4 mice). x, Relative similarity in t-SNE behaviour maps from individuals in manipulation groups to susceptible or resilient males in our observational study (see also Fig. 1). One-sample, two-sided t-tests for mean different from 0, four-way Benjamini–Hochberg FDR corrected: open-loop, t = −2.73, P = 0.023; fight-back-triggered, t = −2.85, P = 0.023; escape-triggered, t = 1.11, P = 0.30; attack-triggered inhibition, t = 3.3, P = 0.023. In panels fi, mp, tw, two-sided t-test was used. Across panels, the bar and line plots show the mean ± s.e.m., *P < 0.05, **P < 0.01, ***P < 0.001.

References

    1. Cohen S, Janicki-Deverts D & Miller GE Psychological stress and disease. J. Am. Med. Assoc 298, 1685–1687 (2007). - PubMed
    1. van Praag HM, de Kloet ER & van Os J in Stress, the Brain and Depression 225–259 (Cambridge Univ. Press, 2004).
    1. Krishnan V et al. Molecular adaptations underlying susceptibility and resistance to social defeat in brain reward regions. Cell 131, 391–404 (2007). - PubMed
    1. Chaudhury D et al. Rapid regulation of depression-related behaviours by control of midbrain dopamine neurons. Nature 493, 532–536 (2013). - PMC - PubMed
    1. Cao J-L et al. Mesolimbic dopamine neurons in the brain reward circuit mediate susceptibility to social defeat and antidepressant action. J. Neurosci 30, 16453–16458 (2010). - PMC - PubMed

Publication types