. 2022 Nov;611(7935):312-319.
doi: 10.1038/s41586-022-05349-x. Epub 2022 Oct 19.

Evolution of immune genes is associated with the Black Death

Affiliations

Evolution of immune genes is associated with the Black Death

Jennifer Klunk et al. Nature. 2022 Nov.

Erratum in

  • Author Correction: Evolution of immune genes is associated with the Black Death.
    Klunk J, Vilgalys TP, Demeure CE, Cheng X, Shiratori M, Madej J, Beau R, Elli D, Patino MI, Redfern R, DeWitte SN, Gamble JA, Boldsen JL, Carmichael A, Varlik N, Eaton K, Grenier JC, Golding GB, Devault A, Rouillard JM, Yotova V, Sindeaux R, Ye CJ, Bikaran M, Dumaine A, Brinkworth JF, Missiakas D, Rouleau GA, Steinrücken M, Pizarro-Cerdá J, Poinar HN, Barreiro LB. Klunk J, et al. Nature. 2025 Jan;637(8048):E30. doi: 10.1038/s41586-024-08522-6. Nature. 2025. PMID: 39814901 Free PMC article. No abstract available.

Abstract

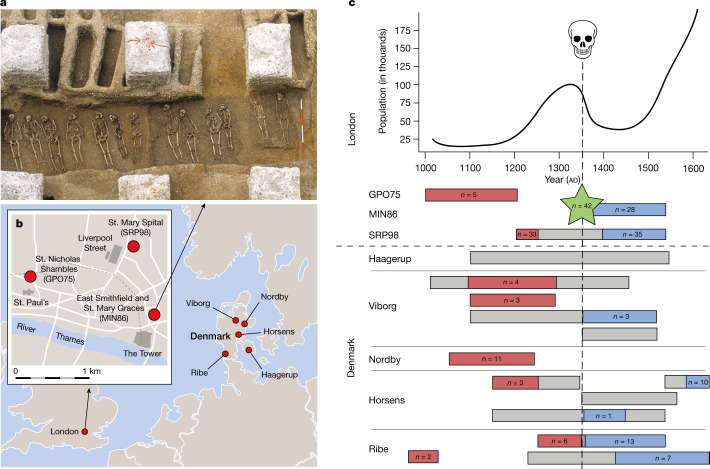
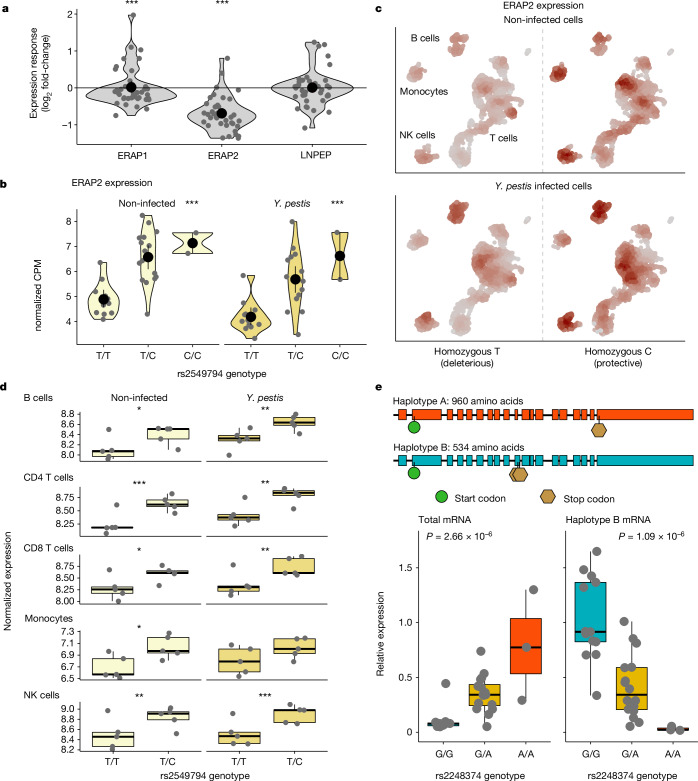
Infectious diseases are among the strongest selective pressures driving human evolution1,2. This includes the single greatest mortality event in recorded history, the first outbreak of the second pandemic of plague, commonly called the Black Death, which was caused by the bacterium Yersinia pestis3. This pandemic devastated Afro-Eurasia, killing up to 30-50% of the population4. To identify loci that may have been under selection during the Black Death, we characterized genetic variation around immune-related genes from 206 ancient DNA extracts, stemming from two different European populations before, during and after the Black Death. Immune loci are strongly enriched for highly differentiated sites relative to a set of non-immune loci, suggesting positive selection. We identify 245 variants that are highly differentiated within the London dataset, four of which were replicated in an independent cohort from Denmark, and represent the strongest candidates for positive selection. The selected allele for one of these variants, rs2549794, is associated with the production of a full-length (versus truncated) ERAP2 transcript, variation in cytokine response to Y. pestis and increased ability to control intracellular Y. pestis in macrophages. Finally, we show that protective variants overlap with alleles that are today associated with increased susceptibility to autoimmune diseases, providing empirical evidence for the role played by past pandemics in shaping present-day susceptibility to disease.


Conflict of interest statement

J.K., A. Devault and J.-M.R. declare financial interest in Daicel Arbor Biosciences, which provided the myBaits hybridization capture kits for this work. All other authors declare no competing interests.

Figures

Fig. 1
Fig. 1. East Smithfield mass burial and sample locations, along with date ranges and final sample numbers used for the present study.
a, East Smithfield Black Death mass burial site from 1348–1349 (reproduced with permission of the Museum of London Archaeology, copyright MOLA). b, Site locations and archaeological site codes (in parentheses) for samples from London (inset, after ref. , Museum of London Archaeology) and from across Denmark. c, Top, population size estimates for London for around six centuries (data are from refs.,,) (Supplementary Table 1). Bottom, site locations with associated date ranges. Coloured boxes indicate date range for samples, numbers in boxes indicate samples meeting all criteria for inclusion in final analyses (see main text and Supplementary Information). Number in green star stems from East Smithfield and the dashed line refers to the time of the Black Death.
Fig. 2
Fig. 2. Positive selection at immune loci.
a,b, Enrichment of highly differentiated sites in functional regions relative to neutral regions when comparing the pre-Black Death (BD) population to the post-BD population in London (a) and Denmark (b). c, FST between London before and after the Black Death, limited to the 366 sites that show qualitative patterns consistent with natural selection (namely allele frequency changes in the same direction in both London and Denmark after the Black Death, and the opposite direction for individuals who died during the Black Death (Supplementary Table 4)). Manhattan plot showing loci with patterns indicative of positive selection. Point size and colour intensity (which alternates by chromosome) represents the –log10 P value comparing populations in London before and after the plague, points coloured in orange represent the strongest candidate for positive selection and their associated genes, which are highly differentiated in Denmark as well. d, Patterns of allelic change over time at rs2549794, the strongest candidate for positive selection. Error bars represent the standard deviation based on bootstrapping individuals from that population and each time point 10,000 times. Allele frequencies for London are shown in red and for Denmark are shown in blue. Modern allele frequencies are derived from 1000 Genomes data for Great Britain in London.
Fig. 3
Fig. 3. Positively selected loci are associated with changes in gene regulation upon Y. pestis stimulation.
a, Normalized log2 fold-change of genes within 100 kb of rs2549794, the strongest candidate for positive selection, in response to incubation of primary macrophages for four hours with heat-killed Y. pestis. Dark grey dots correspond to the fold-change observed for each of the 33 individuals tested; red dots and bars represent the mean ± standard deviation. With the exception of LNPEP, all associations are significant (10% false discovery rate). b, Effect of rs2549794 genotype upon ERAP2 expression, split by macrophages stimulated for four hours with heat-killed Y. pestis and unstimulated macrophages. Red dots and bars represent the mean ± standard deviation. c, Comparison of ERAP2 expression among non-infected and infected cells with live Y. pestis for five hours, profiled using scRNA-sequencing data in individuals with homozygous rs2549794 genotypes. Colour intensity reflects the level of ERAP2 expression, standardized for unstimulated or infected cells. Major PBMC cell types are labelled and can be found clearly coloured in Extended Data Fig. 7; CD4+ and CD8+ T cells were analysed separately. NK, natural killer. d, Effects of rs2549794 genotype upon ERAP2 expression, split by infected and non-infected conditions, for each cell type. e, Illustration of the two haplotype-specific ERAP2 spliced forms for Haplotype A and Haplotype B with start (green) and stop (brown) codons. Below we show the effect of rs2248374 genotype upon total mRNA expression of ERAP2 (left) and the specific expression of the isoform (Haplotype B) encoding the truncated version of ERAP2 (right). For all panels: ***P < 0.001; **P < 0.01; *P < 0.05.
Fig. 4
Fig. 4. ERAP2 genotype is associated with cytokine response to Y. pestis stimulation.
ad, Effect of genotype upon cytokine levels for granulocyte colony-stimulating factor (G-CSF) (a), interleukin-1β (IL-1β) (b), interleukin 10 (IL-10) (c) and C-C motif chemokine ligand 3 (CCL3) (d). Remaining cytokines showed no significant effects and are included in Supplementary Table 7. e, Boxplots showing the percentage of bacteria killed (y axis) by macrophages infected for 24 h as a function of ERAP2 genotype (x axis). The percentage of bacteria killed was calculated as the CFU2 h − CFU24 h/CFU2 h, where CFU is colony-forming unit. The P value results from a linear model examining the association between ERAP2 single nucleotide polymorphism genotypes (SNP) (coded as the number of protective rs2549794 alleles found in each individual: 0, 1 or 2) and the percentage of bacteria killed.
Extended Data Fig. 1
Extended Data Fig. 1. Differences in recombination rate and background selection are insufficient to explain the marked enrichment of high FST values among immune loci.
Comparison of recombination rate (A) and background selection levels (B) between neutral loci and our candidate regions. Candidate regions were stratified into those which were tested and those which were candidates for positive selection based on high differentiation in London pre- vs post-BD. (C) Forward simulations matched for the rates of recombination and background selection of the regions targeted in our study show a slight enrichment of highly differentiated sites in candidate regions, but far from the level of enrichment observed in our collected data (D), replicated from Fig. 2a for comparison. For example, whereas our data differentiation at immune loci exceeded the 99th percentile of neutral variants at 4.3x the rate expected by chance, the same enrichment is less than 1.4x in the simulated data.
Extended Data Fig. 2
Extended Data Fig. 2. Estimates of the selection coefficients for the four SNPs of interest and power of the inference procedure.
(A) Distributions of sˆMLE for rs2549794, the strongest candidate for positive selection, when replicates are simulated based on the bootstrapped allele frequency distributions as initial conditions and bootstrap-corrected estimates s~MLE. Whiskers on the violin plots label the 2.5-, 50-, and 97.5-percentiles of their respective distributions. (B) ROC and (C) Precision-Recall curves for the estimation procedure to distinguish replicates under selection from those under neutrality.
Extended Data Fig. 3
Extended Data Fig. 3. Principal components of gene expression for macrophages stimulated with heat-killed Y. pestis.
The first principal component clearly separates stimulated samples from matched controls.
Extended Data Fig. 4
Extended Data Fig. 4. Response to Y. pestis is similar between macrophages stimulated with heat-killed and live Y. pestis.
Effect size of Y. pestis stimulation compared between heat-killed Y. pestis (x-axis, n = 33 individuals) and live Y. pestis (y-axis, n = 8 individuals). (A) shows all genes, with a blue line representing the best fit line (r = 0.88). (B) compares effect sizes at genes near candidates for positive selection profiled in both expression datasets (red: heat-killed; purple: live bacteria). Error bars represent the standard error in estimating the effect size. Asterisks placed near the point estimate of each value represent the significance: *** p < 0.001; ** p < 0.01; * p < 0.05.
Extended Data Fig. 5
Extended Data Fig. 5. Transcriptional changes of genes nearby candidate loci in response to bacterial and viral stimuli.
Data are derived from Nedelec et al. and Quach et al Nedelec et al. measured the gene expression response of monocyte-derived macrophages to infection with two live intracellular bacteria: Listeria monocytogenes (a Gram-positive bacterium) and Salmonella typhimurium (a Gram-negative bacterium). Quach et al. characterized the transcriptional response at 6 h of primary monocytes to bacterial and viral stimuli ligands activating Toll-like receptor pathways (TLR1/2, TLR4, and TLR7/8) and live influenza virus. The data for Y. pestis are the fold change responses observed in response to heat-killed bacteria. A negative estimate in plot (purple) indicates that the gene is downregulated and a positive value (red) indicates that the gene is up-regulated. The statistical support for the reported changes is given by the associated p values. Larger circle sizes represent smaller p values and empty circles refer to cases where the gene was not expressed in that dataset.
Extended Data Fig. 6
Extended Data Fig. 6. Genotype effects on transcription at candidate loci.
Effect of genotype at nearby loci on the expression of ERAP2 across experimental conditions in this study and previously published,. For ERAP2, the protective “C” haplotype increases expression in all conditions (p < 0.001).
Extended Data Fig. 7
Extended Data Fig. 7. UMAP project of single cell data.
UMAP projection of single-cell RNA sequencing data of non-infected cells and cells infected with live Y. pestis for five hours, after integrating samples. Major immune cell types cluster separately and cells are colored by the cell type to which they were assigned.
Extended Data Fig. 8
Extended Data Fig. 8. Transcriptional changes of genes nearby candidate loci in response to Y. pestis infection across cell types.
For each cell type profiled using single-cell RNA sequencing, we show the effect of Y. pestis infection upon gene expression. A negative estimate (purple) indicates that the gene is downregulated and a positive value (red) indicates that the gene is up-regulated. The statistical support for the reported changes is given by the associated p values. Larger circle sizes represent smaller p values and empty circles refer to cases where the gene was not expressed in that cell type.
Extended Data Fig. 9
Extended Data Fig. 9. Expression of ERAP2 isoforms.
Bioanalyzer traces showing the results of the PCR amplification of cDNA across the exon 10 splice junction from macrophages of 10 individuals with different genotypes for the slice variant rs2248374. The genotype of each individual is shown on top. A negative PCR control was also performed using water. The G allele at rs2248374 is predicted to produce an elongated exon 10 containing two premature stop codons (red rectangles), leading to nonsense mediated decay.
Extended Data Fig. 10
Extended Data Fig. 10. Schematics for estimating selection coefficients.
The time axis serves as an approximate reference of the relative sampling times for the empirical samples. Dashed vertical lines indicate the relative sampling time for each group of samples considered in the analysis, and the floating boxes with orange and blue dots represent pools of samples from a bi-allelic locus. Above and below the time axis are sketches that respectively correspond to the simulation scheme and the likelihood computations. The shaded red horizontal tree represents the population-continuity along approximate time (x-axis), with the Black Death pandemic occurring in the dark shaded period. The shortened branch with a skull at the end represents people who died of the disease. In each simulated replicate, ∆p and −∆p mark the respective changes of allele frequency during the pandemic in the mid-pandemic and post-pandemic sample pools. In the inference schematics, each horizontal straight line represents a sampling scheme from which a likelihood was computed. Lightning bolts labeled with s or −s represent the selection coefficients.

Comment in

References

    1. Inhorn, M. C. & Brown, P. J. The anthropology of infectious disease. Anu. Rev. Anthrolpol.19, 89–117 (1990).
    1. Fumagalli, M. et al. Signatures of environmental genetic adaptation pinpoint pathogens as the main selective pressure through human evolution. PLoS Genet.7, e1002355 (2011). - PMC - PubMed
    1. Bos, K. I. et al. A draft genome of Yersinia pestis from victims of the Black Death. Nature478, 506–510 (2011). - PMC - PubMed
    1. Benedictow, O. J. The Black Death, 1346–1353: The Complete History (Boydell Press, 2004).
    1. Quintana-Murci, L. & Clark, A. G. Population genetic tools for dissecting innate immunity in humans. Nat. Rev. Immun.13, 280 (2013). - PMC - PubMed

Publication types