. 2022 Oct;610(7933):775-782.
doi: 10.1038/s41586-022-05333-5. Epub 2022 Oct 19.

The E3 ligase adapter cereblon targets the C-terminal cyclic imide degron

Affiliations

The E3 ligase adapter cereblon targets the C-terminal cyclic imide degron

Saki Ichikawa et al. Nature. 2022 Oct.

Abstract

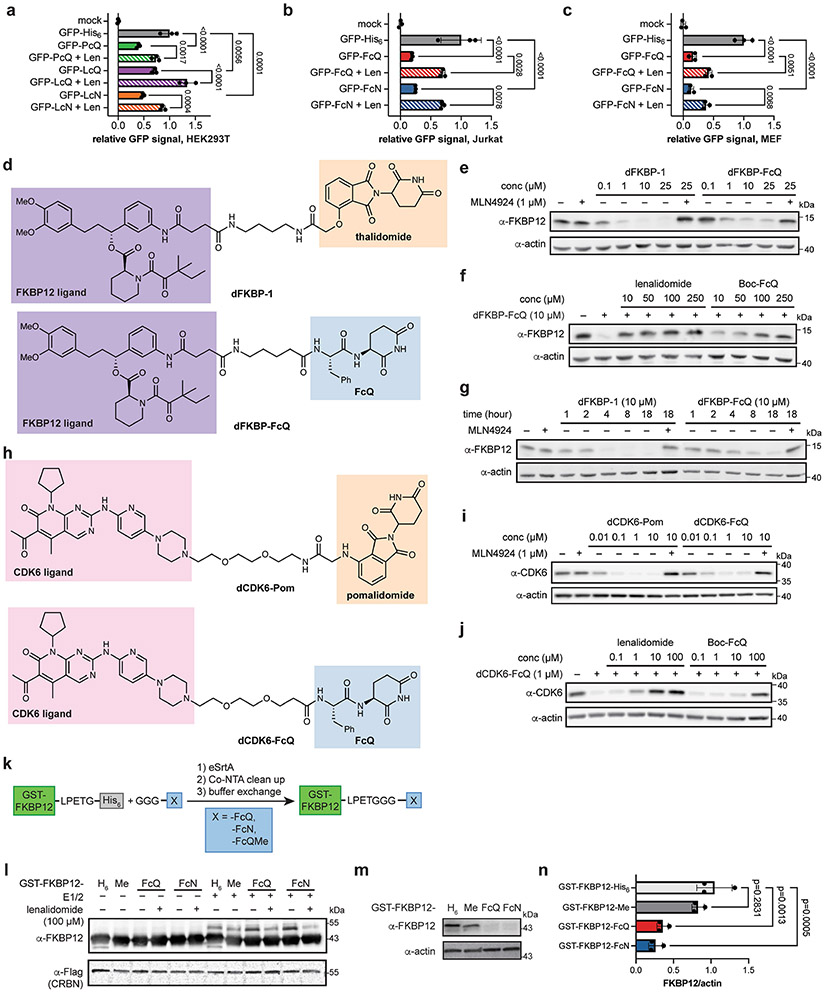
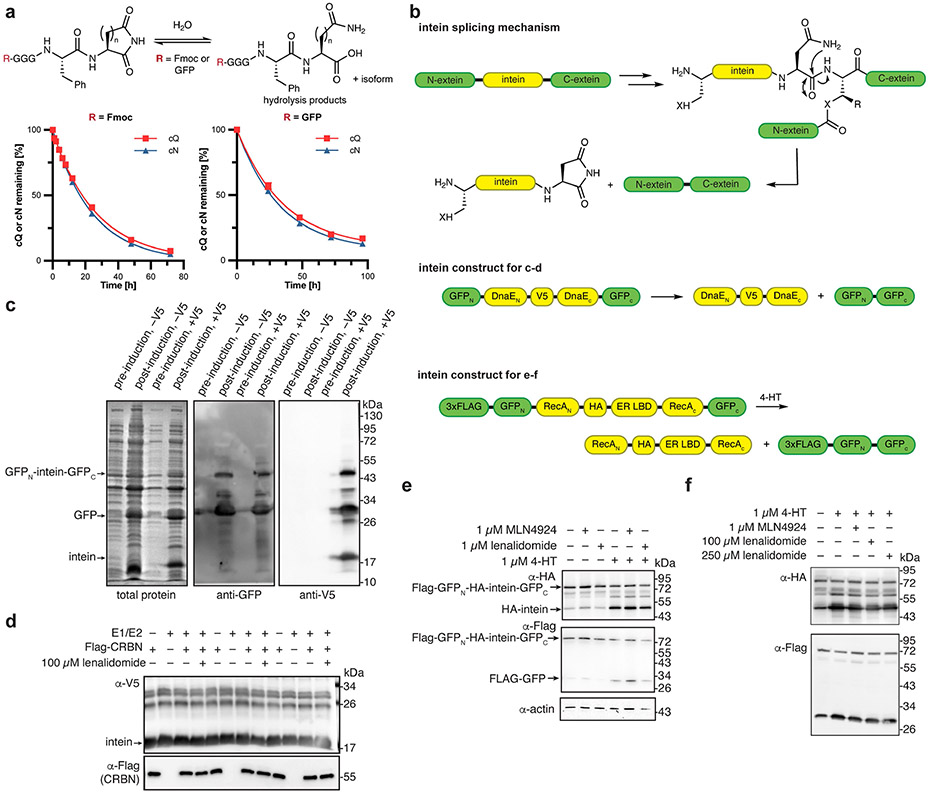
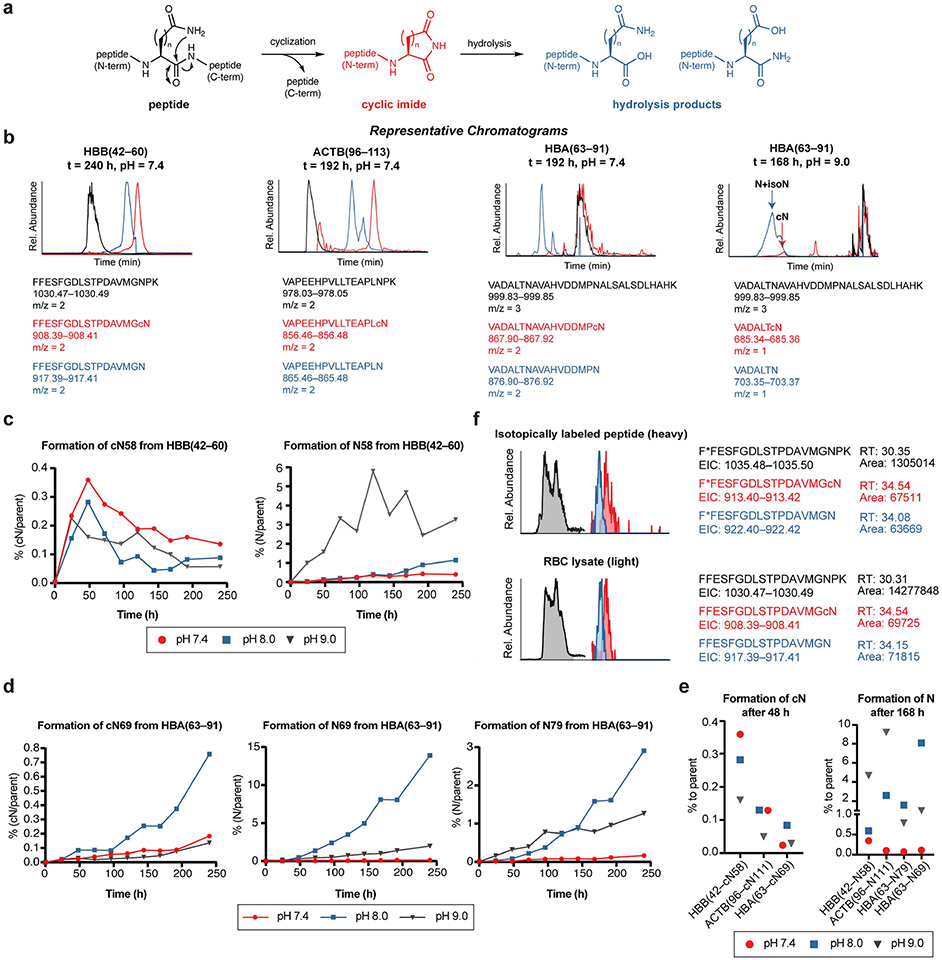
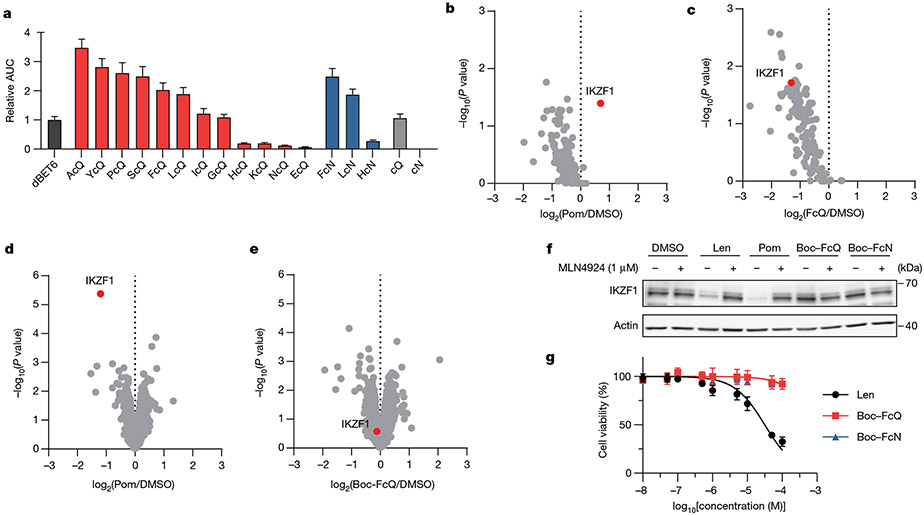
The ubiquitin E3 ligase substrate adapter cereblon (CRBN) is a target of thalidomide and lenalidomide1, therapeutic agents used in the treatment of haematopoietic malignancies2-4 and as ligands for targeted protein degradation5-7. These agents are proposed to mimic a naturally occurring degron; however, the structural motif recognized by the thalidomide-binding domain of CRBN remains unknown. Here we report that C-terminal cyclic imides, post-translational modifications that arise from intramolecular cyclization of glutamine or asparagine residues, are physiological degrons on substrates for CRBN. Dipeptides bearing the C-terminal cyclic imide degron substitute for thalidomide when embedded within bifunctional chemical degraders. Addition of the degron to the C terminus of proteins induces CRBN-dependent ubiquitination and degradation in vitro and in cells. C-terminal cyclic imides form adventitiously on physiologically relevant timescales throughout the human proteome to afford a degron that is endogenously recognized and removed by CRBN. The discovery of the C-terminal cyclic imide degron defines a regulatory process that may affect the physiological function and therapeutic engagement of CRBN.


Figures

Extended Data Fig. 1 ∣
Extended Data Fig. 1 ∣. Examination of bifunctional degraders of BRD4 with candidate degrons for CRBN.
(a) Representative mechanisms of the formation of C-terminal cyclic aspartimide (cN) or glutarimide (cQ) and N-terminal pyroglutamate (pE) in vivo. (b) Structures of JQ1-uracil, JQ1-PEG-uracil, and JQ1-uridine. (c) Western blot of BRD4 after treatment with JQ1-uracil, JQ1-PEG-uracil, JQ1-uridine in HEK293T cells for 24 h. (d) Structures of JQ1-cQ, JQ1-cN, and JQ1-FpE. (e) Western blot of BRD4 after treatment with JQ1-cQ, JQ1-cN, JQ1-FpE in HEK293T cells for 4 h. All western blot data are representative of at least 2 independent replicates. For uncropped western blot images, see Supplementary Fig. 8.
Extended Data Fig. 2 ∣
Extended Data Fig. 2 ∣. Evaluation of JQ1-XcQ and JQ1-XcN degraders in targeted protein degradation of BRD4.
(a) Western blots of BRD4 levels after treatment of HEK293T cells with 100 nM, 1 μM, or 10 μM dBET6 for the 20 dipeptide degraders. Interestingly, the hook effect resulting in reduced degradation of BRD4 can be observed from dBET6 at 10 μM, but not from the dipeptide degraders. (b) BRD4 degradation with dBET6 over 4 h was competitively inhibited by lenalidomide or Boc-FcQ over a dose-dependent concentration (0.1–100 μM), indicating that the thalidomide-binding domain of CRBN is engaged by glutarimide ligands. (c) Levels of BRD4 over time in HEK293T cells treated with dBET6 or JQ1-FcQ. (d) Evaluation of JQ1-HcN in targeted protein degradation of BRD4 at various concentrations in HEK293T cells over 4 h. This probe was constructed given that protein splicing products (e.g., inteins) are typically promoted by a penultimate histidine. (e) Western blot of BRD4 after treatment of wild type (WT) or shRNA knockdown (CRBN KD) HEK293T cells with the indicated degrader. (f) Western blot of BRD4 after co-treatment of HEK293T cells with JQ1-FcN and lenalidomide or Boc-FcN. (g) Levels of BRD4 over time in HEK293T cells treated with JQ1-FcN. All western blot data are representative of 2 independent replicates. For uncropped western blot images, see Supplementary Fig. 8.
Extended Data Fig. 3 ∣
Extended Data Fig. 3 ∣. Co-immunoprecipitation and photo-affinity displacement assay with dipeptide degraders and ligands.
(a) Co-immunoprecipitation of endogenous BRD4 from HEK-CRBN in cells (left) or in lysates (right) after 2 h treatment with 25 μM or 1 μM of the indicated degrader. Western blot data are representative of 2 independent replicates. (b) Photo-affinity labeling displacement assay using photo-lenalidomide (pLEN) to visualize in-gel fluorescence imaging of CRBN/DDB1. Comparisons were performed using unpaired two-tailed t-tests. ns = not significant, * = p < 0.05, ** = p < 0.01, *** = p < 0.001, **** = p < 0.0001. Data are presented as mean ± SD (n = 3 biologically independent samples). (c) Structure of photo-lenalidomide (pLEN) and schematic of photo-affinity labeling displacement assay using photo-lenalidomide (pLEN) to visualize in-gel fluorescence imaging of CRBN/DDB1. (d) Corresponding gel images after treatment of CRBN/DDB1 with 1 μM pLEN and 100 μM of the indicated competitor for 30 min prior to photo-affinity labeling and in-gel fluorescence imaging. Data shown include 3 biologically independent replicates. For uncropped western blot and gel images, see Supplementary Fig. 9.
Extended Data Fig. 4 ∣
Extended Data Fig. 4 ∣. Ternary complex formation of dipeptide ligands with CRBN and BRD4.
(a) Schematic showing the domains of CRBN, including the CULT domain with key residues for immunomodulatory drug binding highlighted, and AlphaScreen design. (b–c) AlphaScreen experiments performed with the indicated degrader compounds. The relative area under the curve reflected the cellular degradation trends, with several of the dipeptide degraders resulting in a signal greater than or comparable to dBET6. Interestingly, the inactive degraderJQ1-cQ promotes ternary complex formation equivalent to the active JQ1-GcQ, indicating that the N–1 amino acid residue positions the ternary complex in a more productive conformation. Data shown in (b) and (c) are each performed on a single 384-well plate; dBET6 was assayed on each plate as an internal control. Each condition was measured in triplicate. (d) Schematic of NanoBRET assay. (e) NanoBRET measurement of ternary complex formation induced by the indicated members of the degrader library as determined by acceptor:donor signal ratio, with background signal from no-ligand control for each degrader subtracted. Each condition was assayed in triplicate. Error bars represent mean ± SEM.
Extended Data Fig. 5 ∣
Extended Data Fig. 5 ∣. Characterization of the IMiDs and the indicated peptides in HEK293T cells and multiple myeloma MM.1S cells.
(a) Model of dipeptide degraders with CRBN built from 6BOY and 6H0F. Left: Model of JQ1-FcQ (yellow) by molecular modeling of dBET6 (orange) in the ternary complex with CRBN (grey) and BRD4 (blue). Middle: zoom-in of the CRBN binding pocket with thalidomide analog (orange), Ac-FcQ (yellow), or Ac-FcN (green). Right: Model of pomalidomide (orange), FcQ (yellow), and FcN (green) in the ternary complex with CRBN (grey) and IKZF1 (blue, space-filling mode). (b) Structures of Boc-cQ, Me-FcQ, Ac-FcQ, H2N-FcN or H2N-FcQ, Boc-FcN or Boc-FcQ, and GGGFcQ. (c–d) Quantitative proteomics of co-immunoprecipitated proteins from lysates of HEK-CRBN cells overexpressing IKZF1 after 2 h incubation with 1 μM (c) FcN or (d) GGGFcQ. Protein levels were normalized to the amount of CRBN in each channel. P-values for the abundance ratios were calculated by one-way ANOVA with TukeyHSD post-hoc test. (e) Competitive inhibition of BRD4 degradation by the indicated dipeptide degrader (JQ1-FcN, JQ1-FcQ) with the indicated compounds in HEK293T cells for 4 h. All western blot data are representative of 2 independent replicates. (f) Quantitative proteomics of MM.1S cells after treatment with 10 μM of Boc-FcN for 10 h. P-values for the abundance ratios were calculated using the t-test (background) method. (g) Protein expression levels of IKZF1 after treatment with the indicated compounds in MM.1S cells for 10 h. Data are presented as mean ± SD (n = 3 biologically independent samples). (h) Quantitative proteomics of HEK293T cells after treatment with 0.1 μM of JQ1-FcQ or dBET6 for 2 h. P-values for the abundance ratios were calculated using the t-test (background) method. (i) Protein expression levels of BRD2 and BRD4 after treatment with the indicated compounds in HEK293T cells for 2 h. Data are presented as mean ± SD (n = 3 biologically independent samples). All proteomics experiments were performed in biological triplicates. For uncropped western blot images, see Supplementary Fig. 10.
Extended Data Fig. 6 ∣
Extended Data Fig. 6 ∣. The C-terminal cyclic imide degron is transferrable.
(a-c) Flow cytometry analysis of the GFP levels in (a) HEK293T cells, (b) Jurkat or (c) MEF cells 6 h after electroporation with GFP tagged with the indicated peptide, with or without lenalidomide competition (100 μM). Comparisons were performed using an ordinary one-way ANOVA with Šídák’s multiple comparisons test, and p values are shown above comparison bars. (d) Structure of FKBP12 degraders dFKBP-1 and dFKBP-FcQ. (e) Western blot of FKBP12 levels after treatment of HEK293T cells with dFKBP-1 or dFKBP-FcQ over a 0.1–25 μM dose-response range. (f) Western blot of FKBP12 levels after co-treatment of HEK293T cells with dFKBP-FcQ and lenalidomide or Boc-FcQ. (g) Levels of FKBP12 over time in HEK293T cells treated with dFKBP-1 or dFKBP-FcQ. (h) Structure of CDK6 degraders dCDK6-Pom and dCDK6-FcQ. (i) Western blot of CDK4/6 levels after treatment of Jurkat cells with dCDK6-Pom or dCDK6-FcQ over a 0.01–10 μM dose-response range. (j) Western blot of CDK6 levels after co-treatment of Jurkat cells with dCDK6-FcQ and lenalidomide or Boc-FcQ. (k) Sortase system used to generate degron-tagged GST-FKBP12 from GST-FKBP12-LPETG-His6. (l) In vitro ubiquitination of FKBP12 tagged with C-terminal cyclic imide. FKBP12-H6 = FKBP12 with C-terminal His6 tag (no sortase treatment); FKBP12-Me = FKBP12 with C-terminal FcQMe; FKBP12-FcQ = FKBP12 with C-terminal FcQ; FKBP12-FcN = FKBP12 with C-terminal FcN. (m) Western blot of FKBP12 tagged with the indicated peptides 6 h after electroporation into HEK293T cells. (n) Quantification of Western blot in (m). Error bars represent mean ± SD. Comparisons were performed using an ordinary one-way ANOVA with Šídák’s multiple comparisons test. All western blot data are representative of at least 2 independent replicates. Flow cytometry data is representative of 3 independent replicates. For uncropped western blot images, see Supplementary Fig. 10.
Extended Data Fig. 7 ∣
Extended Data Fig. 7 ∣. The inteins Npu DnaE and Mtu RecA are not CRBN substrates.
(a) Left: hydrolysis of cyclic imides Fmoc-GGGFcQ or Fmoc-GGGFcN in PBS at 37 °C. (n = 3 biologically independent samples, error bars, which fall within symbols, represent mean ± SD). Right: hydrolysis of C-terminal cyclic imides on GFP-FcQ or GFP-FcN in PBS at 37 °C (n = 3 biologically independent samples, error bars, which fall within symbols, represent mean ± SD). (b) Schematic of the intein splicing mechanism with the penultimate step in intein excision that generates a C-terminal aspartimide highlighted, and the two intein constructs before and after splicing. X = O or S, R = H or CH3. (c) Analysis of expression and splicing of Npu DnaE in E. coli with and without a V5 tag inserted in the intein. (n = 1 biologically independent replicate) (d) In vitro ubiquitination of V5-tagged cell lysate generated in c (n = 3 biologically independent replicates, all shown). (e, f) Effect of MLN4924 or lenalidomide pretreatment on 4-hydroxytamoxifen (4-HT)-induced splicing of GFP with HA-tagged Mtu RecA intein in HEK293T cells. For both e and f, data shown are representative of 2 biologically independent replicates. For uncropped western blot images, see Supplementary Fig. 11.
Extended Data Fig. 8 ∣
Extended Data Fig. 8 ∣. Analysis of C-terminal cQ/cN modifications on hemoglobin derived from red blood cells and beta-crystallin derived from bovine lens.
(a) Unique proteins and peptides that carry a semi-tryptic terminal N or Q from global proteomics datasets. (b) Western blot of red blood cell (RBC) lysates from two donors in comparison to HEK293T lysate. RBCs do not express CRBN. (c) Representative MS2 spectra of HBB(42–cN58) and HBA(63–cN79) detected in RBC lysates. Western blot is representative of 2 independent replicates. (d) Comparison of peptide spectral matches (PSMs) for selected hemoglobin subunits and actin observed in global proteomics datasets, recombinant hemoglobin beta (HBB) protein, and red blood cell (RBC) lysates. HBA(63–cN69) was observed by extracted ion chromatogram in the MS1. Sites selected for further analysis are highlighted in red or blue. (e) Quantification of the three major peptide groups bearing a C-terminal cyclic imide from RBC samples with or without base treatment. Data are presented as mean ± SD (n = 3 biologically independent samples). The noted p-values were obtained by one-way ANOVA with TukeyHSD post-hoc test from Proteome Discoverer. (f) Quantification of the two major chymotryptic peptide groups bearing C-terminal cyclic imides in RBC samples with or without base treatment. Data are presented as mean ± SD (n = 5 biologically independent samples). The noted p-values were obtained by one-way ANOVA with TukeyHSD post-hoc test from Proteome Discoverer. (g) Quantification of the absolute masses and percentages of HBB(42–60), HBB(42–cN58), and HBB(42–N58) in RBC samples using selected ion monitoring. (h) Ion intensity chromatograms extracted for the masses of the cyclic imide fragment and the corresponding tryptic peptide for three cyclic imide-bearing peptide groups identified in bovine lens. (i) Quantification of these peptide groups validates the sensitivity of the cyclic imide modifications to base treatment. Data are presented as mean ± SD (n = 4 biologically independent samples). The noted p-values were obtained by one-way ANOVA with TukeyHSD post-hoc test from Proteome Discoverer. For uncropped western blot images, see Supplementary Fig. 11.
Extended Data Fig. 9 ∣
Extended Data Fig. 9 ∣. Analysis of C-terminal cQ/cN and Q/N modifications on synthetic peptides.
(a) Scheme of cyclic imide formation in a peptide and subsequent hydrolysis to afford the truncated C-terminal glutamine or asparagine fragments. (b) Overlay of representative extracted ion chromatograms of each peptide at the masses corresponding to parent peptide (black), cyclic imide fragment (red), and its hydrolyzed products (blue). The two constitutional isomers formed via hydrolysis of the cyclic imide fragment were not distinguished in our study. (c–d) In vitro time course for formation of the cyclic imide fragment and the hydrolysis products at the indicated position on the synthetic peptide after incubation. (e) Percentage of the formed cyclic imide fragment and the hydrolysis products at the indicated residue relative to the parent synthetic peptide at different pH. (f) Ion intensity chromatogram extracted for the masses of the corresponding species for RBC lysates and the mixture of isotopically labeled HBB(42*–60) containing the modifications. The RBC samples were spiked with the peptide mixture and ran on the selected ion monitoring mode to validate the overlap of retention times and amplify the signal of selected ions.
Extended Data Fig. 10 ∣
Extended Data Fig. 10 ∣. Analysis of substrates bearing C-terminal cQ/cN and Q/N modifications in vitro and in cells.
(a) Schematic of expressed protein ligation using HBB(1–129) thioester and Sec-YcQ or Sec-YcQMe to generate HBB(1–cQ132) or HBB(1–Me132). (b) Western blot of in vitro ubiquitination of HBB proteins in triplicate. Unfortunately neither the HBB[1–cQ132] nor recombinant HBB was amenable to electroporation, which precluded our ability to evaluate CRBN-dependent degradation in cells. (c) TMT-based quantification of K-ε-GG sites identified from the in vitro ubiquitination samples using mass spectrometry. Data are presented as mean ± SD (n = 4 technical replicates). Comparisons were performed using unpaired two-tailed t-tests and p-values are noted. (d) Volcano plots of peptide groups bearing C-terminal cyclic imides in WT HEK293T or CRBN CRISPR/Cas9 knockout HEK293T over 48 h. Upregulated proteins at 1% FDR = red, 5% FDR = pink. ACTB(96–cN111) peptide = blue. P-values for the abundance ratios were calculated by one-way ANOVA with TukeyHSD post-hoc test. (e) Volcano plots of peptide groups bearing C-terminal glutamine or asparagine (protein terminus excluded) in WT HEK293T, CRBN KO HEK293T, or HEK293T treated with 200 μM lenalidomide over 48 h. Upregulated peptide groups at 1% FDR = red, 5% FDR = pink, consistent with a model where blockade of degradation of substrates bearing the C-terminal imide allows the modifications to be hydrolyzed. P-values for the abundance ratios were calculated by one-way ANOVA with TukeyHSD post-hoc test. (f) Volcano plots of peptide groups bearing C-terminal glutamine or asparagine (protein terminus excluded) in MM.1S treated with DMSO or 200 μM lenalidomide over 48 h. Upregulated peptide groups at 1% FDR = red, 5% FDR = pink. P-values for the abundance ratios were calculated by one-way ANOVA with TukeyHSD post-hoc test. (g) Ion intensity chromatogram extracted for the masses of the corresponding species for HEK293T lysates and the mixture of isotopically labeled ACTB(96*–113) containing the modifications. The cell samples were spiked with the peptide mixture and ran on the selected ion monitoring mode to validate the overlap of retention times and amplify the signal of selected ions. For uncropped western blot images, see Supplementary Fig. 11.
Fig. 1 ∣
Fig. 1 ∣. Cyclic imide dipeptides functionally engage cereblon in targeted protein degradation.
a, CRBN is engaged by thalidomide and lenalidomide in a manner that may mimic the biological ligand. Models of CRBN engagement by either a small molecule or PTM-based degron. Examples of neosubstrate and known targets used here are shown in parentheses. Ub, ubiquitin. b, The structure of thalidomide and candidate structures for the CRBN degron. c, The structure of dBET6 and candidate dipeptide degraders JQ1–XcN and JQ1–XcQ for functional engagement of CRBN and target protein degradation in cells. d, Western blot analysis of BRD4 after treatment of HEK293T cells with the indicated glutarimide degrader over 1–100 nM. The normalized intensity of the BRD4 band is shown below the blot. e, Western blot of BRD4 after treatment of wild-type (WT) or CRBN-knockdown (CRBN-KD; using short hairpin RNA) HEK293T cells with the indicated degrader. f, Western blot of BRD4 after treatment of HEK293T cells with one of the three epimers of JQ1–FcQ at 100 nM. g, Western blot of BRD4 after co-treatment of HEK293T cells with JQ1–FcQ and lenalidomide or Boc–FcQ. h, Western blot analysis of BRD4 levels after treatment of HEK293T cells with different concentrations of the indicated aspartimide degrader. All degradation assays were performed with 4 h incubation. All western blot data are representative of at least two independent replicates. For uncropped western blot images, see Supplementary Fig. 6.
Fig. 2 ∣
Fig. 2 ∣. Engagement of CRBN and ternary complex formation by dipeptide degraders, but not the dipeptides alone.
a, The relative area under the curve (AUC) from AlphaScreen for ternary complex formation between GST–BRD4(BD2) and His6–CRBN–DDB1 in the presence of the indicated degrader normalized to dBET6. AlphaScreen data are representative of three replicates. Data are mean ± s.e.m. b,c, Quantitative proteomics of co-immunoprecipitated proteins from lysates of HEK-CRBN cells overexpressing IKZF1 after 2 h incubation with 1 μM pomalidomide (Pom) (b) or FcQ (c). Protein concentrations were normalized to the amount of CRBN in each channel. One-way ANOVA with Tukey’s honest significant difference (HSD) post hoc test. d,e, Quantitative proteomics of MM.1S cells after 10 h treatment with 10 μM pomalidomide (d) or Boc–FcQ (e). P-values by t-test (background) method. f, Western blot of IKZF1 after treatment with 10 μM of the indicated compound in MM.1S cells. Western blot data are representative of three independent replicates. Len, lenalidomide. g, Cell viability (MTT) assay of the indicated compounds after treatment of MM.1S cells for five days. Data are mean ± s.d. (n = 4 biologically independent samples). All proteomics experiments were performed in biological triplicates. For uncropped western blot images, see Supplementary Fig. 7.
Fig. 3 ∣
Fig. 3 ∣. C-terminal cyclic imides are degrons that promote CRBN-dependent ubiquitination and degradation.
a, The sortase system used to generate degron-tagged GFP from GFP–LPETG–His6. b, In vitro ubiquitination of GFP tagged with C-terminal cyclic imide with K0 ubiquitin. c, Quantification of ubiquitinated protein band intensity in the experiment shown in b across three replicates. d, In vitro ubiquitination of GFP tagged with uncyclized C-terminal glutamine or asparagine with K0 ubiquitin. e, Quantification of ubiquitinated protein band intensity in experiment shown in d across three replicates. f, Flow cytometry analysis of GFP in wild-type or CRBN-knockout (KO) HEK293T cells 6 h after electroporation with GFP tagged with the indicated peptide. g, Flow cytometry analysis of GFP in HEK293T cells 6 h after electroporation with GFP tagged with the indicated peptide. GFP–His6, GFP–His6 (no sortase treatment). h, Flow cytometry analysis of the GFP in HEK293T cells 6 h after electroporation with GFP tagged with the indicated peptide, with or without lenalidomide competition (100 μM). Data are mean ± s.d. One-way ANOVA with Šídák’s multiple comparisons test. P-values are shown. Western blot and flow cytometry data are representative of three independent replicates. For uncropped western blot images, see Supplementary Fig. 7.
Fig. 4 ∣
Fig. 4 ∣. C-terminal cyclic imides are PTMs that form readily in vitro.
a, Schematic of cyclic imide formation, which reveals a degron for CRBN, and the subsequent hydrolysis product. b, Unique proteins and peptides with at least one cN or cQ modification in CPTAC global proteomics datasets. c, Frequency chart of the sequence alignment flanking the amino acids in poitions −5 to +5 relative to cN and cQ sites observed in CPTAC datasets. Alignment generated by weblogo.berkeley.edu. d, Schematic of HBA and HBB sequences. Peptides with cQ or cN modifications observed with trypsin or chymotrypsin digestion and mass spectrometry analysis are underlined: global datasets, blue; RBC tryptic peptides, pink; RBC chymotryptic peptides, orange; recombinant HBB tryptic peptides, brown. Modification sites are shown in red. e, In vitro time course of the formation of ACTB(96–cN111) and ACTB(96–N111) from the synthetic peptide representing ACTB(96–113). f, In vitro time course of the formation of HBB(42–cN58) and HBB(42–N58) from full-length recombinant HBB protein. Quantification was performed by selected ion monitoring. Data are mean ± s.d. (n = 3 biologically independent samples). Unpaired two-tailed t-test; P-values are shown. g, Quantification of HBB(42–cN58) and HBB(42–N58) from HBB(42–60) peptide and recombinant HBB protein after 144 h of incubation. h, Quantification of HBB(42–cN58) and HBB(42–N58) in two RBC donors by selected ion monitoring.
Fig. 5 ∣
Fig. 5 ∣. CRBN regulates recombinant and endogenous substrates bearing C-terminal cyclic imides.
a, Schematic of HBB(1–cQ132) (HBB native sequence with C-terminal glutarimide at residue 132 instead ofglutamine) and its methylated derivative HBB(1–Me132). b, Quantification of mono-, di- and tri-mono-ubiquitinated HBB band intensity from in vitro ubiquitination of HBB(1–cQ132) or HBB(1–Me132) with K0 ubiquitin. Ordinary one-way ANOVA with Šídák’s multiple comparisons test. Data are mean ± s.d. (n = 3 biologically independent samples). c, Volcano plot of peptide groups bearing C-terminal cyclic imides in HEK293T cells treated without or with 200 μM lenalidomide over 48 h. Upregulated proteins at 1% FDR (red) or 5% FDR (pink); ACTB(96–cN111) peptide (blue). One-way ANOVA with Tukey’s HSD post hoc test. d, Volcano plot of peptide groups bearing C-terminal cyclic imides in MM.1S cells treated with DMSO or 200 μM lenalidomide over 48 h. Upregulated proteins at 1% FDR (red) or 5% FDR (pink); ACTB(96–cN111) peptide (blue). One-way ANOVA with Tukey’s HSD post hoc test. e,f, Quantification of ACTB(96–cN111) and ACTB(96–N111) in HEK293T (e) or MM.1S (f) cells treated with DMSO or 200 μM lenalidomide over 48 h, using SIM. Data are mean ± s.d. (n = 4 biologically independent samples). Unpaired two-tailed t-test; P-values are shown.

Comment in

  • A closer look at molecular glues.
    Crunkhorn S. Crunkhorn S. Nat Rev Drug Discov. 2022 Dec;21(12):880. doi: 10.1038/d41573-022-00184-1. Nat Rev Drug Discov. 2022. PMID: 36323853 No abstract available.

References

    1. Ito T et al. Identification of a primary target of thalidomide teratogenicity. Science 327, 1345–1350 (2010). - PubMed
    1. Krönke J et al. Lenalidomide causes selective degradation of IKZF1 and IKZF3 in multiple myeloma cells. Science 343, 301–305 (2014). - PMC - PubMed
    1. Lu G et al. The myeloma drug lenalidomide promotes the cereblon-dependent destruction of ikaros proteins. Science 343, 305–309 (2014). - PMC - PubMed
    1. Krönke J et al. Lenalidomide induces ubiquitination and degradation of CK1α in del(5q) MDS. Nature 523, 183–188 (2015). - PMC - PubMed
    1. Winter GE et al. Phthalimide conjugation as a strategy for in vivo target protein degradation. Science 348, 1376–1381 (2015). - PMC - PubMed

Publication types