. 2022 Oct;610(7932):461-466.
doi: 10.1038/s41586-022-05206-x. Epub 2022 Oct 19.

A 0.6 Mpc H I structure associated with Stephan's Quintet

Affiliations

A 0.6 Mpc H I structure associated with Stephan's Quintet

C K Xu et al. Nature. 2022 Oct.

Abstract

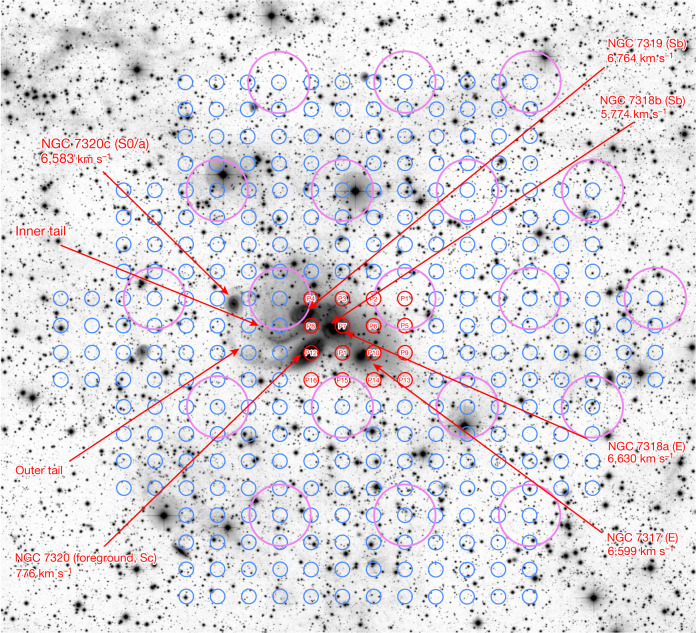
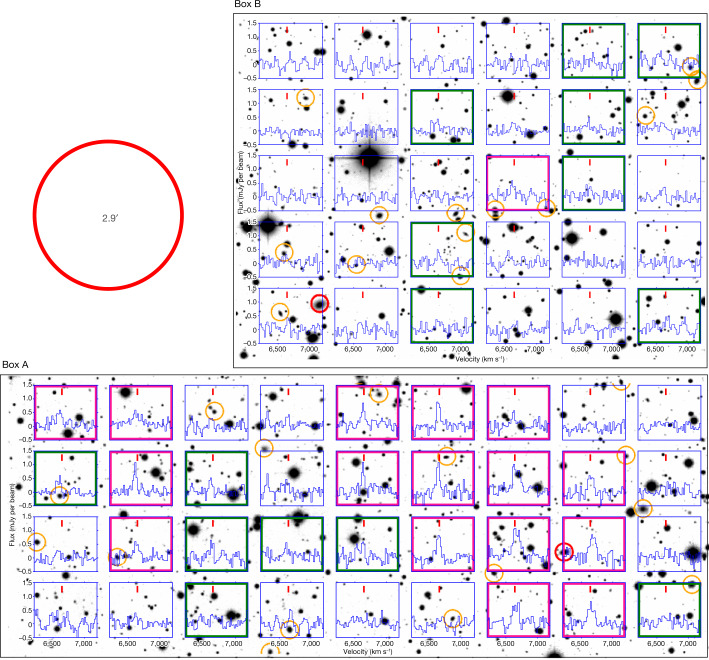
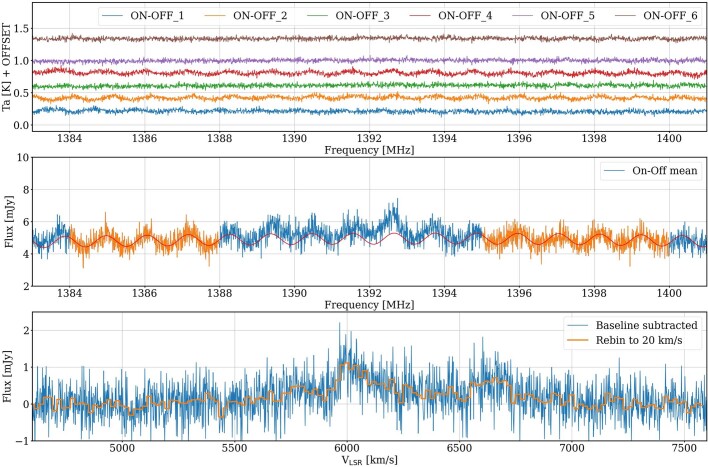
Stephan's Quintet (SQ, co-moving radial distance = 85 ± 6 Mpc, taken from the NASA/IPAC Extragalactic Database (NED)1) is unique among compact groups of galaxies2-12. Observations have previously shown that interactions between multiple members, including a high-speed intruder galaxy currently colliding into the intragroup medium, have probably generated tidal debris in the form of multiple gaseous and stellar filaments6,8,13, the formation of tidal dwarfs7,14,15 and intragroup-medium starbursts16, as well as widespread intergalactic shocked gas5,10,11,17. The details and timing of the interactions and collisions remain poorly understood because of their multiple nature18,19. Here we report atomic hydrogen (H I) observations in the vicinity of SQ with a smoothed sensitivity of 1σ = 4.2 × 1016 cm-2 per channel (velocity bin-width Δv = 20 km s-1; angular resolution = 4'), which are about two orders of magnitude deeper than previous observations8,13,20,21. The data show a large H I structure (with linear scale of around 0.6 Mpc) encompassing an extended source of size approximately 0.4 Mpc associated with the debris field and a curved diffuse feature of length around 0.5 Mpc attached to the south edge of the extended source. The diffuse feature was probably produced by tidal interactions in early stages of the formation of SQ (>1 Gyr ago), although it is not clear how the low-density H I gas (NH i ≲ 1018 cm-2) can survive the ionization by the intergalactic ultraviolet background on such a long time scale. Our observations require a rethinking of properties of gas in outer parts of galaxy groups and demand complex modelling of different phases of the intragroup medium in simulations of group formation.


Conflict of interest statement

The authors declare no competing interests.

Figures

Fig. 1
Fig. 1. Member galaxies plus main tidal features in SQ and the sky coverage of the FAST observations of the SQ field.
The background image is the inverted greyscale map of the deep Canada–France–Hawaii Telescope (CFHT) MegaCam r-band image. The NGC name, radial velocity and the Hubble type are provided for each member galaxy in SQ. The core members include NGC 7317, NGC 7318a and NGC 7319, which are located near the group centre and have similar radial velocities (6,680 ± 85 km s−1). NGC 7320c is an ‘old intruder’, which may be responsible for the formation of the inner and outer tails,. NGC 7318b is a ‘new intruder’, which is currently colliding into the intragroup medium of SQ and triggering a large scale shock. NGC 7320 is a foreground galaxy. The small blue circles mark the positions of individual beams in the H i mapping observations by the FAST 19-beam receiver. The observations were carried out at 16 slightly separated pointings in a 4 × 4 rectangular grid. The small red circles mark the central positions of the FAST 19-beam receiver in these pointings, and the characters P1, P2, …, P16 inside the circles identify the different pointings. The large magenta circles (D = 2.9′, that is, the half-power beam size) show the coverage of the 19 beams in the first pointing (see Methods for more details).
Fig. 2
Fig. 2. Illustrative plot of the 304 spectra of the H i emission in the SQ field.
The underlying optical colour image (u, g, r) is obtained in the deep CFHT MegaCam observation with limiting surface brightness of 29.0, 28.6 and 27.6 mag arcsec−2 for the three bands, respectively. The spectra cover the velocity range of 4,600–7,600 km s−1 with an average r.m.s. of 0.16 mJy per beam per channel (Δv = 20 km s−1). The centre of each spectrum coincides with the pointing position of the FAST beam with which it was obtained. The final data cube includes 304 spectra in 20 km s−1 bins. The red circle in the bottom-left corner shows the size of the FAST beam (2.9′, or 72.5 kpc on a linear scale).
Fig. 3
Fig. 3. The H i emission in the velocity range of 6,550–6,750 km s−1.
a, Contour map of the integrated H i emission in the velocity range of 6,550–6,750 km s−1 overlaid on the composite colour image (u, g, r) of the deep CFHT MegaCam observation. The red circle at the bottom right illustrates the angular resolution (half-power beam size = 4.0′) of the FAST map after smoothing. The contours start from NH i = 7.4 × 1017 cm−2 (at 5.5σ level) with an increment of a factor of 2. The red lines delineate the boundary of the FAST observations. The cyan contours in the centre are adopted from the VLA observations for the 6,600 km s−1 component of SQ, with angular resolution of 19.4″ × 18.6″. They have the base level at NH i = 5.8 × 1019 cm−2 and the increment of a factor of 2. The area occupied by the newly discovered diffuse feature is filled with a hatch pattern consisting of thin yellow dotted lines. The two green boxes marked by characters A and B cover the diffuse feature. b, False colour map of the velocity field of the H i emission in the velocity range of 6,550–6,750 km s−1 overlaid by the same contour map shown in a. The units of the x and y axes are in pixels (pixel size: 1.4′ × 1.2′), and the colour of every pixel represents the flux-density weighted mean velocity whose scale is given in the scale bar on the right. c, The H i spectrum of the diffuse feature. The red line is the summation of all spectra inside box A and the blue line the summation of those inside box B. The black line is the sum of the two spectra of boxes A and B.
Fig. 4
Fig. 4. Individual spectra in the diffuse feature region.
Individual spectra in box A and box B in Fig. 3a are overlaid on the inverted greyscale map of the CFHT MegaCam r-band image. The centre of each spectrum coincides with the pointing position of the FAST beam with which it was obtained. All spectra are plotted with the same velocity range of [6,200, 7,200] km s−1 and flux-density range of [−0.5, 1.5] mJy per beam. The short vertical red line on the top of every spectrum marks the position of v = 6,642 km s−1 (the flux-density-weighted mean velocity of the diffuse feature). The spectra with detections of S/N > 4 are identified by pink boxes and those with detections of 3 < S/N ≤ 4 by green boxes. Galaxies brighter than r = 20 mag are marked by red circles if they have photo-z < 0.1 or orange circles if they have photo-z ≥ 0.1. The large red circle in the upper-left corner (outside the boxes) illustrates the half-power beam size of the FAST observations.
Extended Data Fig. 1
Extended Data Fig. 1. Examples of intermediate products of spectral data reduction.
Upper Panel: Individual ON-OFF spectra obtained by beam M01 in Pointing 1 observation (i.e. the data obtained at the pixel P1 in Figure 1). An offset of 0.2 K is added to every spectrum relative to the previous one in order to make them separated from each other. Middle Panel: The mean of the ON-OFF spectra in the upper panel. The units of the flux density are converted from K to mJy using the gain factor taken from Extended Data Table 2. The red line shows the baseline model derived by fitting the parts of the spectrum free of signals (marked by orange color) using a sinusoidal (representing standing waves) plus a polynomial (for baseline gradient). Bottom Panel: The spectrum after the baseline removal. The frequency is converted to radial velocity in the optical convention relative to the local standard rest reference frame (LSR). The orange line presents the rebinned spectrum with the velocity bin-width of 20 km s−1.
Extended Data Fig. 2
Extended Data Fig. 2. Spectral R.M.S. noise of individual sky pixels.
Left: The false color image of the r.m.s. noise at different sky pixels. Right: Histogram of the distribution of the r.m.s. noise.
Extended Data Fig. 3
Extended Data Fig. 3. The HI emission in the velocity range of 6550–6750 km s−1 (unsmoothed).
Contour map of integrated HI emission (unsmoothed) in the velocity range of 6550–6750 km s−1 overlaid on the composite color image (u, g, r) of the deep CFHT MegaCam observation. The red circle at bottom-right illustrates the angular resolution (FWHM =2.9') of the FAST map (unsmoothed). The contours start from NHI = 7.4 × 1017 cm−2 (at 2-σ level) with an increment of a factor of 2. The red lines delineate the boundary of the FAST observations. The cyan contours in the center are adopted from the VLA observations for the 6600 component of SQ, with angular resolution of 19.4"×18.6". They have the base level at NHI = 5.8 × 1019 cm−2 and the increment of a factor of 2. The same Box A and Box B that mark the location of the diffuse feature in Figure 3a are plotted here to facilitate the comparison between the two figures.
Extended Data Fig. 4
Extended Data Fig. 4. Sidelobe contribution to the integrated HI emission in the velocity range of 6550–6750 km s−1.
False color image of the sidelobe contribution overlaid by the contour map of integrated HI emission in the velocity range of 6550–6750 km s−1 (before the sidelobe correction and after the convolution by a Gaussian kernel of FWHM = 2.8'). The contours start from 20 mJy km s−1 beam−1 (corresponding to NHI = 7.4 × 1017 cm−2 for the original beam of FWHM = 2.9') with an increment of a factor of 2.
Extended Data Fig. 5
Extended Data Fig. 5. HI spectra of NGC 7320a and Anon 7.
HI spectra of two newly detected HI sources (NGC 7320a and Anon 7) in the SQ neighborhood.
Extended Data Fig. 6
Extended Data Fig. 6. Optical spectrum of NGC 7320a.
Optical spectrum of NGC 7320a obtained at Lijiang 2.4 meter telescope. The vertical dotted lines mark the positions of corresponding emission/absorption lines redshifted according to the best-fit redshift z = 0.02243 (v = 6729 km s−1).

Comment in

References

    1. NASA/IPAC Extragalactic Database (NED) (NASA, 2022); https://ned.ipac.caltech.edu.
    1. Stephan ME. Nébuleuses nouvelles, découvertes et observées à l'Obsérvatoire de Marseille. C. r. hebd. séances l'Acad. sci. 1877;84:641–642.
    1. Hickson P. Systematic properties of compact groups of galaxies. Astrophys. J. 1982;255:382–391. doi: 10.1086/159838. - DOI
    1. Verdes-Montenegro L, et al. Where is the neutral atomic gas in Hickson groups? Astron. Astrophs. 2001;377:812–826. doi: 10.1051/0004-6361:20011127. - DOI
    1. Allen RJ, Hartsuiker JW. Radio continuum emission at 21 cm near Stephan's Quintet. Nature. 1972;239:324–325. doi: 10.1038/239324a0. - DOI - PubMed

Publication types