. 2022 Oct;610(7932):562-568.
doi: 10.1038/s41586-022-05299-4. Epub 2022 Oct 19.

Gut bacteria alleviate smoking-related NASH by degrading gut nicotine

Affiliations

Gut bacteria alleviate smoking-related NASH by degrading gut nicotine

Bo Chen et al. Nature. 2022 Oct.

Abstract

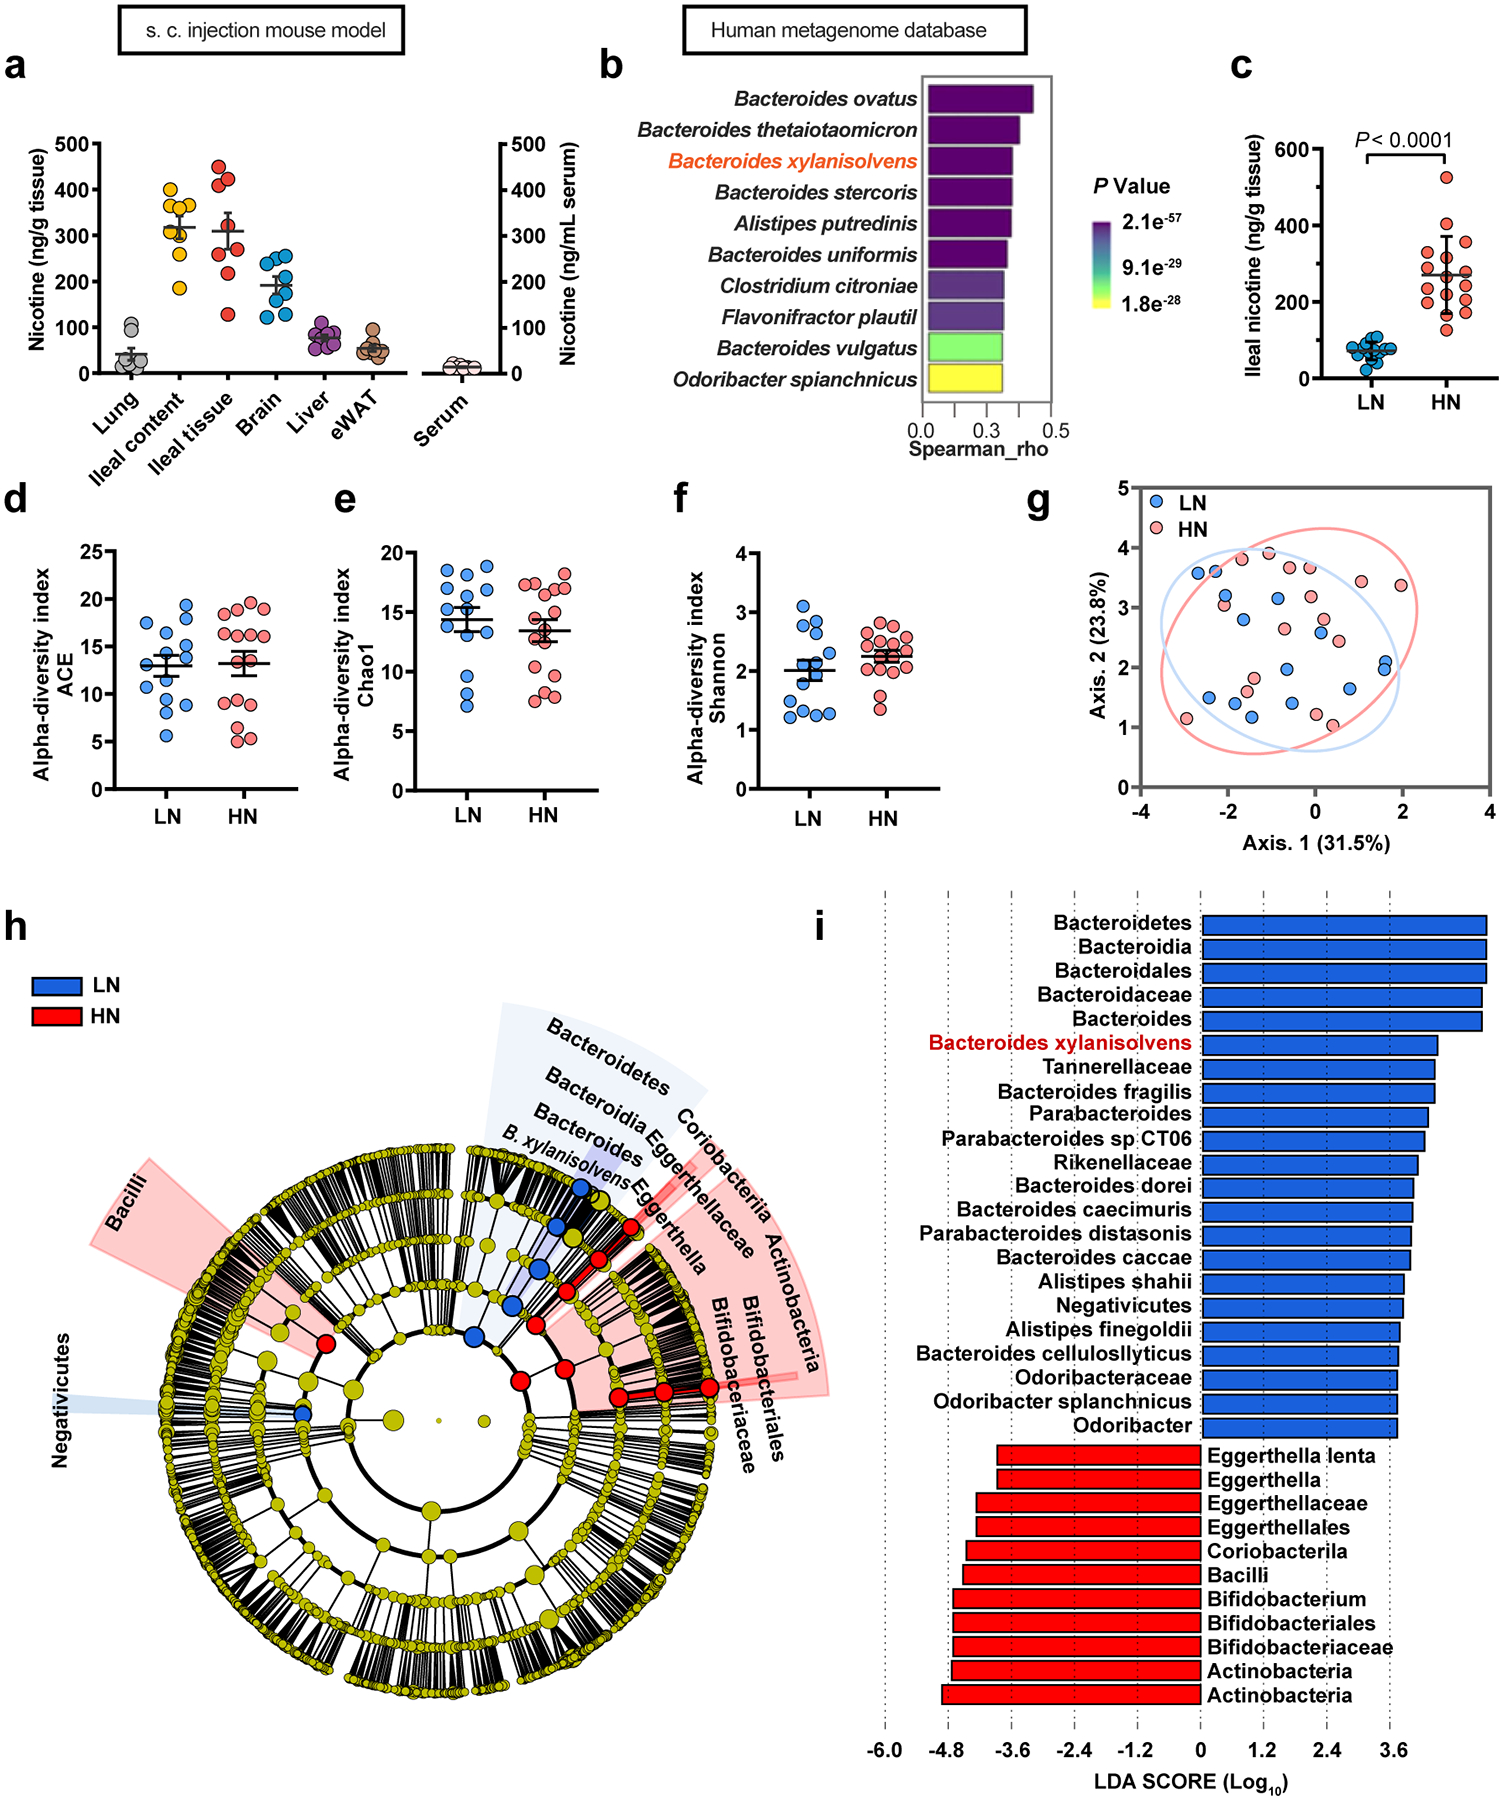
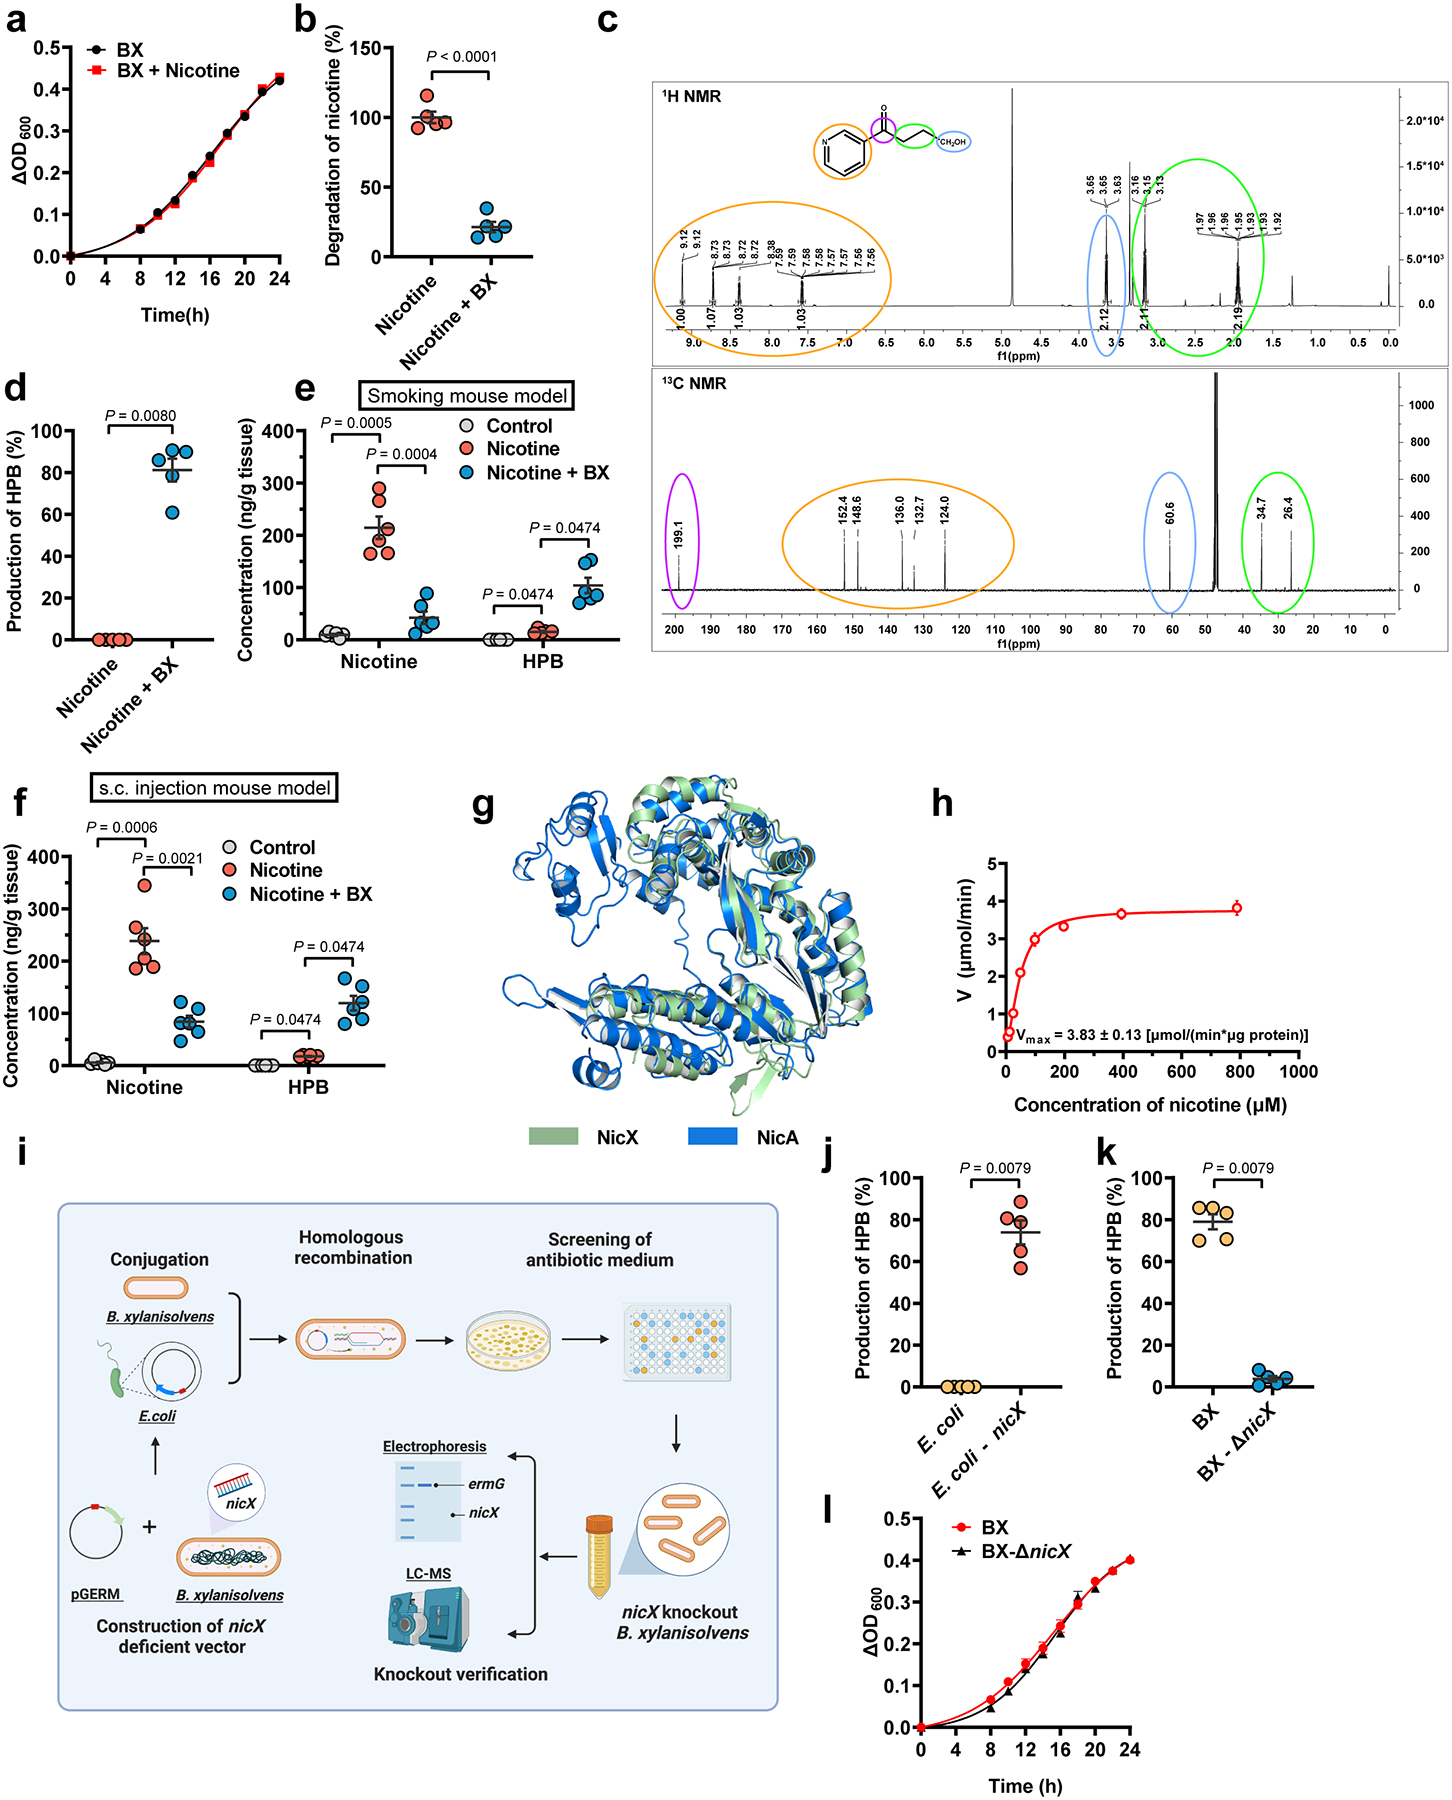
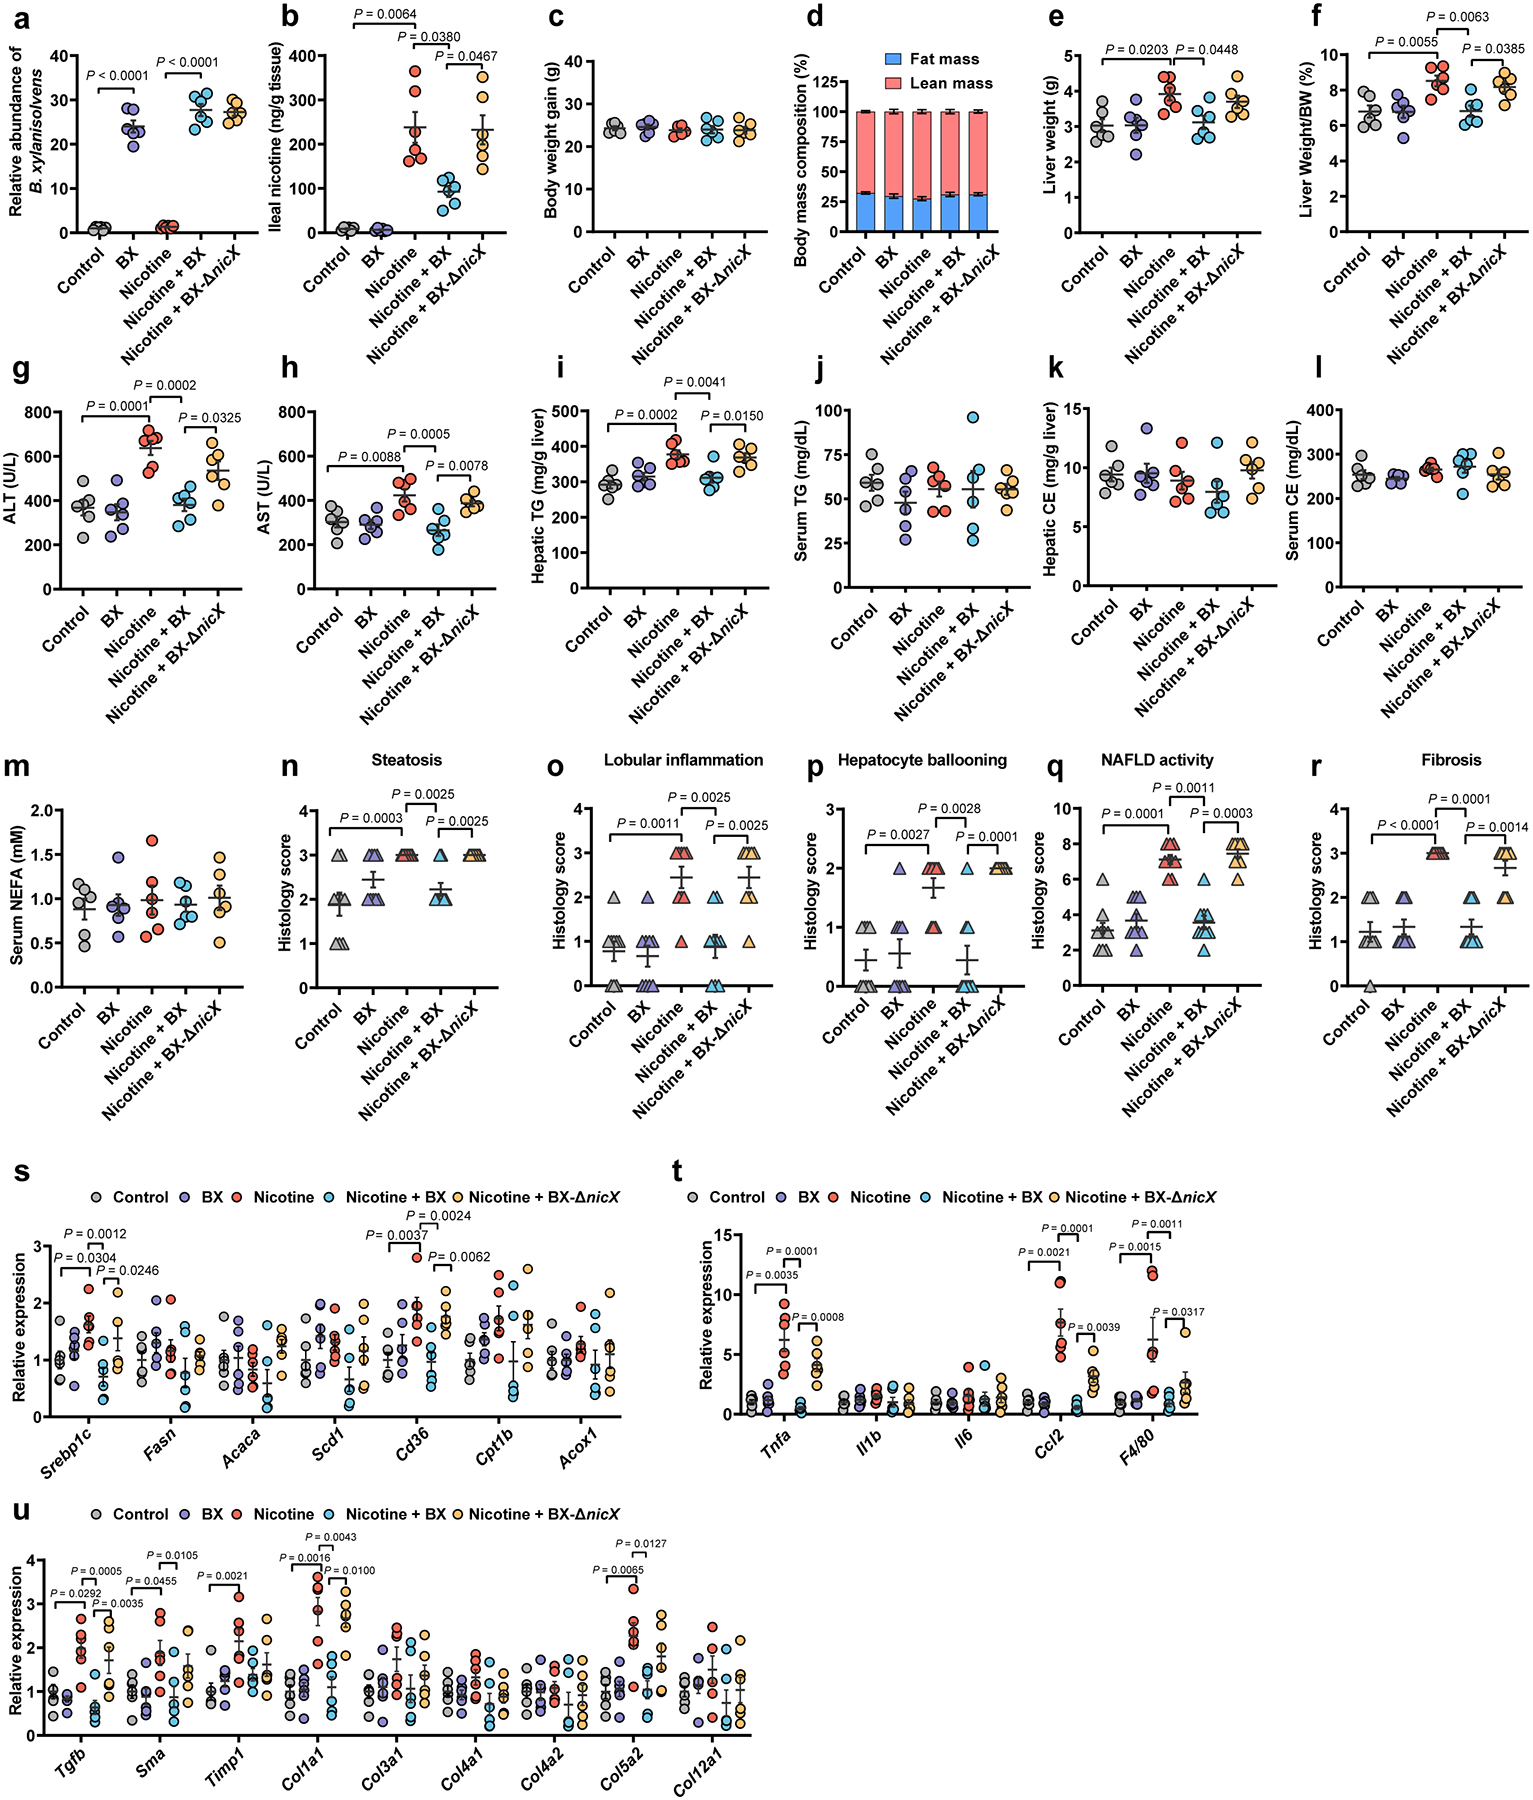
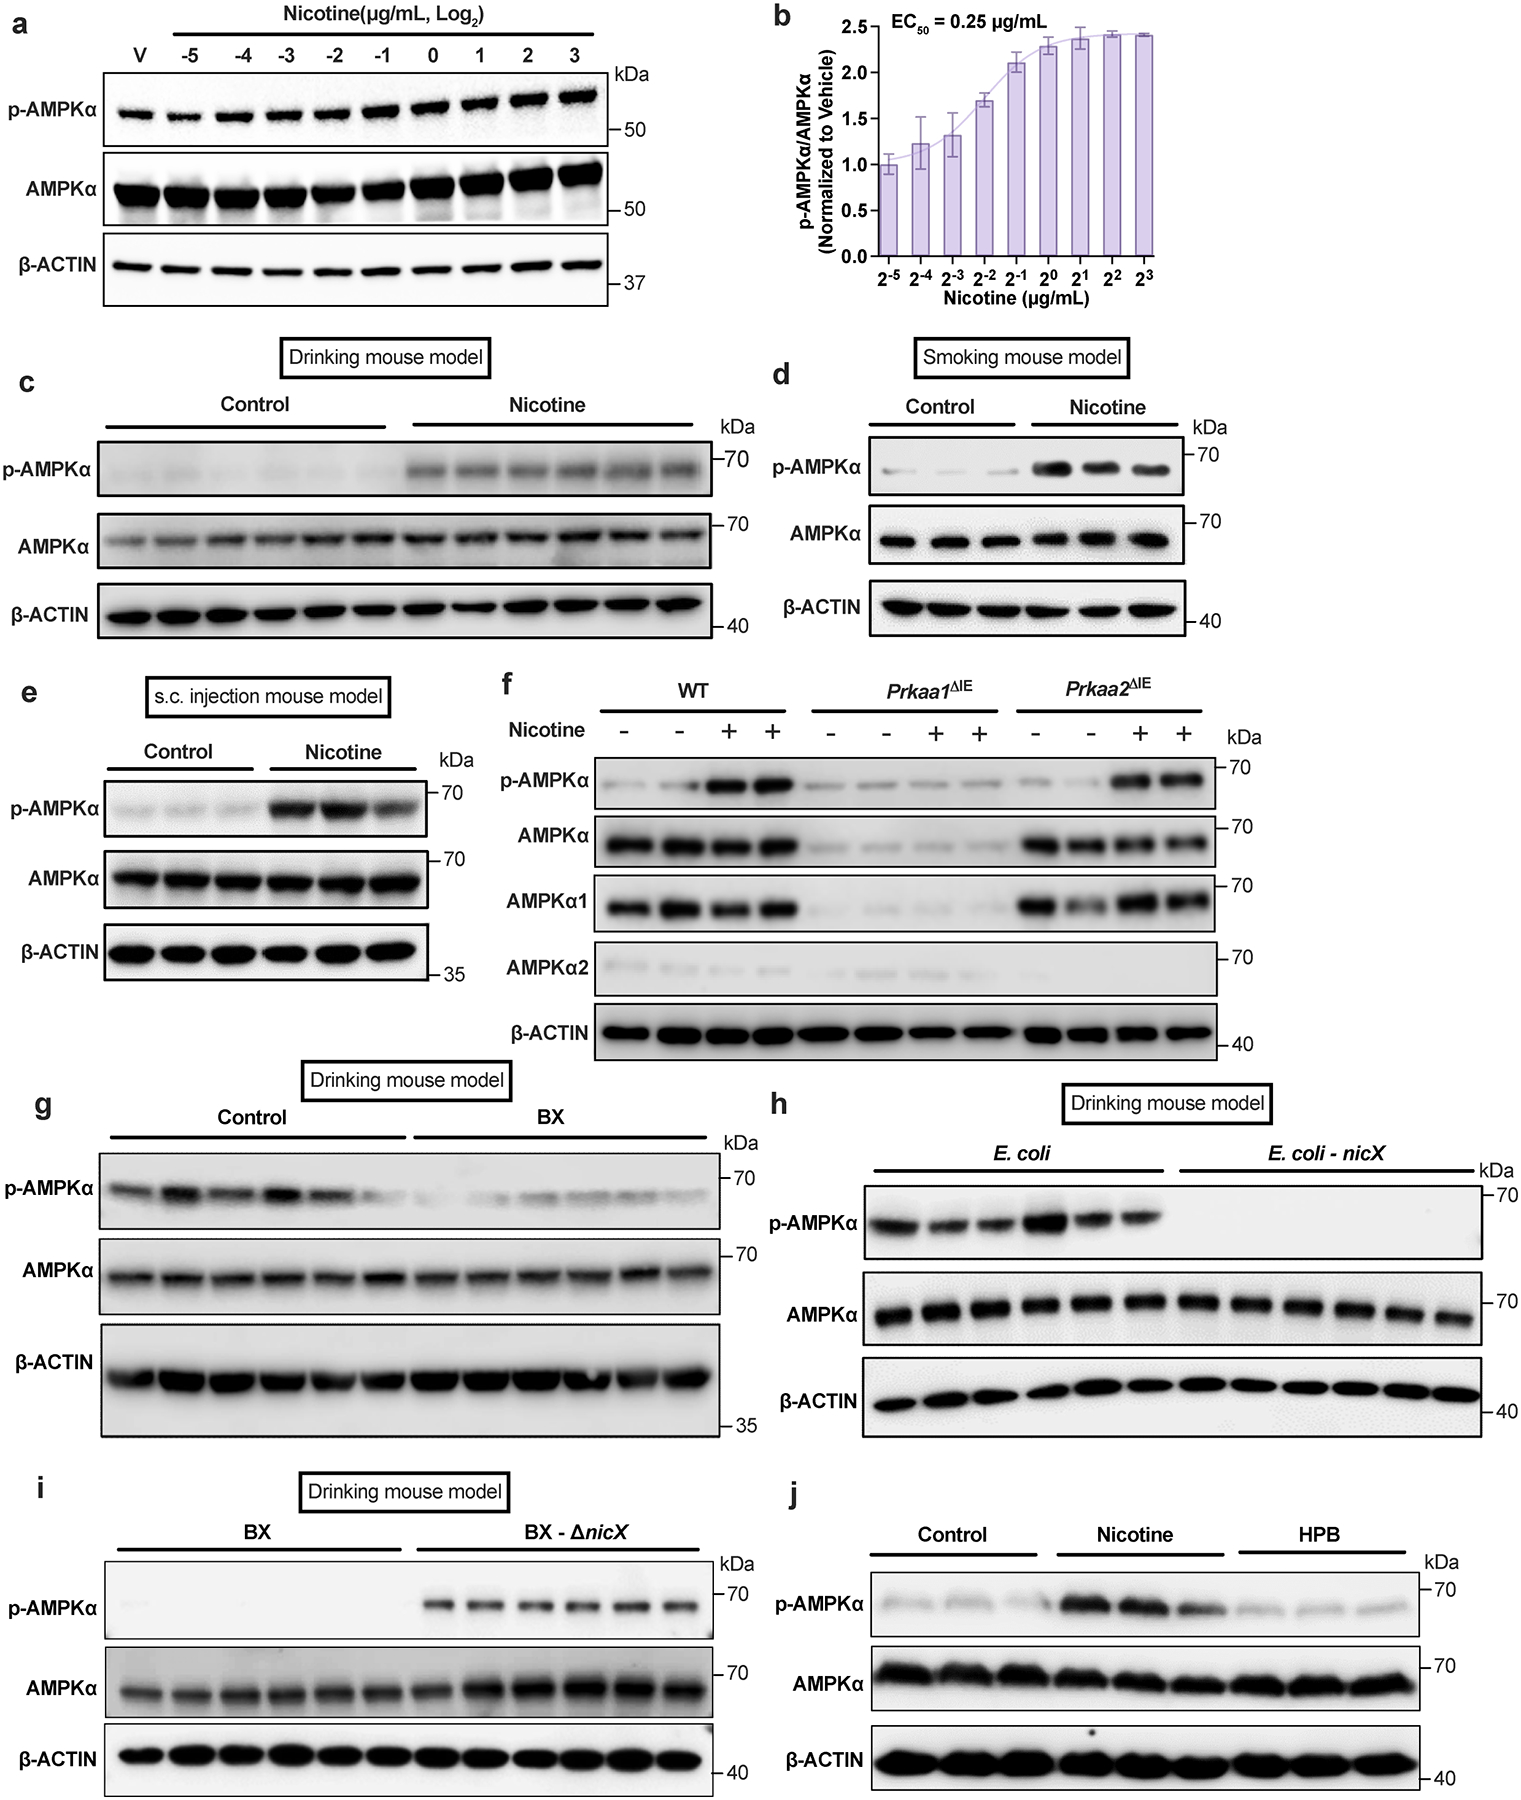
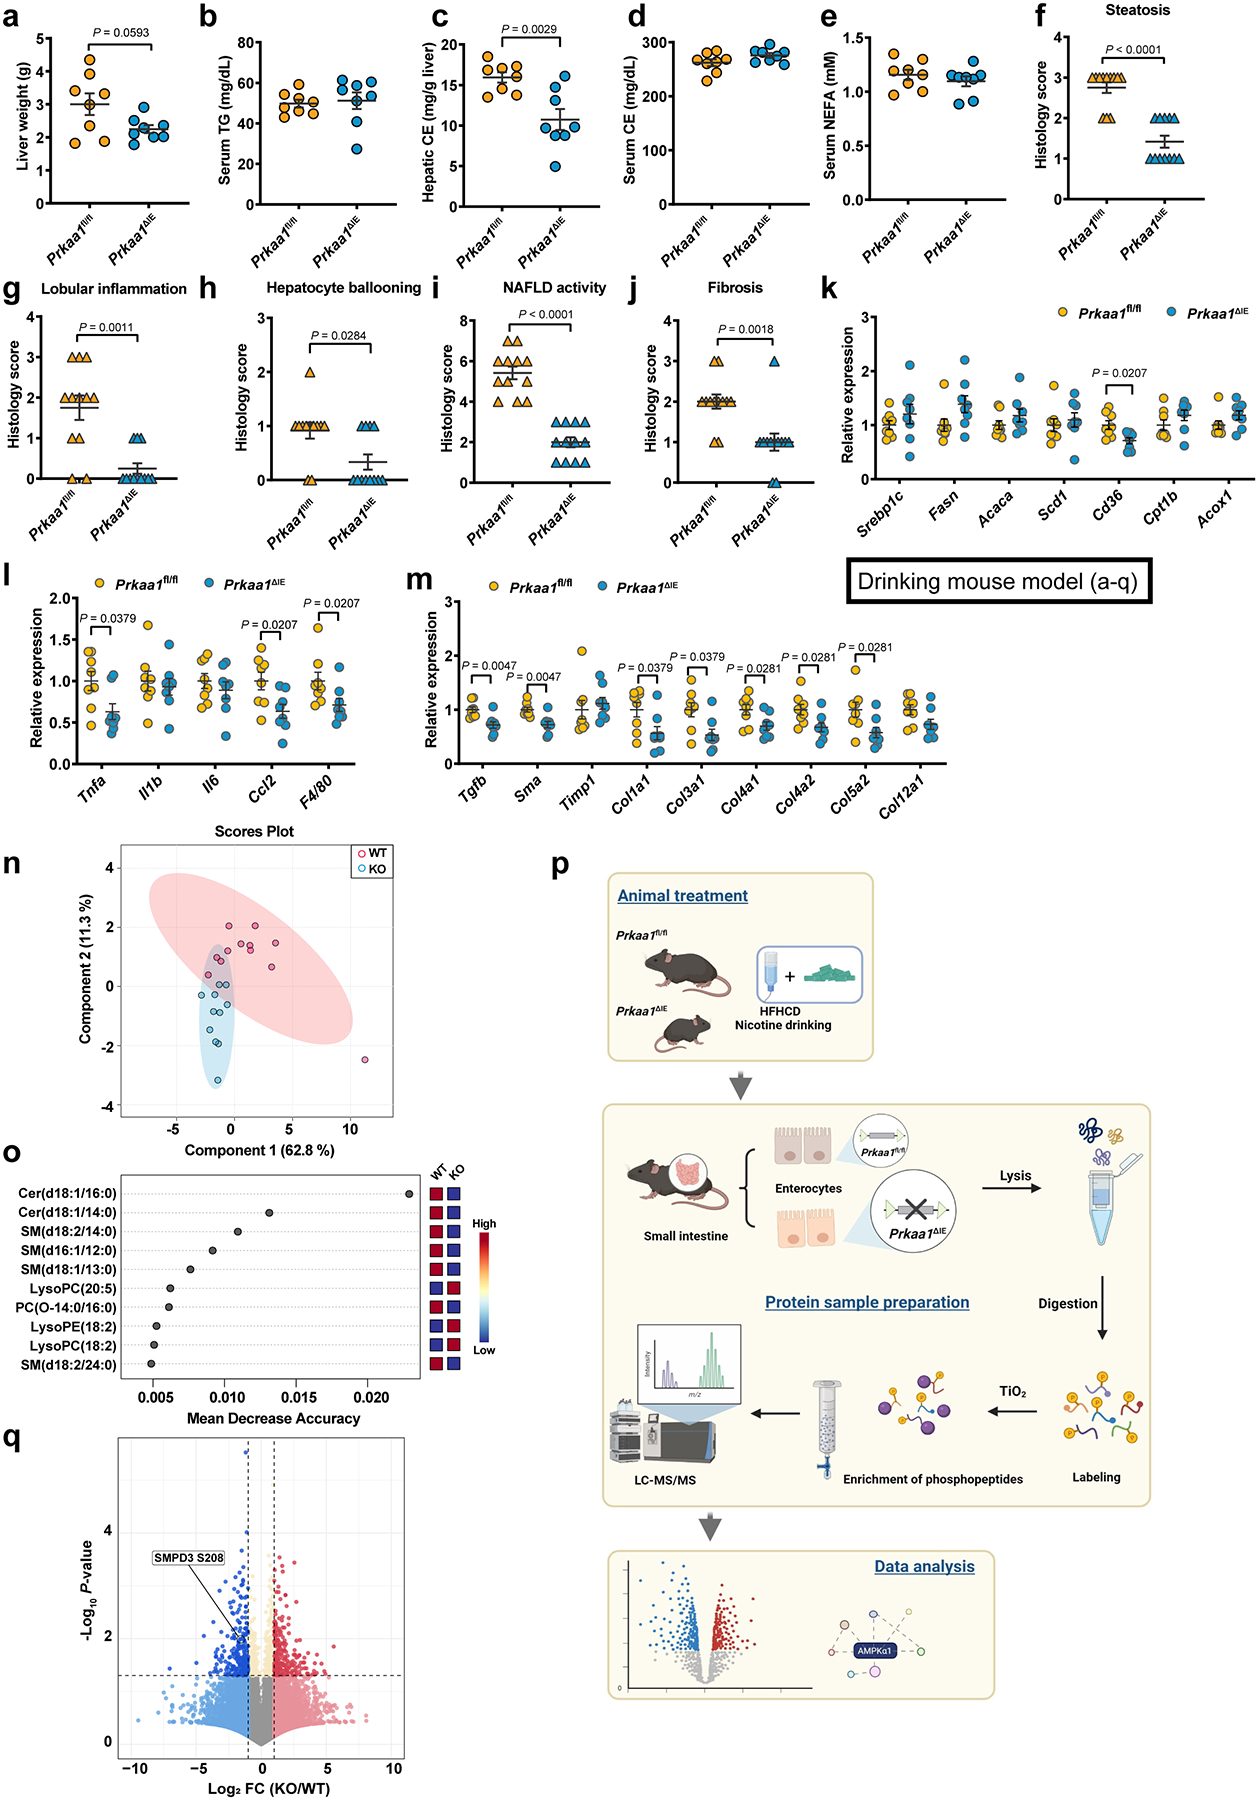
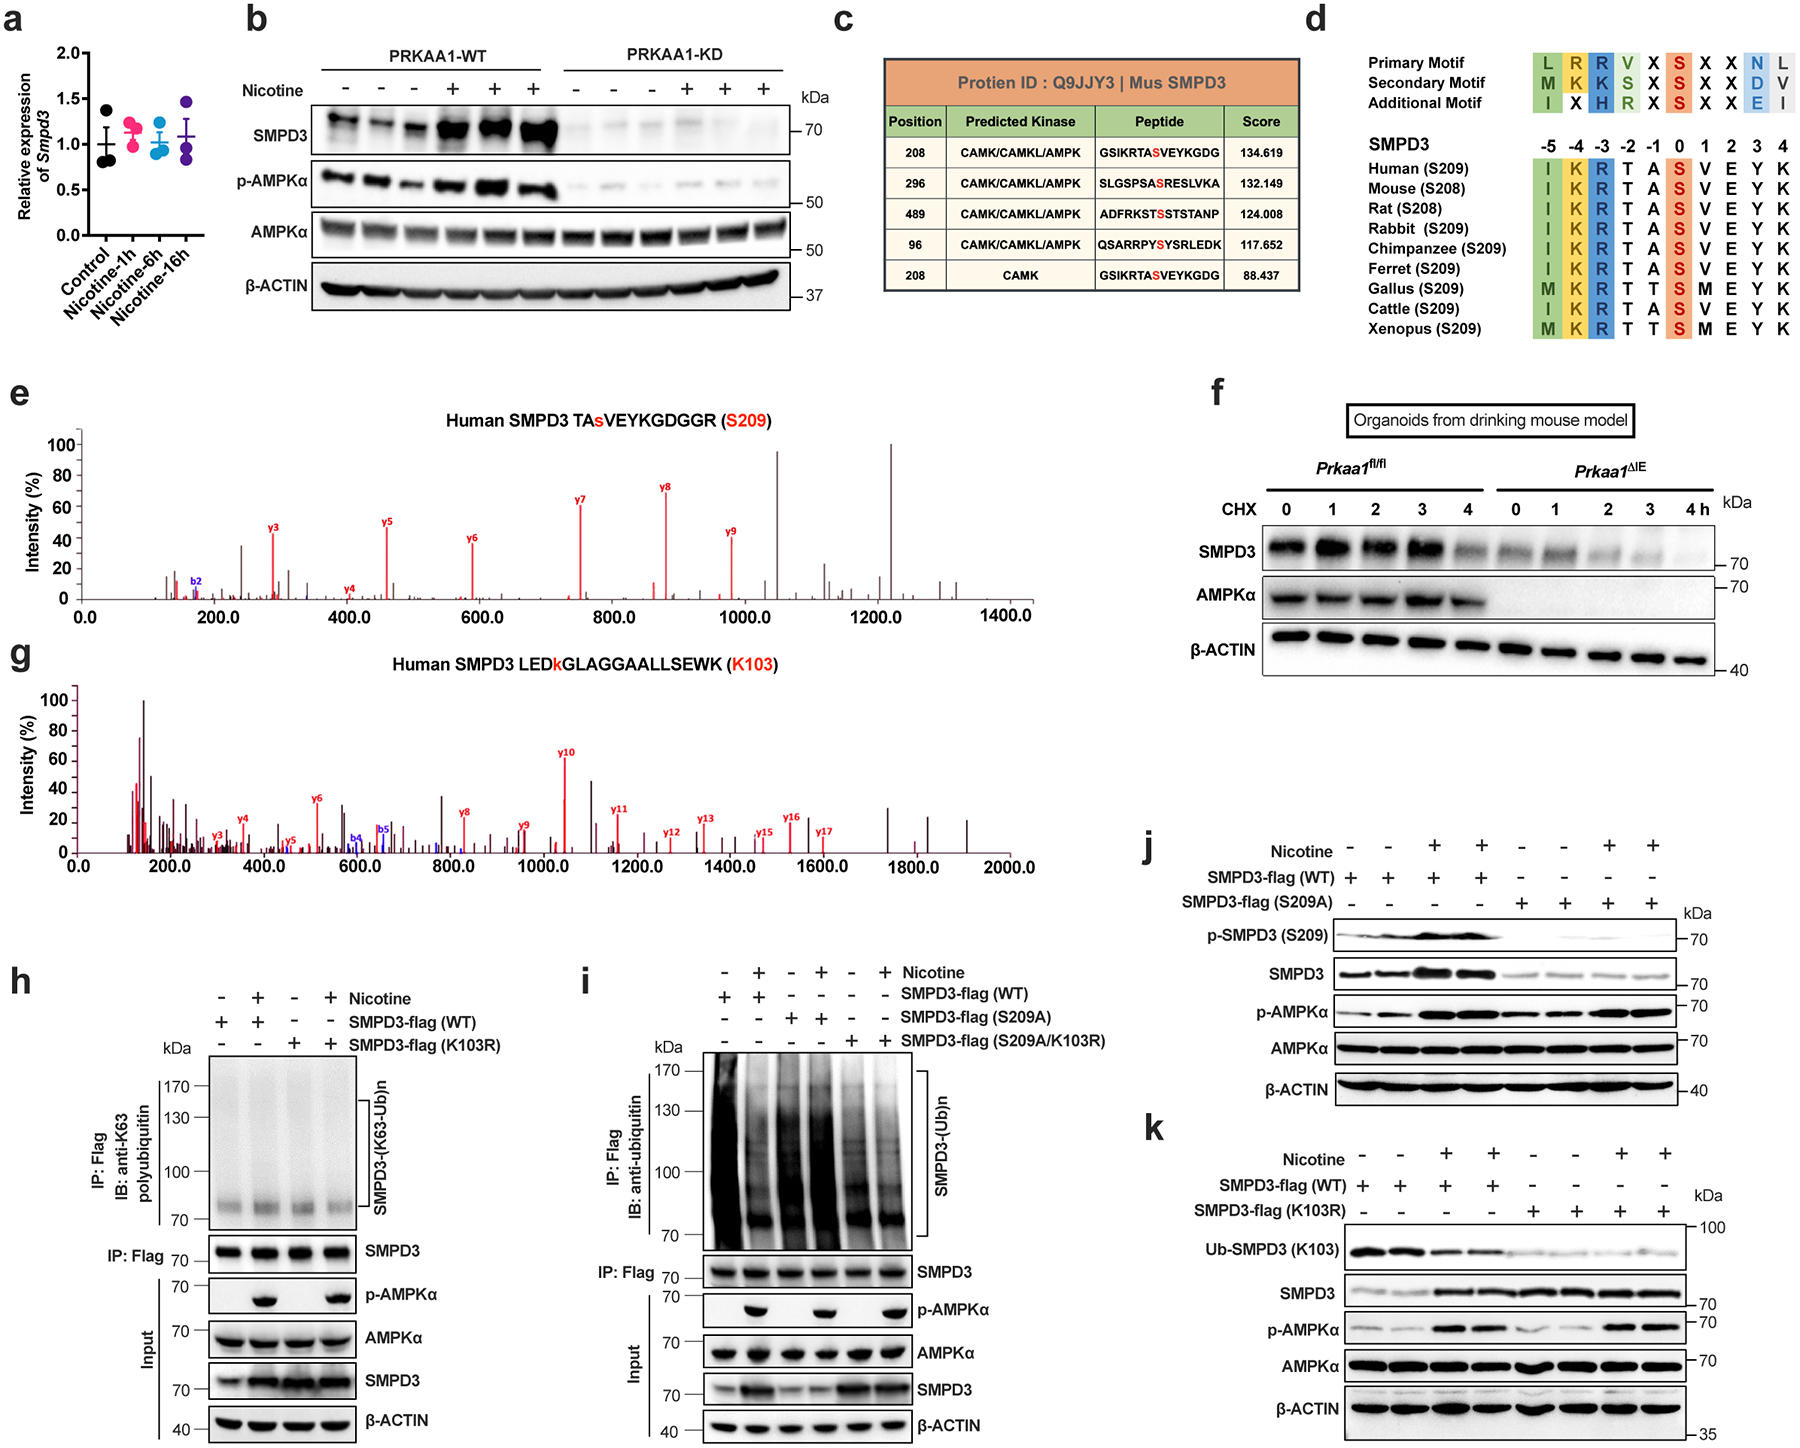
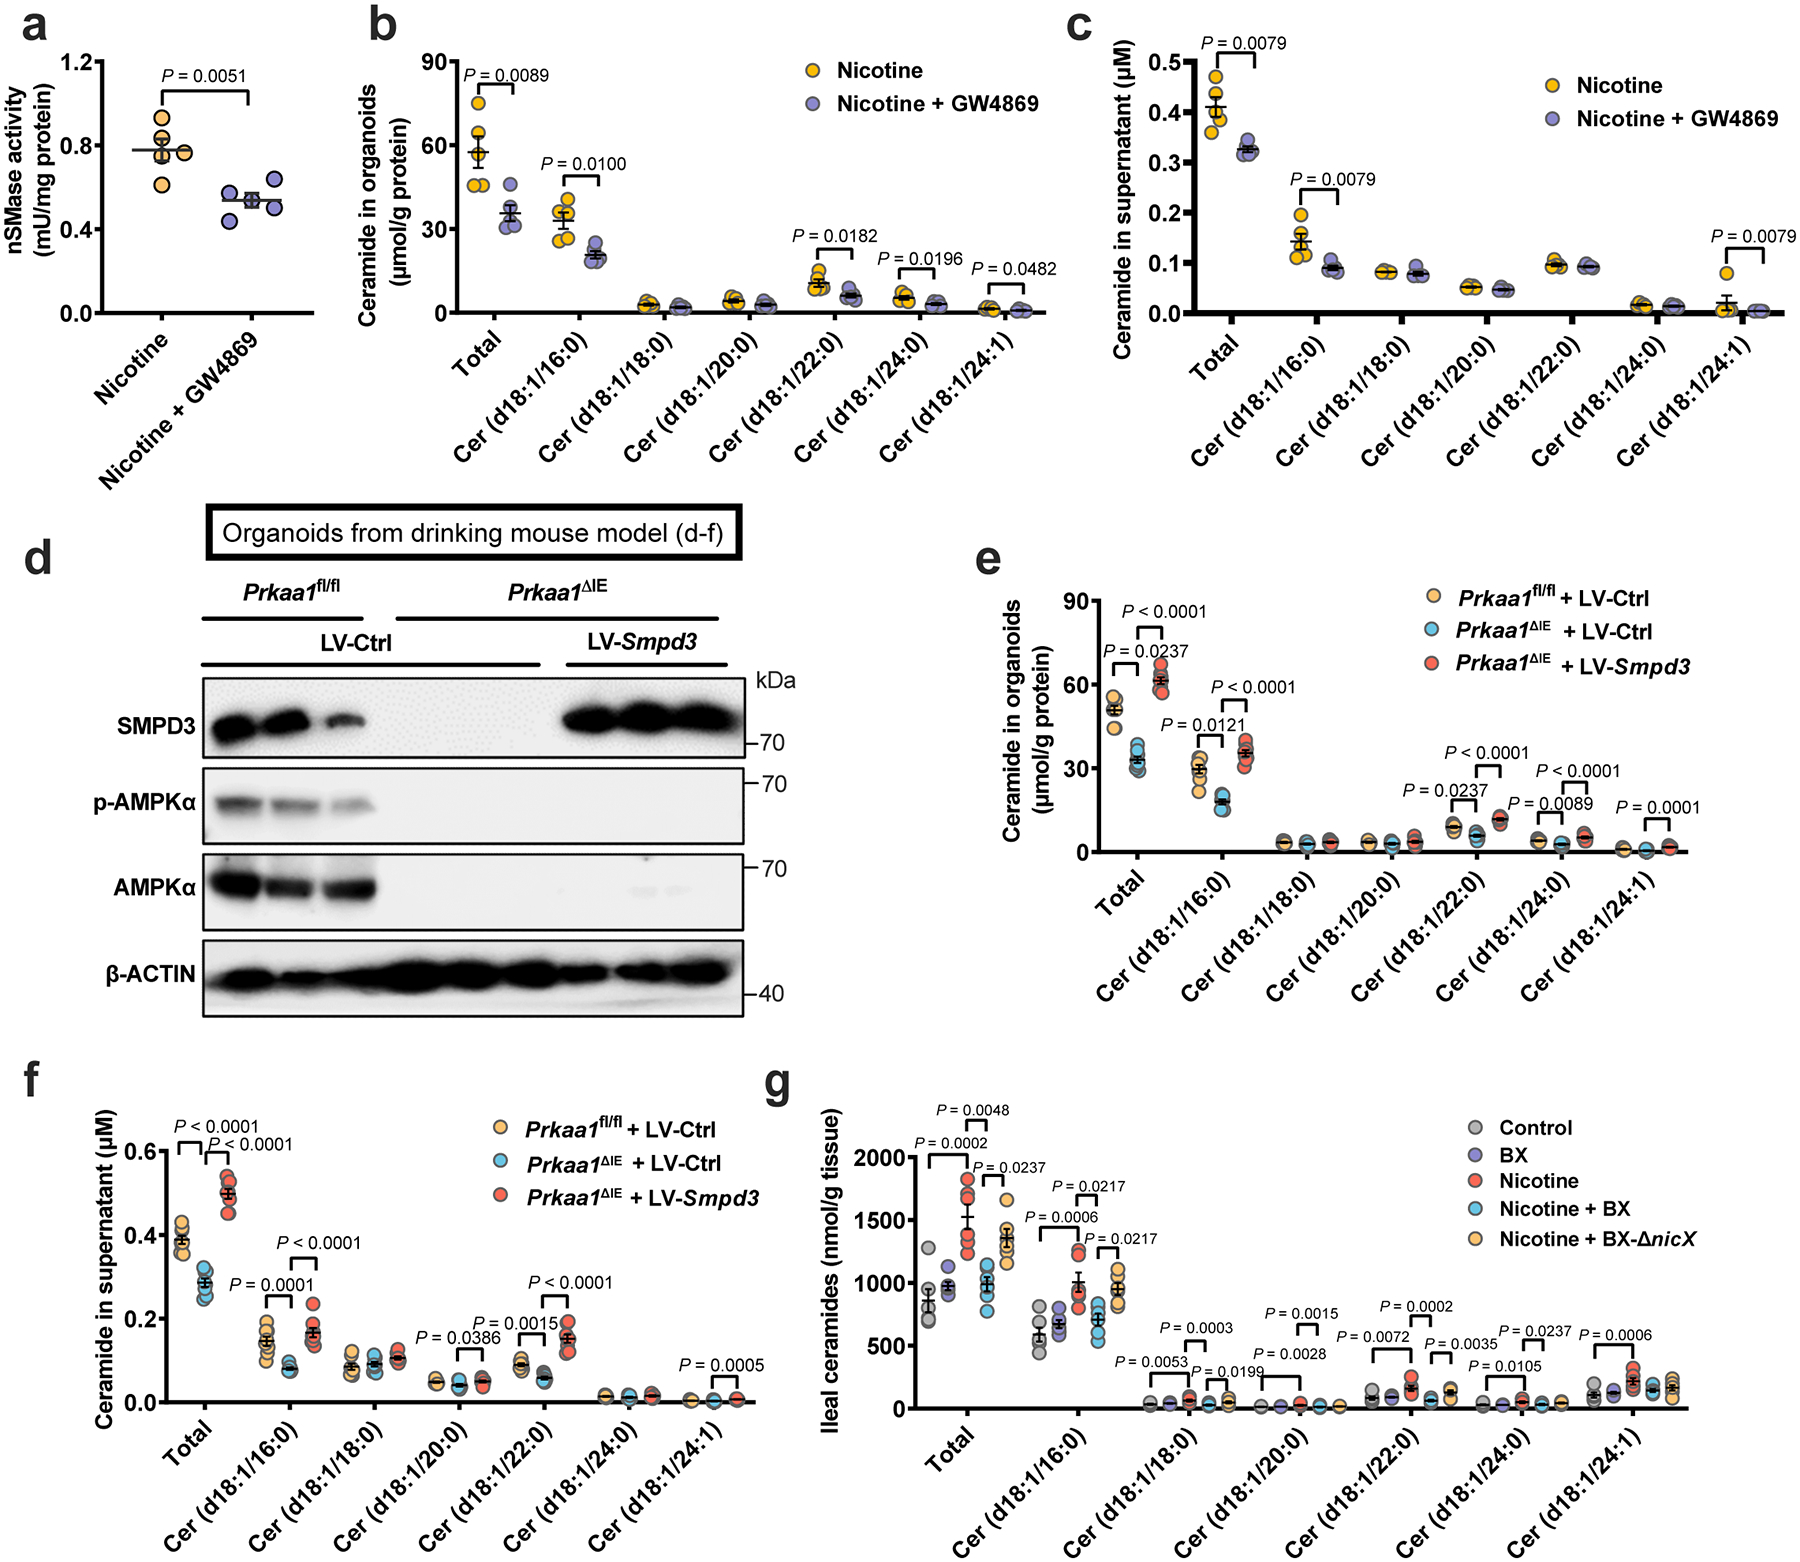
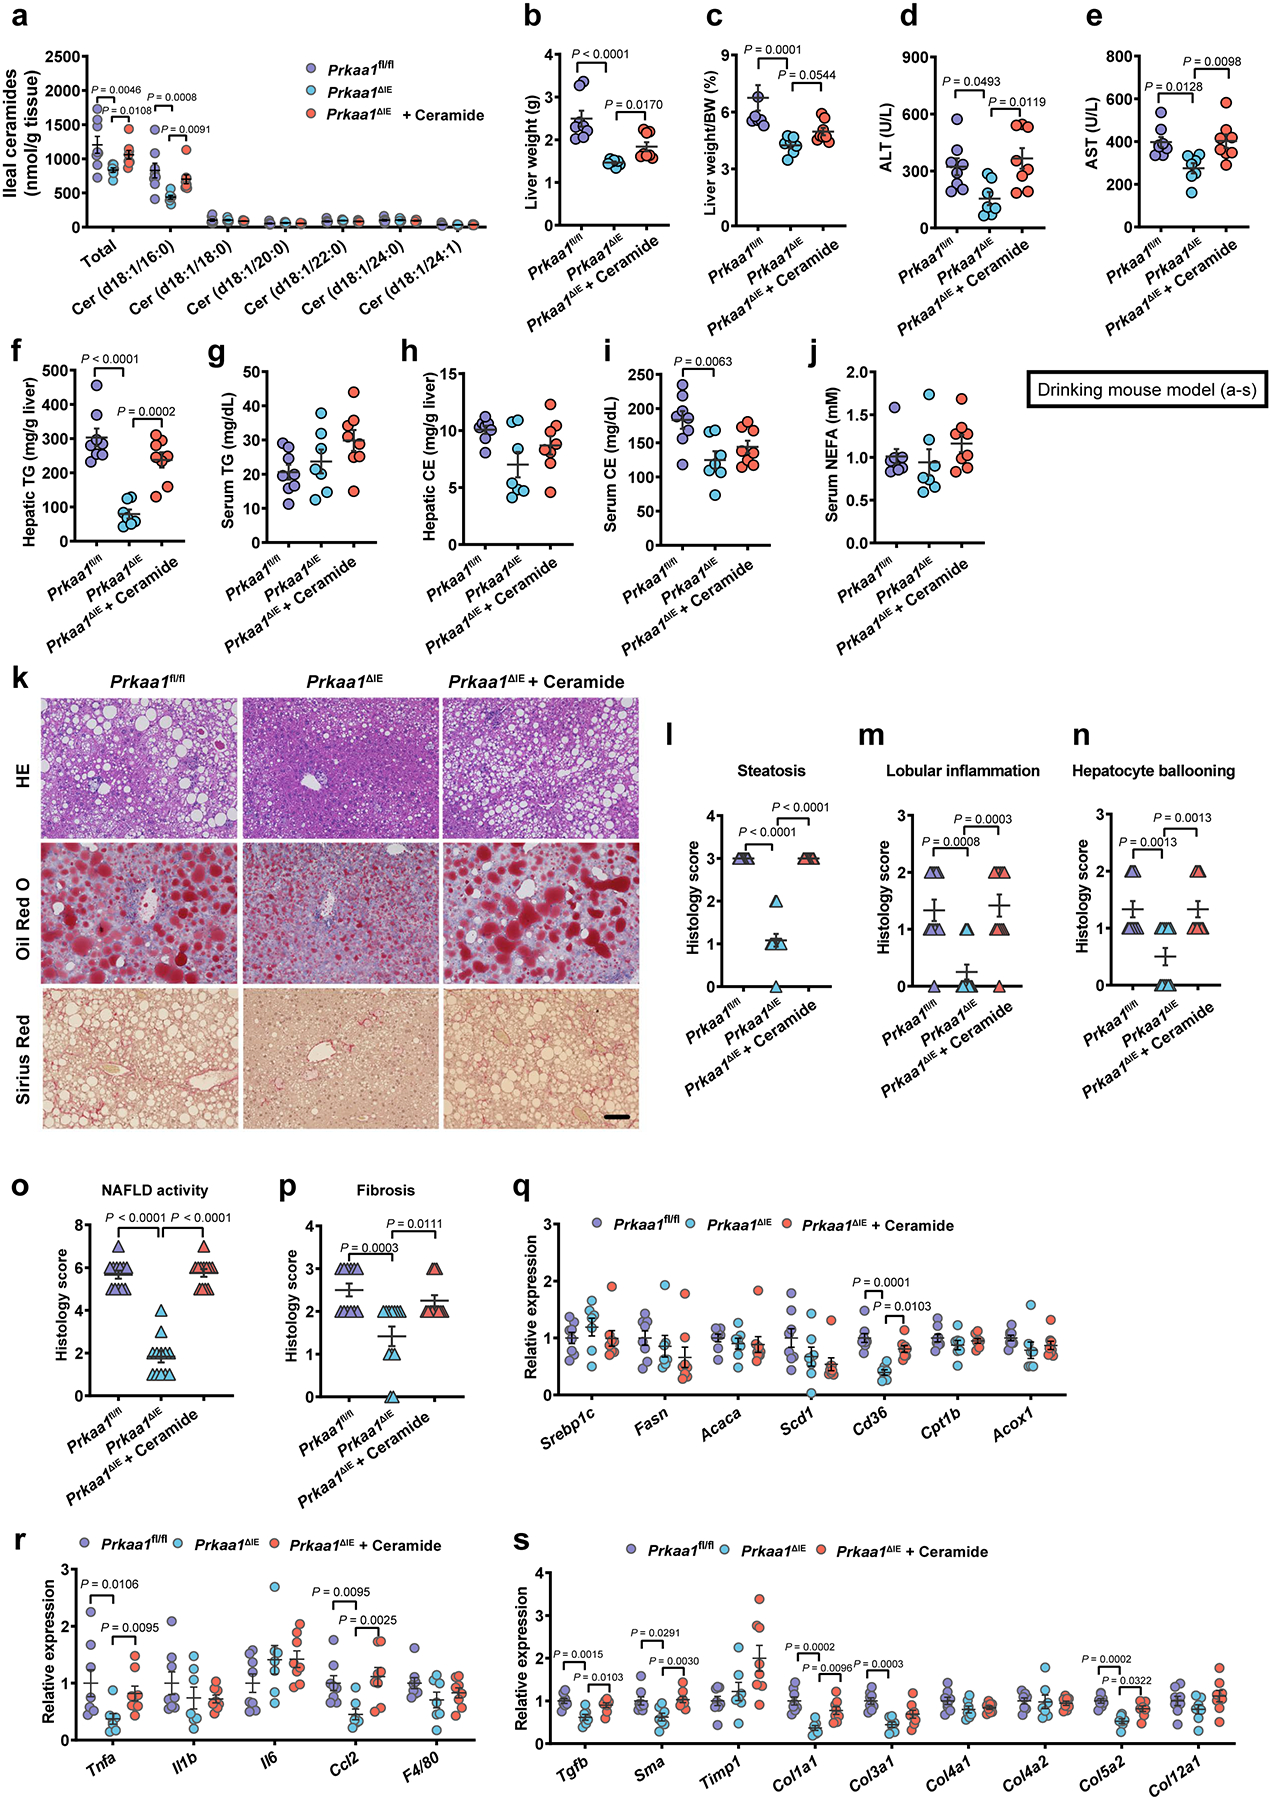
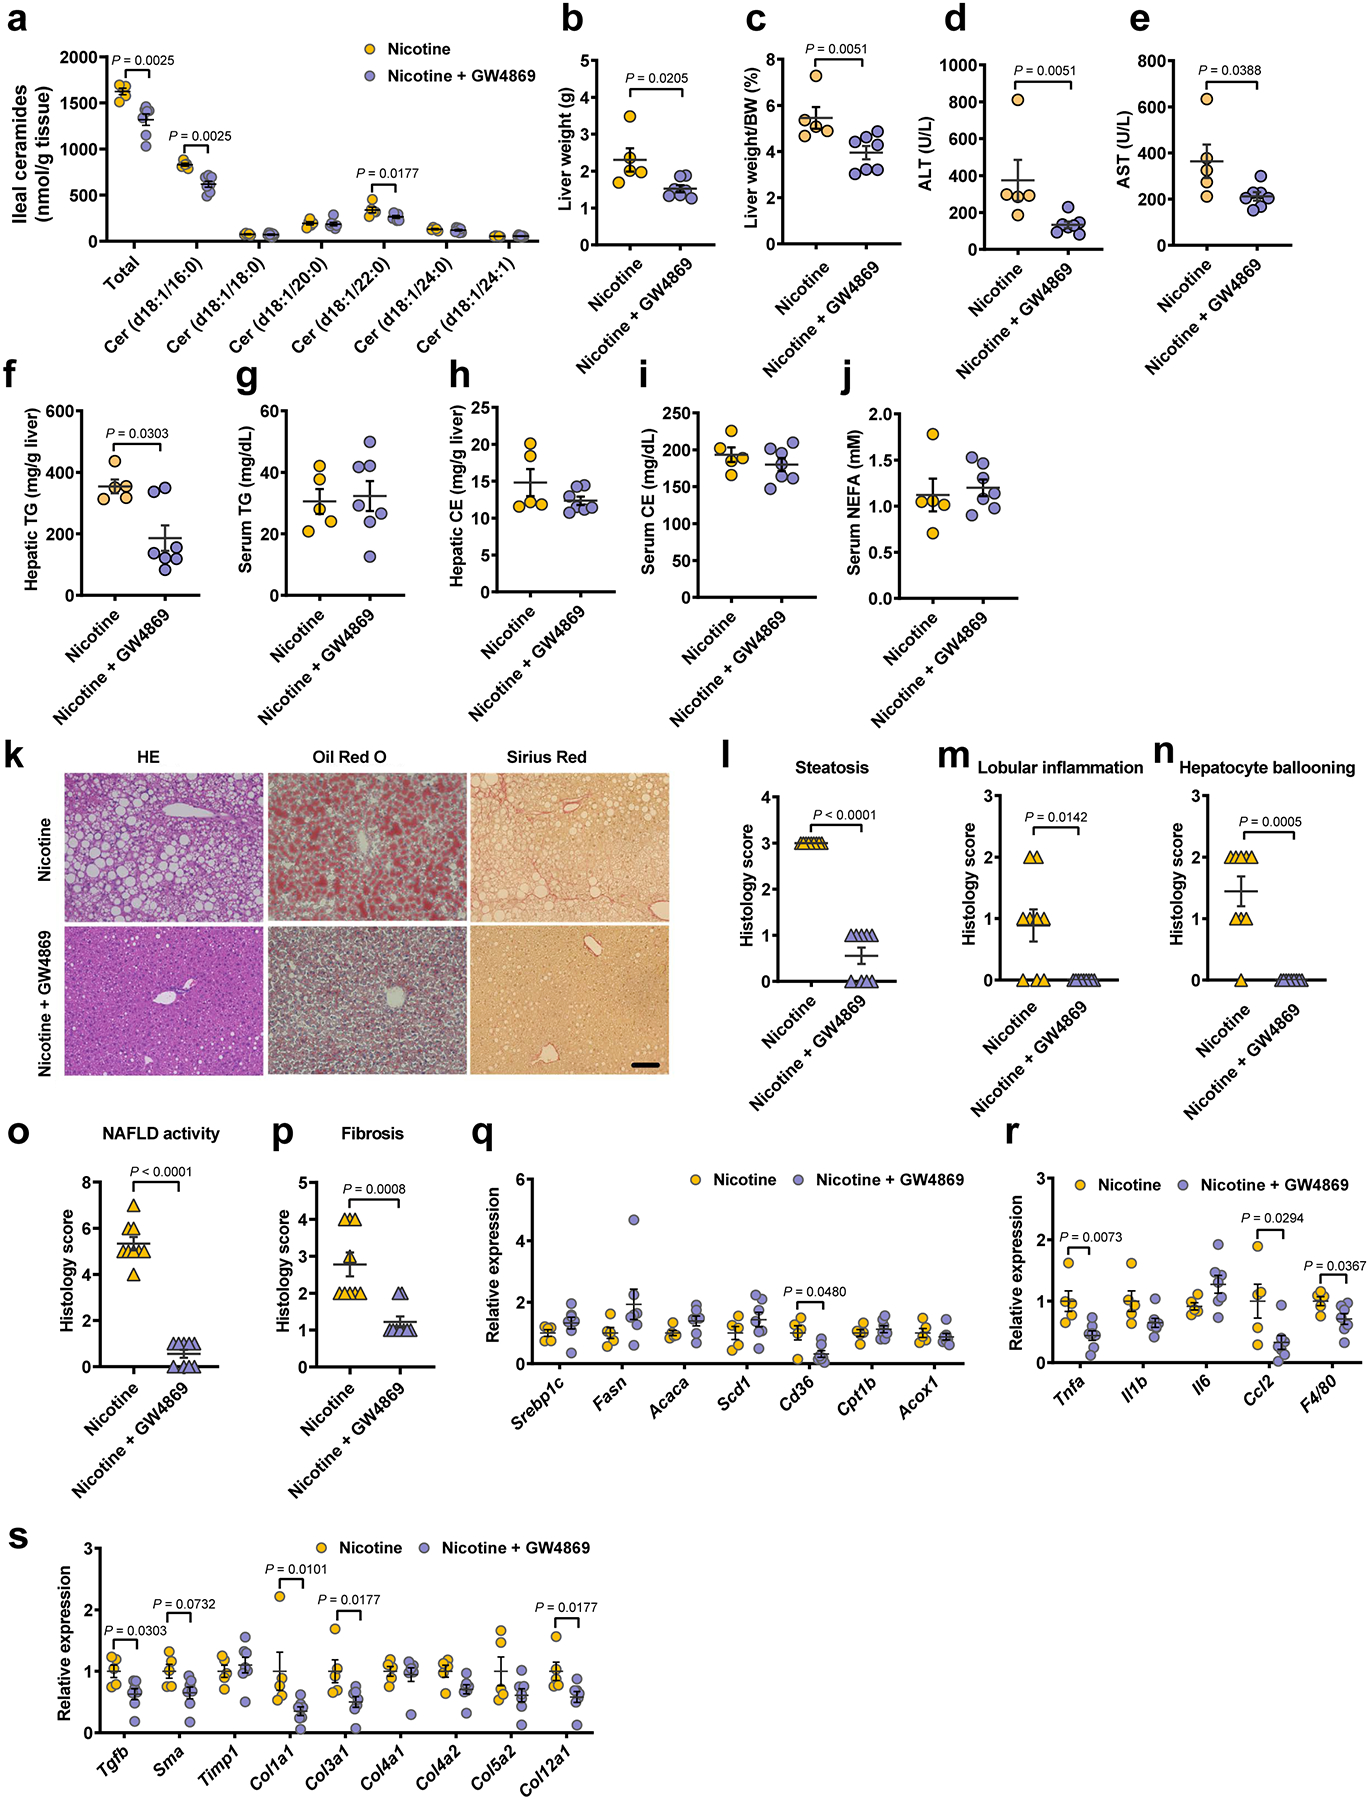
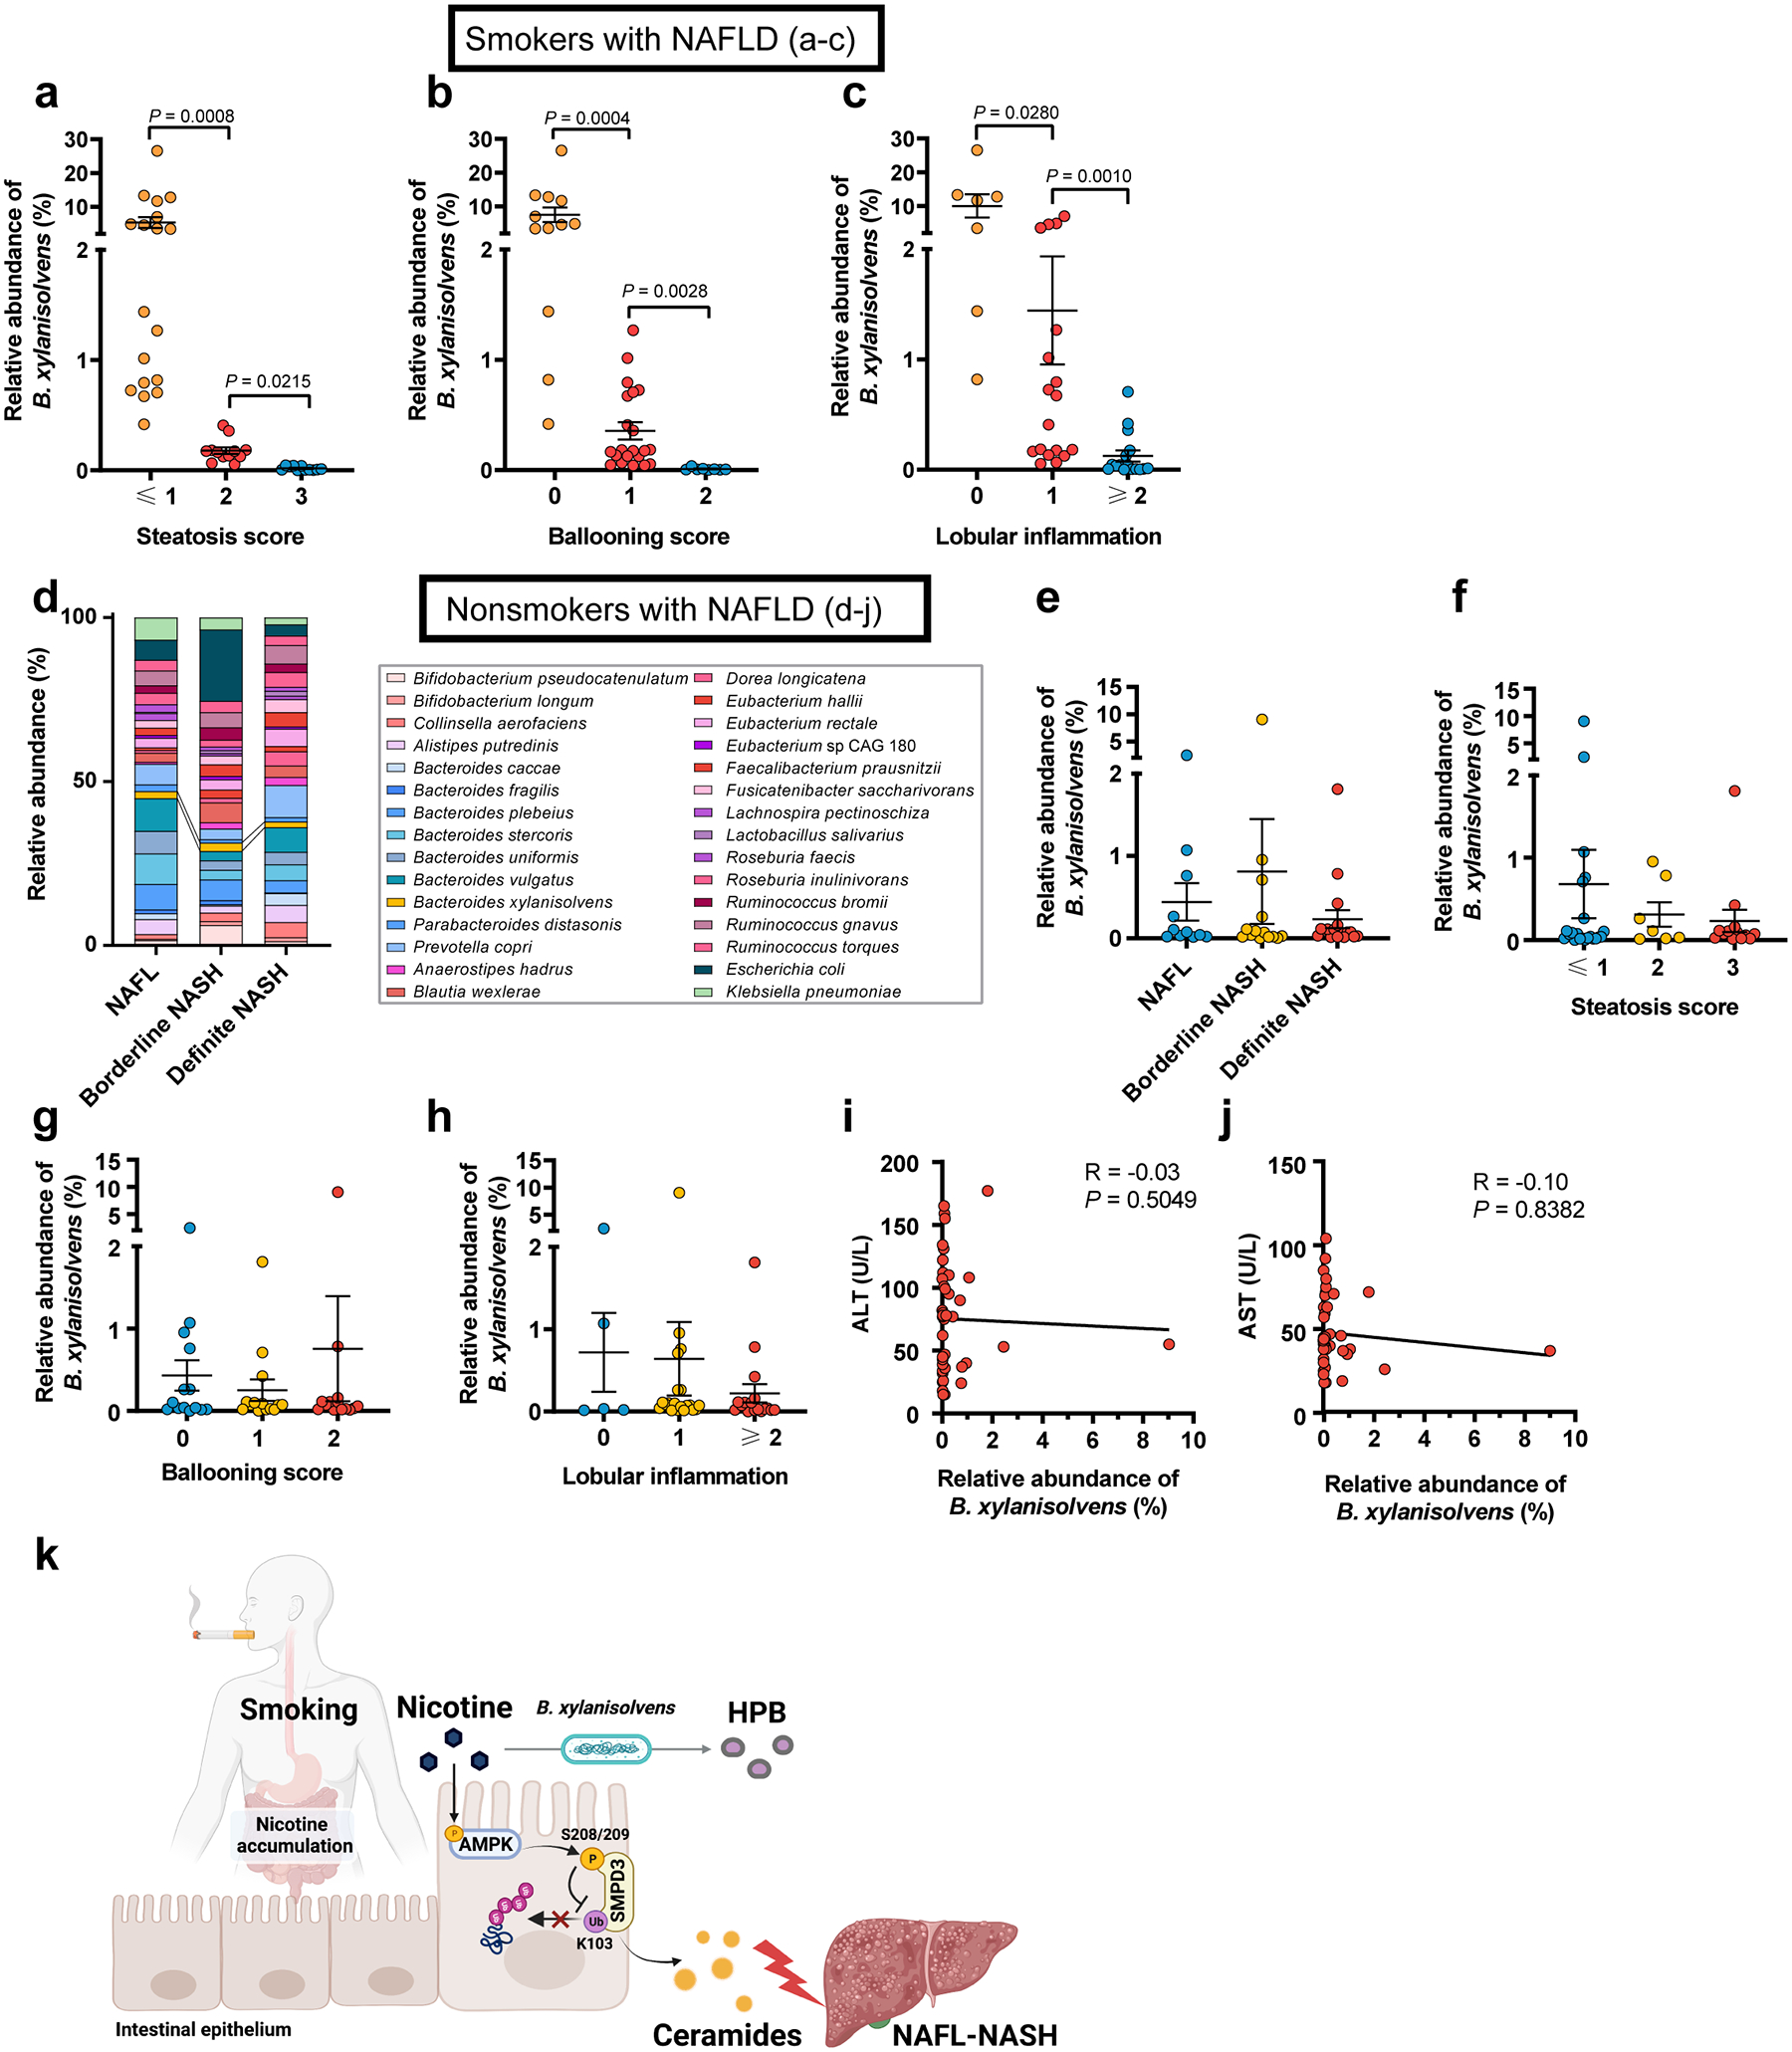
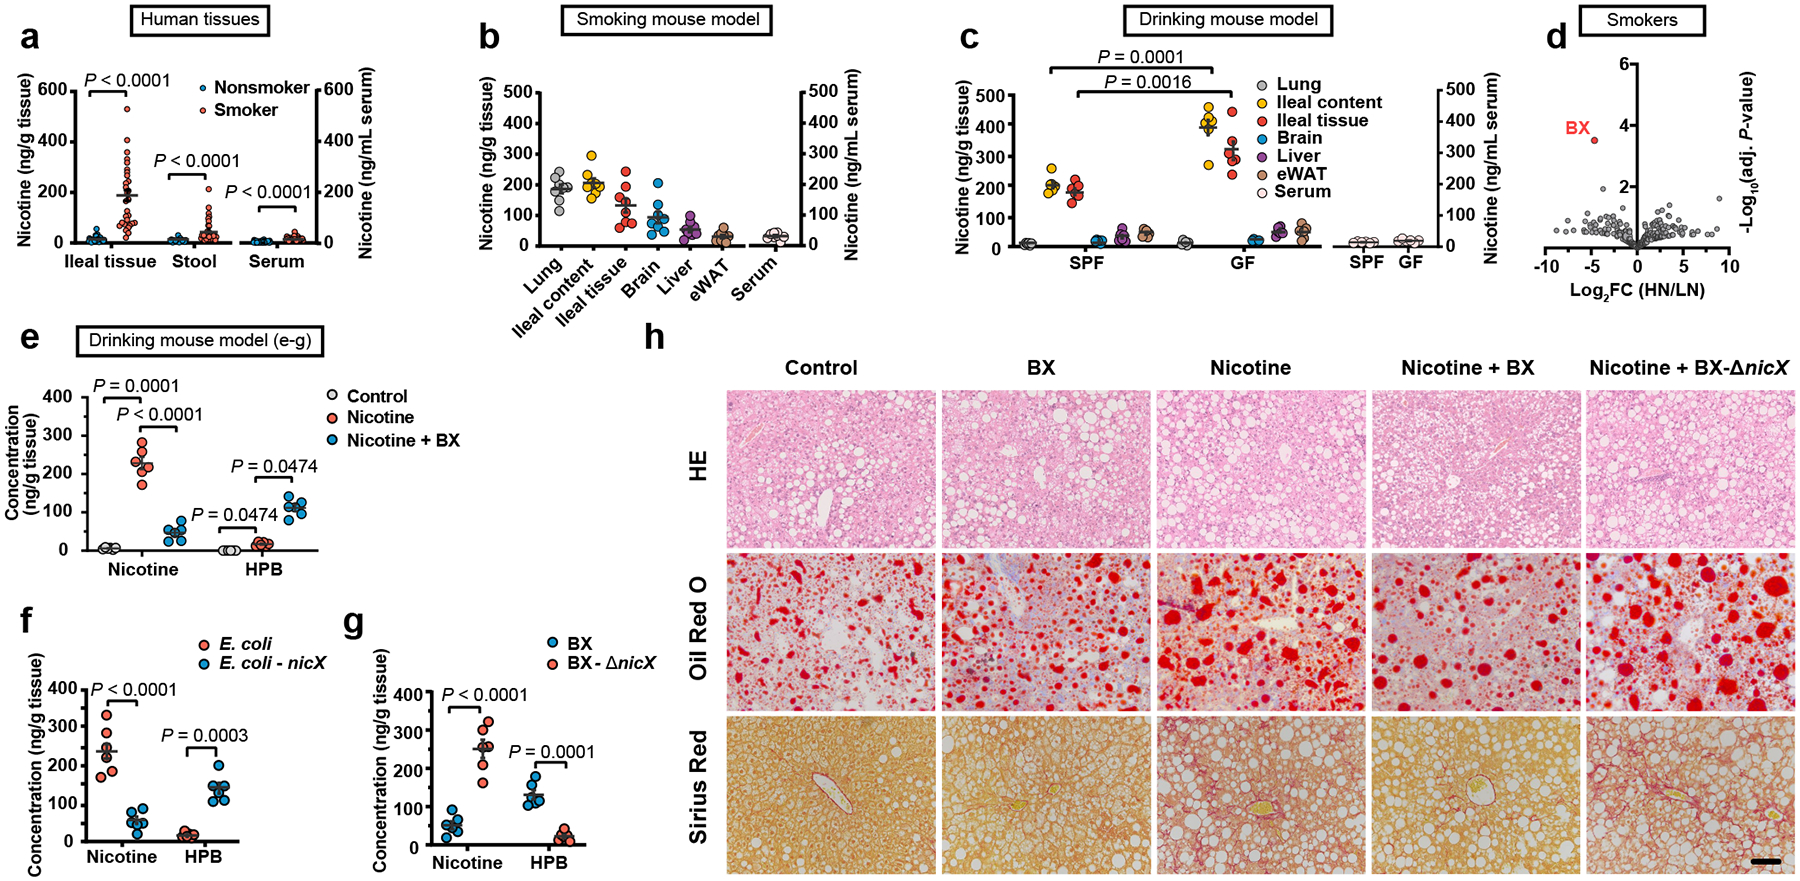
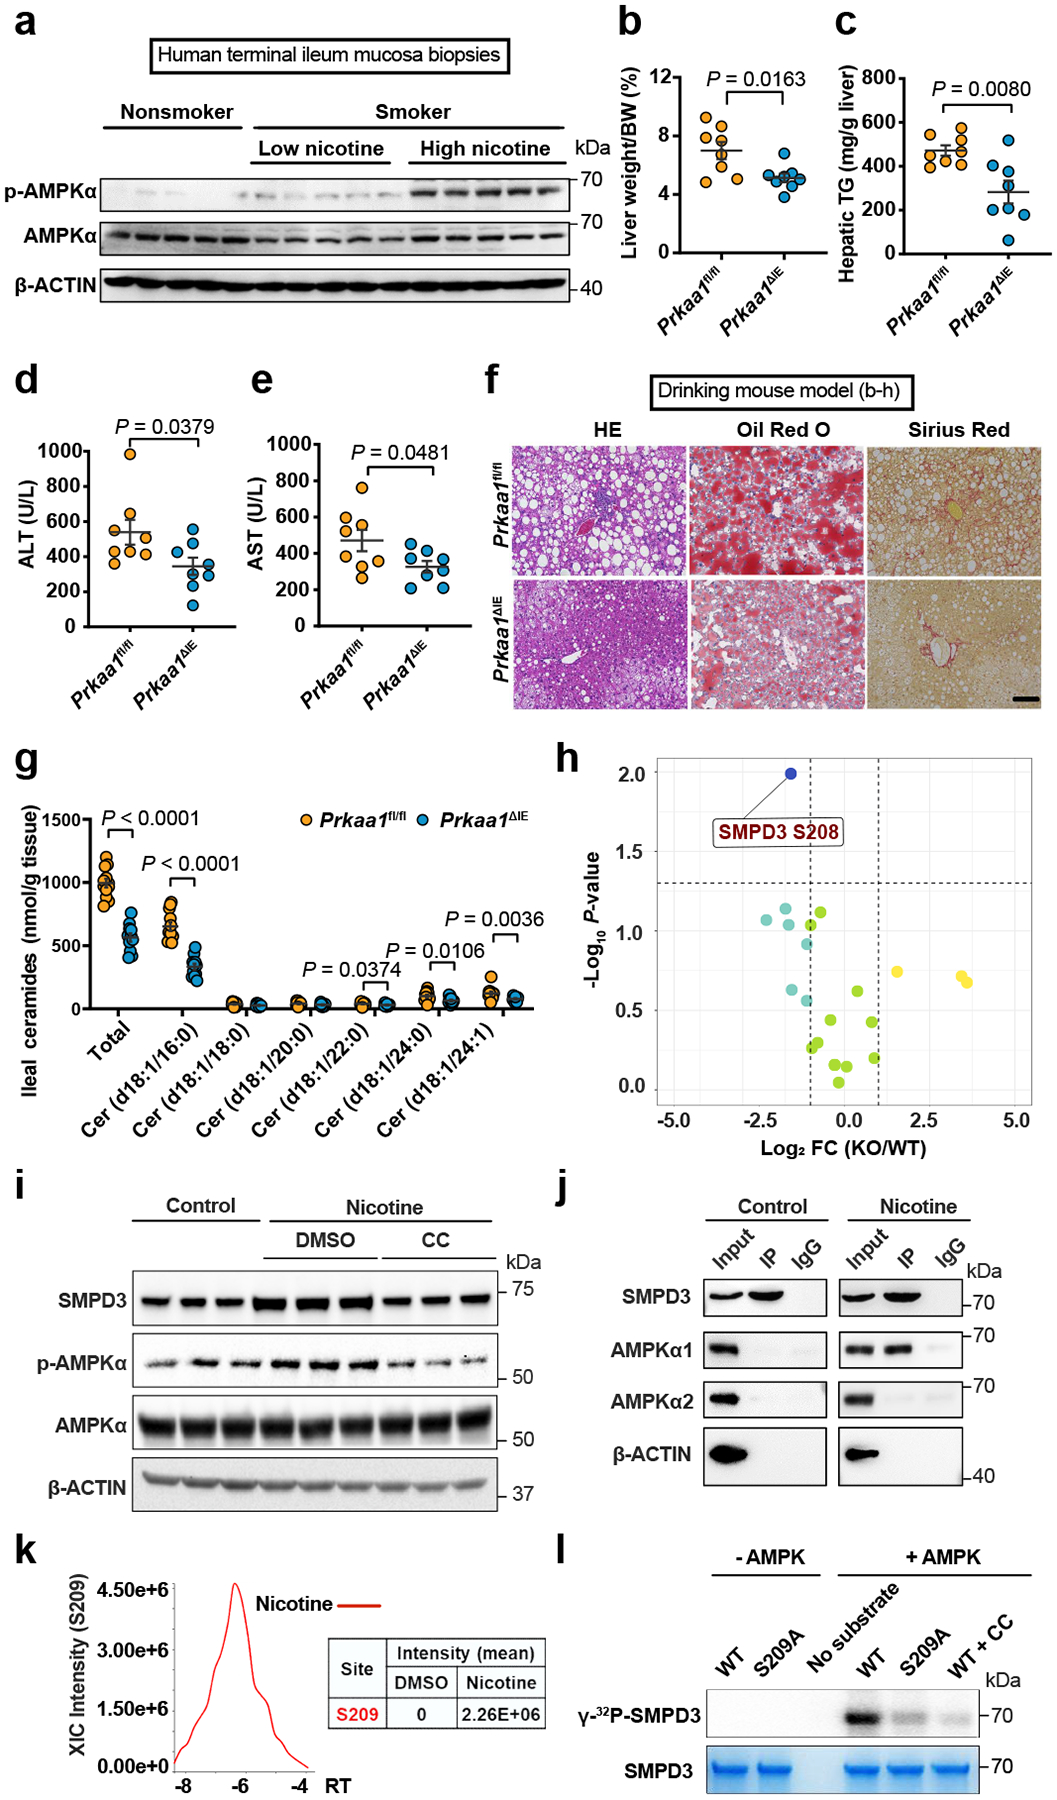
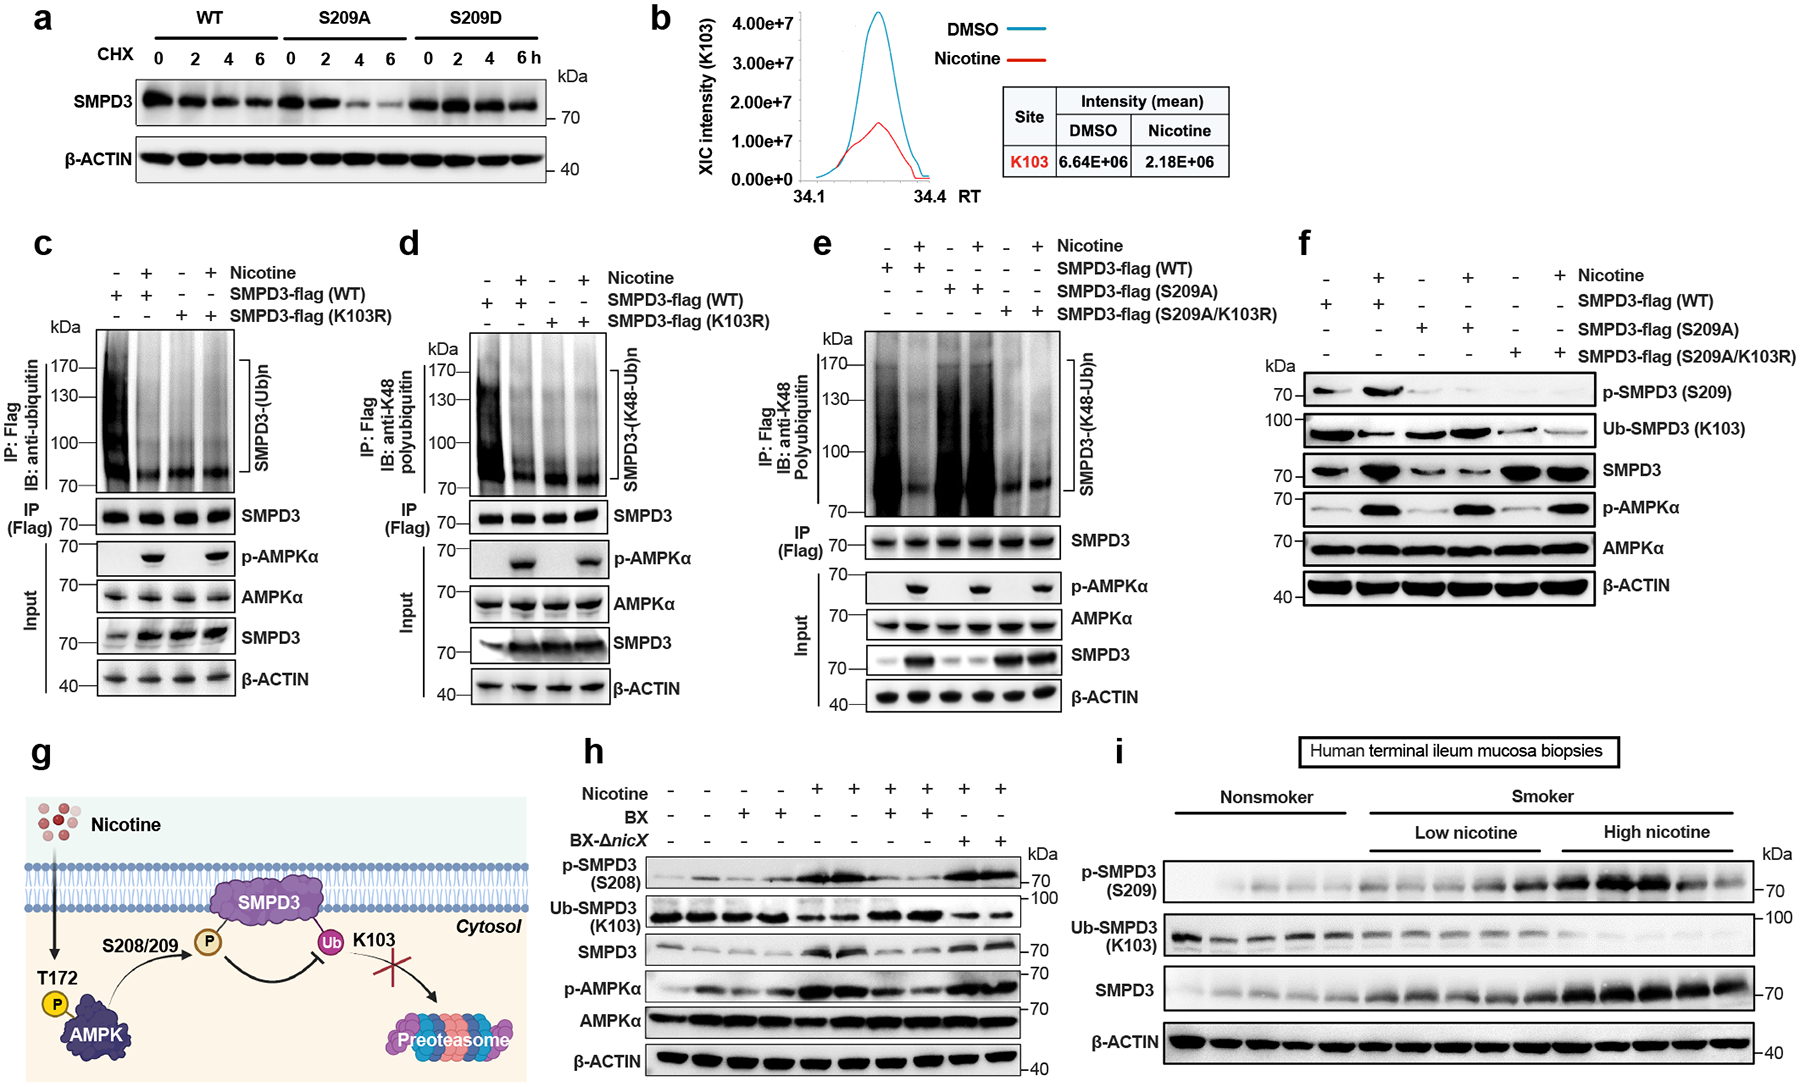
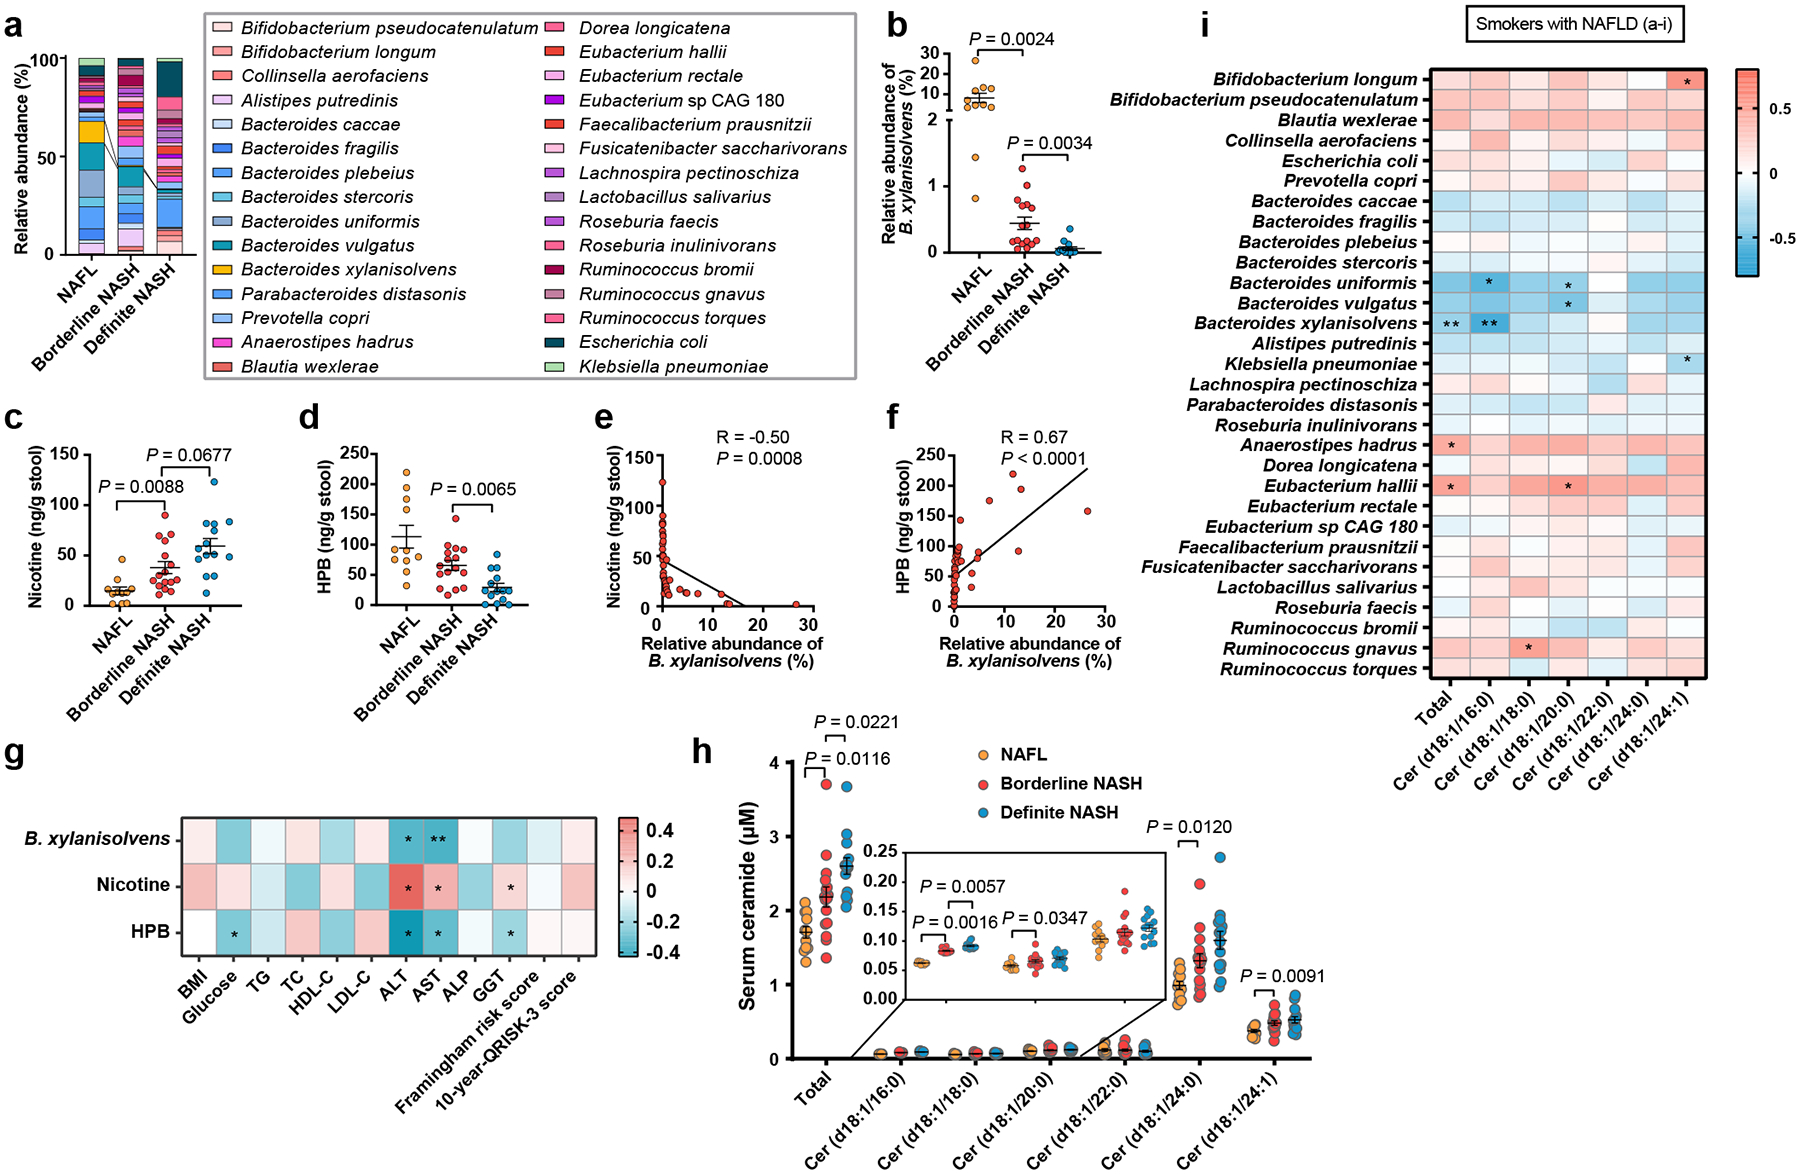
Tobacco smoking is positively correlated with non-alcoholic fatty liver disease (NAFLD)1-5, but the underlying mechanism for this association is unclear. Here we report that nicotine accumulates in the intestine during tobacco smoking and activates intestinal AMPKα. We identify the gut bacterium Bacteroides xylanisolvens as an effective nicotine degrader. Colonization of B. xylanisolvens reduces intestinal nicotine concentrations in nicotine-exposed mice, and it improves nicotine-exacerbated NAFLD progression. Mechanistically, AMPKα promotes the phosphorylation of sphingomyelin phosphodiesterase 3 (SMPD3), stabilizing the latter and therefore increasing intestinal ceramide formation, which contributes to NAFLD progression to non-alcoholic steatohepatitis (NASH). Our results establish a role for intestinal nicotine accumulation in NAFLD progression and reveal an endogenous bacterium in the human intestine with the ability to metabolize nicotine. These findings suggest a possible route to reduce tobacco smoking-exacerbated NAFLD progression.


Conflict of interest statement

Competing interest declaration. The authors have declared that no conflicts of interest exist.

Figures

Extended Data Fig. 1
Extended Data Fig. 1. Gut microbiota composition differences between smokers with high nicotine and low nicotine levels.
a, Quantification of the nicotine concentrations in lung, ileum content, ileum tissue, brain, liver, eWAT and serum samples obtained from s.c. injection mouse model for two weeks (SPF, n = 8 mice/group). b, Top 10 species of gut bacteria in humans that show high correlation with the known nicotine-degrading enzyme, nicA. These species were identified by MetaQuery. c-i, 30 smokers who were further divided into the HN (high nicotine, n = 16) and LN (low nicotine, n = 14) groups according to their ileal nicotine levels. Ileal nicotine concentrations in HN and LN groups. The data did not obey the normal distribution determined by the Shapiro normality test; thus, the median was used as a break point, and divided into two groups (c). α-diversity of the gut microbiota between the LN and HN individuals, as indicated by the ACE (d), Chao1 (e) and Shannon indices (f). Partial least squares discriminant analysis (PLS-DA) using the Bray-Curtis distance (g). Taxonomic cladogram generated by LefSe of metagenomic analysis data. The blue color indicates enriched taxa in the LN group, and the red color indicates enriched taxa in the HN group. The size of each circle is proportional to the taxon’s abundance (h, i). Data are the means ± s.e.m. b, Correlations were assessed by nonparametric Spearman’s test. c-f, Two-tailed Student’s t-test.
Extended Data Fig. 2
Extended Data Fig. 2. Identification of B. xylanisolvens as a nicotine degrader
a, Growth curves of B. xylanisolvens with or without nicotine in culture medium (n = 3/group). b, Nicotine concentration in B. xylanisolvens in vitro cultivation compared with control (BHI medium with nicotine supplementation, n = 5/group). c, 1H NMR spectrum (top) and 13C NMR spectrum (bottom) of HPB. d, Production of HPB in B. xylanisolvens in vitro supplementation compared with control (BHI medium with nicotine supplementation, n = 5/group). e, Nicotine and HPB concentration in ileal tissues of smoking exposure mouse model for two weeks (SPF, n = 6 mice/group). f, Nicotine and HPB concentration in ileal tissues of subcutaneous injection mouse model for two weeks (SPF, n = 6 mice/group). g, Structural alignment of the SWISS-MODEL-predicted B. xylanisolvens NicX and predicted Pseudomonas putida NicA. The Root-Mean-Square-Deviation (RMSD) of 242 aligned residues is 1.323 Å. h, Nonlinear regression for nicotine degradation catalyzed by purified NicX. The reaction mixture contained 1 mM FMN, 25 mM Tris-HCl (pH 7.6), 20 ng NicX, and nicotine in different concentration at 37 °C, n = 3/group. i, Schematic diagram illustrating the workflow for nicX gene deletion in B. xylanisolvens. j, Production of HPB in E. coli and E. coli + nicX in vitro cultivation (LB medium with nicotine supplementation, n = 5/group). k, Production of HPB in B. xylanisolvens and B. xylanisolvens-ΔnicX in vitro cultivation in culture medium (BHI medium with nicotine supplementation, n = 5/group). l, Growth curves of WT and nicX-KO B. xylanisolvens. (n = 3/group). Data are the means ± s.e.m. a, b, l, Two-tailed Student’s t-test. d, j, k, Two-tailed Mann-Whitney U-test. e, f, for Nicotine, one-way ANOVA with Dunnett’s T3 post hoc test; for HPB, Kruskal-Wallis test with Dunn’s test. Experiments in a, b, d, h, j, k, l were performed three times independently.
Extended Data Fig. 3
Extended Data Fig. 3. B. xylanisolvens transplantation alleviates nicotine-accelerated NAFLD progression
HFHCD-fed SPF mice were treated with PBS, B. xylanisolvens colonization, nicotine water, nicotine water plus B. xylanisolvens colonization, and nicotine water plus nicX knock-out B. xylanisolvens colonization for 20 weeks (n = 6 mice/group). a, Fecal B. xylanisolvens abundance analyses of mice by qPCR. b, Ileal nicotine concentrations. c, Body weight gain. d, Body mass composition. e, Liver weights. f, Liver weight–to–body weight ratios. g, h, Serum ALT (g) and AST (h) levels. i, Hepatic TG content. j, Serum TG content. k, Hepatic CE content. l, Serum CE content. m, Serum NEFA content. n-r, Histology scores of hepatic steatosis (n), lobular inflammation (o), ballooning (p), NAFLD activity (q), and fibrosis stage (r). s-u, Relative mRNA levels of genes related to hepatic lipid metabolism (s), inflammation (t) and fibrosis (u). Data are the means ± s.e.m. c, e-i, k-m, One-way ANOVA with Tukey’s post hoc test. a, b, j, One-way ANOVA with Dunnett’s T3 post hoc test. d, n-u, Kruskal-Wallis test with Dunn’s test.
Extended Data Fig. 4
Extended Data Fig. 4. Nicotine-induced activation of intestinal AMPKα
a, b, Activation of the AMPKα in ileal organoids after treatment with nicotine at different concentrations for 4 h (n = 3 independent experiments). c, Western blot analysis indicated that ileal AMPKα was activated in the nicotine drinking mouse model (SPF, n = 6 mice/group). d, e, Western blot analysis indicated that ileal AMPKα was activated in the smoking mouse model (d) and the subcutaneous injection mouse model (e) (SPF, n = 3 mice/group). f, Western blot analysis of ileal primary enterocytes isolated from WT, Prkaa1ΔIE and Prkaa2ΔIE mice (SPF) and then cultured with or without nicotine (1 μg/mL) treatment for 4 h. Experiments were performed with n = 4 mice/group. g, Western blot analysis showing ileal AMPK signaling in the nicotine drinking mouse model transplanted with Control or B. xylanisolvens (SPF, n = 6 mice/group). h, i, Western blot analysis showing ileal AMPK signaling in the nicotine drinking mouse model transplanted with E. coli or nicX knock-in E. coli (h); and WT or nicX knock-out B. xylanisolvens (i) (SPF, n = 6 mice/group). j, Western blot analysis showing AMPK signaling in SW480 cells incubated with nicotine (1 μg/mL) or HPB (1 μg/mL) for 4 h. This result is representative of 3 independent experiments. In c-e, g-i, mice were supplied nicotine plus HFHCD for two weeks. Data are the means ± s.e.m. (b).
Extended Data Fig. 5
Extended Data Fig. 5. Intestinal AMPKα1 deficiency improves NAFLD progression via downregulating ceramides generation.
Eight-week-old male Prkaa1fl/fl and Prkaa1ΔIE mice were administered an HFHCD plus nicotine water for 20 weeks (SPF, n = 8 mice/group). a, Liver weight. b-e, Serum TG (b), hepatic CE (c), serum CE (d) and serum NEFA (e) contents. f-j, Histology scores of hepatic steatosis (f), lobular inflammation (g), ballooning (h), NAFLD activity (i), and fibrosis stage (j). k-m, Relative mRNA levels of genes related to hepatic lipid metabolism (k), inflammation (l) and fibrosis (m). n, o, Eight-week-old male Prkaa1fl/fl (WT) and Prkaa1ΔIE (KO) mice were administered an HFHCD plus nicotine water for 20 weeks (SPF, Prkaa1fl/fl, n = 12 mice; Prkaa1ΔIE, n = 11 mice). PLS-DA analysis of lipid metabolites in the ileum (n). Random forest analysis showing the top 10 lipid metabolites that lead to differences in the ileal lipid profiles (o). p, A schematic diagram illustrating the workflow of phosphorylated proteomics. Created with BioRender. q, Volcano map of phosphorylated proteomics analysis from ileal epithelia of Prkaa1fl/fl (WT) and Prkaa1ΔIE (KO) mice (n = 5 mice/group) administrated an HFHCD plus nicotine water for 20 weeks, relative fold change (log2) of phosphorylated sites abundance versus −log10 (P values), analysis from P values calculated by two-tailed t-test. Data are the means ± s.e.m. a-e, Two-tailed Student’s t-test. f-m, Two-tailed Mann- Whitney U-test.
Extended Data Fig. 6
Extended Data Fig. 6. AMPKα phosphorylates SMPD3 protein which became more stable through escaped from ubiquitination degradation
a, Nicotine (1 μg/mL) treatment on Smpd3 mRNA levels in ileal organoids (n = 3/group). b, PRKAA1-WT or PRKAA1-KD (kinase domain mutant) was introduced into SW480 cells, and the cells were then treated with vehicle or nicotine (1 μg/mL) for 12 h. c, GPS2.0 predicts potential kinases and phosphorylation sites for SMPD3. d, The S208/209 peptide of SMPD3 satisfied the AMPK substrate motif and was conserved in different species (data from NCBI database). e, Mass spectrometry analysis of the phosphorylation at S209 on SMPD3. f, HFHCD-fed Prkaa1fl/fl and Prkaa1ΔIE mice (SPF) were treated with nicotine water for 2 weeks, and organoids were then isolated and cultured for 7 days and treated with nicotine (1 μg/mL) for the last 3 days. Western blot analysis showing the stability of SMPD3 after the administration of CHX. g, Mass spectrometry analysis of the ubiquitination at K103 on SMPD3. h, The K63 ubiquitination of SMPD3 in SW480 cells transfected with SMPD3-flag (WT and K103R) with or without nicotine treatment. i, The SMPD3 ubiquitination in SW480 cells transfected with SMPD3-flag (WT, S209A or S209A/K103R) and treated with or without nicotine. j, Phosphorylation level (S209) of SMPD3 was detected by anti-p-SPMD3 (S209) antibody in SW480 cells transfected with SMPD3-flag (WT or S209A) and treated with or without nicotine for 24 h. k, Ubiquitination level (K103) of SMPD3 was detected by anti-ubi-SMPD3 (K103) antibody in SW480 cells transfected with SMPD3-flag (WT or K103R) and treated with or without nicotine for 24 h. For e, g-k, nicotine (1 μg/mL) treatment for 24 h. Data are the means ± s.e.m. Experiments in a, b, e-k were performed three times independently. a, One-way ANOVA with Tukey’s post hoc test.
Extended Data Fig. 7
Extended Data Fig. 7. Interaction between p-AMPKα and SMPD3 in intestinal ceramide production
a-c, HFHCD-fed SPF mice were treated with nicotine water or nicotine water plus 10 mg/kg GW4869 (by daily gavage) for 2 weeks, and ileal organoids were then isolated and cultured for 7 days and treated with GW4869 (10 μM) and nicotine (1 μg/mL) for the last 3 days before the detection of ceramide production and secretion (n = 5 mice/group). a, nSMase activity. b, Ceramide profiles in isolated organoids. c, Ceramide profiles in the supernatant of isolated organoids. d-f, HFHCD-fed Prkaa1fl/fl and Prkaa1ΔIE mice (SPF) were treated with nicotine water for 2 weeks, and organoids were then isolated and infected with LV (lentivirus)-Ctrl or LV-Smpd3, the infected organoids were plated and cultured for 7 days and treated with nicotine (1 μg/mL) for the last 3 days before the detection of ceramide production and secretion. Western blot analysis for verifying SMPD3 overexpression. (n = 3 mice/group) (d). Ceramide profiles in isolated organoids. (n = 8 mice/group) (e). Ceramide profiles in the supernatant of isolated organoids. (n = 8 mice/group) (f). g, HFHCD-fed WT mice were transplanted with PBS, B. xylanisolvens colonization, nicotine water, nicotine water plus B. xylanisolvens colonization, and nicotine water plus nicX knock-out B. xylanisolvens colonization for 20 weeks (SPF, n = 6 mice/group), and ileal tissues were collected for the ceramide profiles detection. Data are the means ± s.e.m. a, b, Two-tailed Student’s t-test. c, Two-tailed Mann-Whitney U-test. f, One-way ANOVA with Tukey’s post hoc test. e, g, Kruskal-Wallis test with Dunn’s test.
Extended Data Fig. 8
Extended Data Fig. 8. Ceramide supplementation eliminates the beneficial effects derived from intestinal AMPKα1 deficiency
Eight-week-old male Prkaa1fl/fl and Prkaa1ΔIE mice were treated with or without 10 mg/kg ceramide (d18:1/16:0) by daily i.p. injection under HFHCD plus nicotine water treatment for 20 weeks (SPF, Prkaa1fl/fl, n = 8 mice; Prkaa1ΔIE, n = 7 mice; Prkaa1ΔIE + Ceramide, n = 8 mice). a, Ileal ceramide profiles. b, Liver weights. c, Liver weight–to–body weight ratios. d, e, Serum ALT (d) and AST (e) levels. f-j, Hepatic TG (f), serum TG (g), hepatic CE (h), serum CE (i) and serum NEFA (j) contents. k, Representative H&E staining (upper), Oil Red O staining (middle) and Sirius Red staining (lower) of liver sections (n = 4 mice/group, 3 images/mouse). Scale bar, 100 μm. l-p, Histology scores of steatosis (l), lobular inflammation (m), hepatocyte ballooning (n), NAFLD activity (o) and fibrosis stage (p). q-s, Relative mRNA levels of genes related to hepatic lipid metabolism (q), inflammation (r) and fibrosis (s). Data are the means ± s.e.m. d-g, i, One-way ANOVA with Tukey’s post hoc test. h, One-way ANOVA with Dunnett’s T3 post hoc test. a-c, j, l-s, Kruskal-Wallis test with Dunn’s test.
Extended Data Fig. 9
Extended Data Fig. 9. Inhibition of SMPD3 ameliorates nicotine-induced NAFLD progression
Eight-week-old male SPF mice were randomly grouped and received control or 10 mg/kg GW4869 by daily gavage under HFHCD plus nicotine water treatment for 20 weeks (Nicotine, n = 5 mice; Nicotine + GW4869, n = 7 mice). a, Ileal ceramide profiles. b, Liver weights. c, Liver weight–to–body weight ratios. d, e, Serum ALT (d) and AST (e) levels. f-j, Hepatic TG (f), serum TG (g), hepatic CE (h), serum CE (i) and serum NEFA (j) contents. k, Representative H&E staining (left), Oil Red O staining (middle) and Sirius Red staining (right) of liver sections (n = 3 mice/group, 3 images/mouse). Scale bar, 100 μm. l-p, Histology scores of steatosis (l), lobular inflammation (m), hepatocyte ballooning (n), NAFLD activity (o) and fibrosis stage (p). q-s, Relative mRNA levels of genes related to hepatic lipid metabolism (q), inflammation (r) and fibrosis (s). Data are the means ± s.e.m. b, e, g-j, r, Two-tailed Student’s t-test. a, c, d, f, l-q, s, Two-tailed Mann-Whitney U-test.
Extended Data Fig. 10
Extended Data Fig. 10. B. xylanisolvens-mediated nicotine degradation negatively correlates with clinical NAFLD progression
In 41 smokers with NAFLD, NAFL n = 11, borderline NASH n= 16, definite NASH n = 14. a-c, Relative abundances of B. xylanisolvens associated with steatosis score (a), ballooning score (b), and lobular inflammation (c) in smokers with NAFLD. In 42 nonsmokers with NAFLD, including NAFL (n = 11), borderline NASH (n = 14), and definite NASH (n = 17). d, Bacterial taxonomic profiling of the gut microbiota from nonsmokers with different NAFLD stages at the species level. e, Relative abundances of B. xylanisolvens associated with different NAFLD stages in nonsmokers with NAFLD. f-h, Relative abundances of B. xylanisolvens associated with steatosis score (f), ballooning score (g), and lobular inflammation (h) in nonsmokers with NAFLD. i, j, Correlative analysis of B. xylanisolvens with ALT (i) and AST (j). Correlations between variables were assessed by linear regression analysis. Linear correction index R square and P values were calculated. k, Summary diagram illustrating the role of microbial nicotine degradation in ceramide modulation and NAFL-NASH progression. Created with BioRender. Data are the means ± s.e.m. a-c, e-h, Kruskal-Wallis test with Dunn’s test.
Fig. 1
Fig. 1. Identification of intestinal nicotine accumulation and gut bacterial-derived intestinal nicotine degradation
a, Quantification of the nicotine concentrations in terminal ileum mucosa biopsies, serum and stool samples collected from smokers (n = 30) and nonsmokers (n = 30). For the assessment of ileal nicotine accumulation, the following mouse models were treated for two weeks (b, c, e-g). b, Nicotine concentrations in lung, ileum content, ileum tissue, brain, liver, eWAT and serum samples in smoking SPF mouse model (n = 8 mice/group). c, Tissue nicotine concentrations of SPF and GF mice in nicotine drinking model (n = 6 mice/group). d, Volcano plot of human stool metagenomic sequencing data in HN and LN groups. The adjusted P value was calculated using the moderated Student’s t-test followed by the Benjamini-Hochberg procedure via the false discovery rate (FDR). FC: fold change. e, Nicotine and HPB concentration in ileal tissue of control, nicotine and nicotine + B. xylanisolvens treated SPF mice, separately (n = 6 mice/group). f, g, Nicotine and HPB concentration in ileal tissue of E. coli or nicX knock-in E. coli treated SPF mice (f) and B. xylanisolvens or nicX knock-out B. xylanisolvens treated SPF mice (g). (n = 6 mice/group). HFHCD-fed SPF mice were treated with PBS, B. xylanisolvens colonization, nicotine water, nicotine water + B. xylanisolvens colonization, and nicotine water plus nicX knock-out B. xylanisolvens colonization for 20 weeks (n = 6 mice/group). h, Representative H&E staining (top), Oil Red O staining (middle) and Sirius Red staining (bottom) of liver sections (n = 3 mice/group, 3 images/mouse). Scale bar, 100 μm. Data are the means ± s.e.m. a, Two-tailed Mann-Whitney U test. c, f, g, Two-tailed Student’s t-test. e, for Nicotine, one-way ANOVA with Dunnett’s T3 post hoc test; for HPB, Kruskal-Wallis test with Dunn’s test.
Fig. 2
Fig. 2. Nicotine-induced activation of intestinal AMPKα-SMPD3 axis in NAFLD progression
a, Representative western blot of ileal AMPK signaling in nonsmokers (n = 30) and smokers with low nicotine (n = 14) or high nicotine (n = 16) contents in terminal ileum mucosa biopsies. Prkaa1fl/fl and Prkaa1ΔIE mice (SPF) were administrated an HFHCD plus nicotine water for 20 weeks (n = 8 mice/group). b, Liver weight–to–body weight ratios. c, Liver TG content. d, e, Serum ALT (d) and AST (e) levels. f, Representative H&E staining (left), Oil Red O staining (middle) and Sirius Red staining (right) of liver sections (n = 4 mice/group, 3 images/mouse). Scale bar, 100 μm. g, Quantification of ileal ceramide profiles between Prkaa1fl/fl (WT, n = 12) and Prkaa1ΔIE (KO, n = 11) mice administrated an HFHCD plus nicotine water for 20 weeks. h, Volcano map shows all phosphorylated sites of ceramide metabolism-related proteins identified from phosphorylated proteomics analysis of the ileal epithelia of Prkaa1fl/fl (WT) and Prkaa1ΔIE (KO) mice administrated an HFHCD plus nicotine water for 20 weeks (n = 5 mice/group). P values calculated by two-sided Student’s t-test. i, The assessment of AMPK activation and SMPD3 protein levels in ileal organoids treated with control, nicotine or nicotine plus compound C (CC, AMPK inhibitor) for 12 h. j, Co-IP of AMPKα1 with SMPD3. Constructs encoding Flag-tagged SMPD3 were transfected into SW480 cells, and then treated with nicotine for 4 h. k, Mass spectrometry analysis of the phosphorylation intensity at S209 on SMPD3 with or without nicotine treatment for 24 h. l, In vitro phosphorylation of WT or S209A mutant SMPD3 (86–655) by AMPK(α1/β1/γ2) with or without CC treatment. Data are the means ± s.e.m. b, c, e, Two-tailed Student’s t-test. d, g, Two-tailed Mann-Whitney U-test. Experiments in i-l were performed three times independently.
Fig. 3
Fig. 3. Phosphorylated SMPD3 is more stable due to reduced ubiquitination-mediated degradation
a, Western blot analysis showing the stability of SMPD3 after the administration of cycloheximide (CHX, translation inhibitor) in SW480 cells transfected with WT or mutant SMPD3 (S209A, S209D). b, Mass spectrometry analysis of the ubiquitination intensity at K103 on SMPD3 with or without nicotine treatment. c, Total ubiquitination of SMPD3 in SW480 cells transfected with WT or K103R SMPD3-flag with or without nicotine treatment. d, K48 ubiquitination of SMPD3 in SW480 cells transfected with WT or K103R SMPD3-flag with or without nicotine treatment. e. K48 ubiquitination of SMPD3 in SW480 cells transfected with WT, 209A or 209A plus K103R SMPD3-flag without or with nicotine treatment. f, Western blot analysis showed phosphorylation levels, ubiquitination levels, and protein levels of SMPD3 in SW480 cells transfected with three SMPD3-flag plasmids (WT, S209A, S209A/K103R) and treated with or without nicotine. g, Diagram of the SMPD3 protein phosphorylation and ubiquitination process under normal and nicotine stimulated conditions. Created with BioRender. h, Representative ileal SMPD3 protein phosphorylation and ubiquitination levels in HFHCD-fed mice subjected to PBS, B. xylanisolvens colonization, nicotine water, nicotine water plus B. xylanisolvens colonization, and nicotine water plus nicX knock-out B. xylanisolvens colonization for 20 weeks. (n = 4 mice/group). i, Representative western blot of ileal SMPD3 phosphorylation, ubiquitination and protein levels in nonsmokers and smokers with low nicotine or high nicotine concentration in terminal ileum mucosa biopsies. Experiments were performed with 30 nonsmokers and 30 smokers (14 with low nicotine levels and 16 with high nicotine levels). For b-f, nicotine (1 μg/mL) treatment for 24 h. Experiments in a-f were performed three times independently.
Fig. 4
Fig. 4. B. xylanisolvens-mediated nicotine degradation is negatively correlated with clinical NAFLD progression
In 41 smokers with NAFLD, including NAFL (n = 11), Borderline NASH (n = 16), Definite NASH (n = 14). a, Bacterial taxonomic profiling of the gut microbiota from different NAFLD stages processed at the species level. b, Relative abundances of B. xylanisolvens associated with different NAFLD stages in smokers with NAFLD. c, d, Concentration of fecal nicotine (c) and HPB (d) with different NAFLD stages in smokers with NAFLD. e, f, Correlative analysis of B. xylanisolvens with fecal nicotine (e) and HPB (f). Correlations between variables were assessed by linear regression analysis. Linear correction index R and P values were calculated. g, Heatmap of the correlation between B. xylanisolvens abundance, fecal nicotine and HPB levels and metabolic indicators. Correlation analysis were determined by Spearman’s rank test. *P < 0.05, **P < 0.01. h, Quantification of serum ceramides in different NAFLD stages. i, Heatmap of the correlation between gut bacteria (top 30) and serum ceramides levels. Correlation analysis were determined by Spearman’s rank test. *P < 0.05, **P < 0.01. The data are presented as the means ± s.e.m. b, c, h, Kruskal-Wallis test with Dunn’s test. d, One-way ANOVA with Dunnett’s T3 post hoc test.

Comment in

References

    1. Okamoto M et al. Cigarette smoking is a risk factor for the onset of fatty liver disease in nondrinkers: A longitudinal cohort study. PLoS One 13, e0195147, doi:10.1371/journal.pone.0195147 (2018). - DOI - PMC - PubMed
    1. Ou H, Fu Y, Liao W, Zheng C & Wu X Association between Smoking and Liver Fibrosis among Patients with Nonalcoholic Fatty Liver Disease. Can J Gastroenterol Hepatol 2019, 6028952, doi:10.1155/2019/6028952 (2019). - DOI - PMC - PubMed
    1. Jung HS et al. Smoking and the Risk of Non-Alcoholic Fatty Liver Disease: A Cohort Study. Am J Gastroenterol 114, 453–463, doi:10.1038/s41395-018-0283-5 (2019). - DOI - PubMed
    1. Takenaka H et al. Non-Alcoholic Fatty Liver Disease Is Strongly Associated with Smoking Status and Is Improved by Smoking Cessation in Japanese Males: A Retrospective Study. Kobe J Med Sci 66, E102–E112 (2020). - PMC - PubMed
    1. Yuan S et al. Lifestyle and metabolic factors for nonalcoholic fatty liver disease: Mendelian randomization study. Eur J Epidemiol, doi:10.1007/s10654-022-00868-3 (2022). - DOI - PMC - PubMed

Publication types

MeSH terms

Supplementary concepts