. 2022 Oct 19;5(1):1106.
doi: 10.1038/s42003-022-04083-4.

An integrated transcriptome mapping the regulatory network of coding and long non-coding RNAs provides a genomics resource in chickpea

Affiliations

An integrated transcriptome mapping the regulatory network of coding and long non-coding RNAs provides a genomics resource in chickpea

Mukesh Jain et al. Commun Biol. .

Abstract

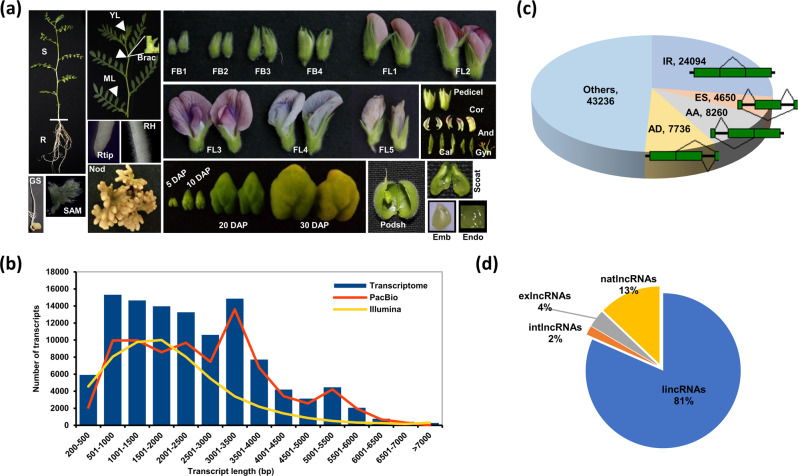
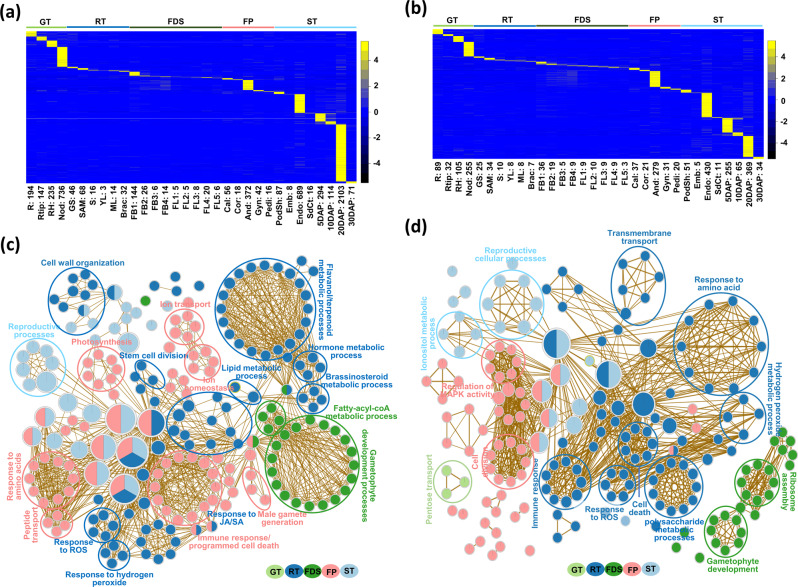
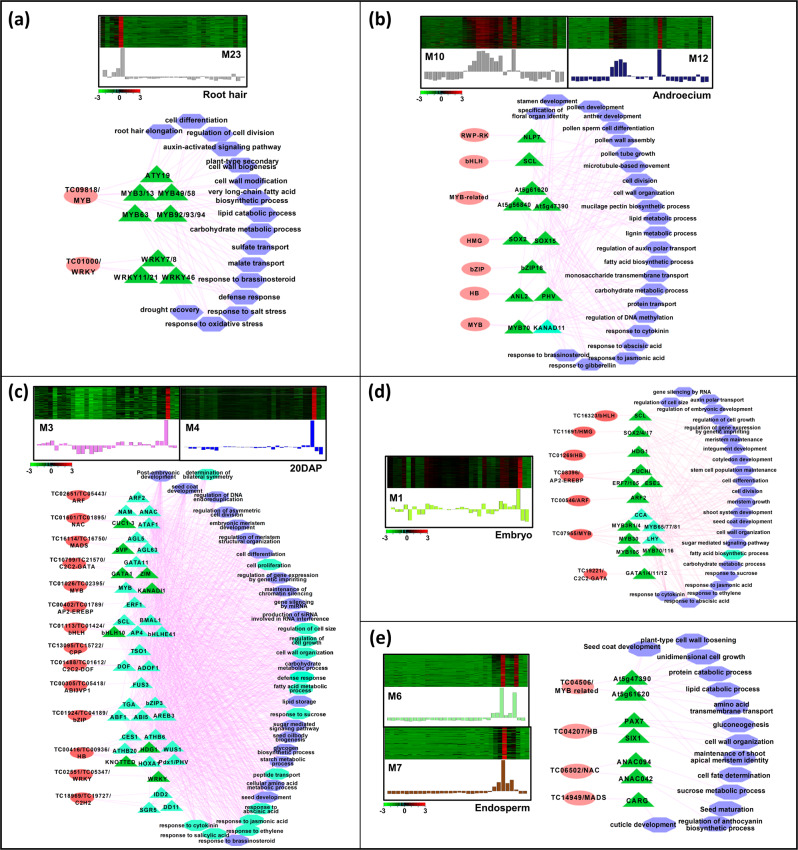
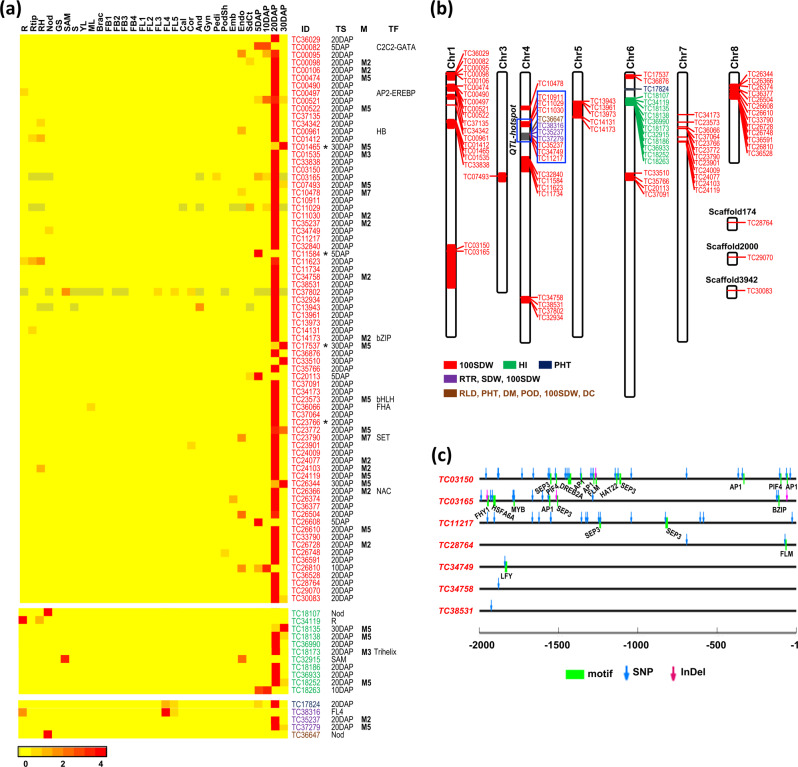
Large-scale transcriptome analysis can provide a systems-level understanding of biological processes. To accelerate functional genomic studies in chickpea, we perform a comprehensive transcriptome analysis to generate full-length transcriptome and expression atlas of protein-coding genes (PCGs) and long non-coding RNAs (lncRNAs) from 32 different tissues/organs via deep sequencing. The high-depth RNA-seq dataset reveal expression dynamics and tissue-specificity along with associated biological functions of PCGs and lncRNAs during development. The coexpression network analysis reveal modules associated with a particular tissue or a set of related tissues. The components of transcriptional regulatory networks (TRNs), including transcription factors, their cognate cis-regulatory motifs, and target PCGs/lncRNAs that determine developmental programs of different tissues/organs, are identified. Several candidate tissue-specific and abiotic stress-responsive transcripts associated with quantitative trait loci that determine important agronomic traits are also identified. These results provide an important resource to advance functional/translational genomic and genetic studies during chickpea development and environmental conditions.


Conflict of interest statement

The authors declare no competing interests.

Figures

Fig. 1
Fig. 1. Sequencing and analyses of chickpea full-length transcriptome.
a Different tissues/organs used for generation of RNA-sequencing data using Illumina platform. GS germinating seedling, S shoot, ML mature leaf, YL young leaf, Brac bracteole, R root, Rtip root tip, RH root hair, Nod nodule, SAM shoot apical meristem, FB1–FB4 stages of flower bud development, FL1–FL5 stage of flower development, Cal calyx, Cor corolla, And androecium, Gyn gynoecium, Pedi pedicel, Emb embryo, Endo endosperm, SdCt seed coat, PodSh podshell, 5DAP seed 5 days after pollination, 10DAP seed 10 days after pollination, 20DAP seed 20 days after pollination, 30DAP seed 30 days after pollination. b Length distribution of transcripts in the final transcriptome assembly and the transcripts generated via PacBio sequencing and reference-based assembly of Illumina data alone from 32 tissue samples. c Pie-chart showing the fraction of different types of major alternative spliced events (IR intron retention, ES exon skipping, AA alternate acceptor, AD alternate donor) represented in the transcriptome. d Classification of predicted lncRNAs based on their genomic location. lincRNAs intergenic lncRNAs, natlncRNAs natural antisense lncRNAs, exlncRNAs exonic lncRNAs, intlncRNAs intronic lncRNAs.
Fig. 2
Fig. 2. Expression patterns and correlation of transcriptome in different tissues/organs in chickpea.
a Percentage of transcription factor (TF) encoding genes, non-TF protein-coding genes (PCGs) and lncRNAs expressed in the 32 tissues/organs analyzed. b Non-metric multidimensional scaling analysis (NMDS) plot showing correlation among the transcriptomes of 32 tissue/organs samples. The tissues/organs were grouped broadly in five groups; Green tissues (GT, blue), Root tissues (RT, pink), Flower development stages (FDS, cyan), Flower parts (FP, orange), and Seed tissues (ST, gray), indicated in different colors. GS germinating seedling, S shoot, ML mature leaf, YL young leaf, Brac bracteole, R root, Rtip root tip, RH root hair, Nod nodule, SAM shoot apical meristem, FB1–FB4 stages of flower bud development, FL1–FL5 stage of flower development, Cal calyx, Cor corolla, And androecium, Gyn gynoecium, Pedi pedicel, Emb embryo, Endo endosperm, SdCt seed coat, PodSh podshell, 5DAP seed 5 days after pollination, 10DAP seed 10 days after pollination, 20DAP seed 20 days after pollination, 30DAP seed 30 days after pollination. D1, D2, and D3 represent first, second, and third dimension, respectively.
Fig. 3
Fig. 3. Tissue-specificity and comparative gene ontology (GO) enrichment map analysis.
a, b Heatmaps showing expression profiles of the tissue-specific protein-coding genes (PCGs) (a) and lncRNAs (b) in different tissue samples. Numbers given at the bottom indicate the number of tissue-specific genes/lncRNAs identified in each tissue sample. Color scales showing the Z-score are given on the right side. c, d Comparative GO enrichment maps of the tissue-specific PCGs (c) and lncRNAs (d) in the five groups. GO terms associated with different groups, green tissues (GT), root tissues (RT), flower development stages (FDS), flower parts (FP), and seed tissues (ST), are indicated in different colors. Only the significantly enriched (P value ≤0.05) biological process GO terms are shown.
Fig. 4
Fig. 4. Coexpression network analysis in chickpea.
a Bar graph showing the fraction of transcription factor (TF) encoding genes, non-TF protein-coding genes and lncRNAs included in each module (M1–M24). The total number of transcripts included in each module are given below each bar. b Heatmap showing correlation of each module (M1–M24) with different tissue samples. The correlation value and significance value are given in each box. The correlation values are shown in color scale also.
Fig. 5
Fig. 5. Expression profile and transcriptional regulatory network associated with modules correlated to multiple tissues or stages of development.
Heatmaps show the expression profile of all the coexpressed genes in the module(s) correlated with multiple tissues, including root tissues (a), flower bud and flower development stages (b), and 20DAP and 30DAP stages of seed development (c). Color scales represent Z-score. Bar graphs (below the heat maps) show the consensus expression pattern of the coexpressed transcripts in each module. The predicted transcriptional regulatory network (significantly enriched TF-binding sites along with the associated TFs and GO terms) associated with the transcript sets in the modules are shown below the heatmaps. The significantly enriched cis-regulatory motifs only in protein-coding genes (PCGs), and both PCGs and lncRNAs are shown by green and sea green triangles, respectively. The associated GO terms only in PCGs, and both PCGs and lncRNAs are shown by blue and sea green hexagons, respectively. The TFs are represented by pink ovals. Edges represent known interactions between the cis-regulatory motifs and transcription factors.
Fig. 6
Fig. 6. Expression profile and transcriptional regulatory network associated with the modules correlated to a specific tissue or stage of development.
Heatmaps show the expression profile of all the coexpressed genes in the module(s) correlated with the given specific tissue, including root hair (a), androecium (b), 20DAP (c), embryo (d), and endosperm (e). Color scales represent Z-score. Bar graphs (below the heat maps) show the consensus expression pattern of the coexpressed transcripts in each module. The predicted transcriptional regulatory network (significantly enriched TF-binding sites along with the associated TFs and GO terms) associated with the transcripts sets in the modules are shown below the heatmaps. The significantly enriched cis-regulatory motifs only in protein-coding genes (PCGs), and both PCGs and lncRNAs are shown by green and sea green triangles, respectively. The associated GO terms only in PCGs, and both PCGs and lncRNAs are shown by blue and sea green hexagons, respectively. The TFs are represented by pink ovals. Edges represent known interactions between the cis-regulatory motifs and transcription factors.
Fig. 7
Fig. 7. Candidate transcripts exhibiting tissue-specific expression associated with quantitative trait loci (QTLs).
a Heatmaps illustrate the tissue-specific expression of the candidate genes located within 100 seed weight (100 SDW) and other traits (HI, PHT, RTR, SDW, RLD, DM, POD, and/or DC) associated QTLs. The identifiers of the transcripts located on the QTLs of different traits are shown in different colors. The transcripts representing lncRNAs are marked with asterisks. The tissue specificity (TS) of each transcript is also indicated. Transcription factor family annotation (TF) and coexpression module (M), if any, of the transcripts are also given. The color scale at the bottom represents the expression level in Z-score. b Ideogram showing the genomic location of the candidate genes in the quantitative trait loci (QTLs; solid colored boxes) on the chickpea genome (vertical bars). QTLs/candidate genes for different traits are shown in different colored boxes/fonts as shown in the legend. The position of QTL-hotspot on chromosome 4 and the candidate genes lying within this region are marked with blue colored boxes. c The DNA polymorphisms (SNPs and Indels) differentiating small- and large-seeded chickpea genotypes that are located in the promoter (2 kb upstream) regions of the transcripts are shown. The cis-regulatory elements harboring the DNA polymorphisms are also indicated.
Fig. 8
Fig. 8. Candidate transcripts exhibiting abiotic stress-responsive expression associated with quantitative trait loci (QTLs) in the chickpea cultivars.
a, c Heatmaps showing the differential expression of transcripts located in the drought (a) and salinity (c) related QTLs and harbor DNA polymorphisms in their promoter regions. For drought stress (a), the differential expression within/between the drought-tolerant (Dtol) and drought-sensitive (Dsen) chickpea genotypes under drought stress (DS) or control (CT) condition at early reproductive (ER) and late reproductive (LR) stages is shown. For salinity stress (c), the differential expression within/between the salinity-tolerant (Stol) and salinity-sensitive (Ssen) chickpea genotypes under salinity stress (SS) or control (CT) condition at vegetative (Veg) and late reproductive (LR) stages is shown. Scales at the bottom of a and c represent log2 fold-change differential expression. b, d The DNA polymorphisms (SNPs and InDels) differentiating the drought-tolerant and drought-sensitive (b), and salinity-tolerant and salinity-sensitive (d) chickpea genotypes that are located in the promoter (2 kb upstream) regions of the transcripts (given in a and c) are shown. The cis-regulatory elements harboring the DNA polymorphisms are also indicated.

Similar articles

Cited by

References

    1. Tiwari BK, Tripathi PN. Yield gap analysis of chickpea (Cicer arietinum) through front line demonstration on farmer’s fields. J. Rural Agric. Res. 2014;14:5–8.
    1. Jain M, et al. A draft genome sequence of the pulse crop chickpea (Cicer arietinum L.) Plant J. 2013;74:715–729. doi: 10.1111/tpj.12173. - DOI - PubMed
    1. Varshney RK, et al. Draft genome sequence of chickpea (Cicer arietinum) provides a resource for trait improvement. Nat. Biotechnol. 2013;31:240–246. doi: 10.1038/nbt.2491. - DOI - PubMed
    1. Varshney RK, et al. A chickpea genetic variation map based on the sequencing of 3,366 genomes. Nature. 2021;599:622–627. doi: 10.1038/s41586-021-04066-1. - DOI - PMC - PubMed
    1. Jain M. Next-generation sequencing technologies for gene expression profiling in plants. Brief. Funct. Genomics. 2012;11:63–70. doi: 10.1093/bfgp/elr038. - DOI - PubMed

Publication types