. 2023 Jun;41(6):1162-1176.
doi: 10.1002/jor.25470. Epub 2022 Nov 7.

Metformin improves tendon degeneration by blocking translocation of HMGB1 and suppressing tendon inflammation and senescence in aging mice

Affiliations

Metformin improves tendon degeneration by blocking translocation of HMGB1 and suppressing tendon inflammation and senescence in aging mice

Jianying Zhang et al. J Orthop Res. 2023 Jun.

Abstract

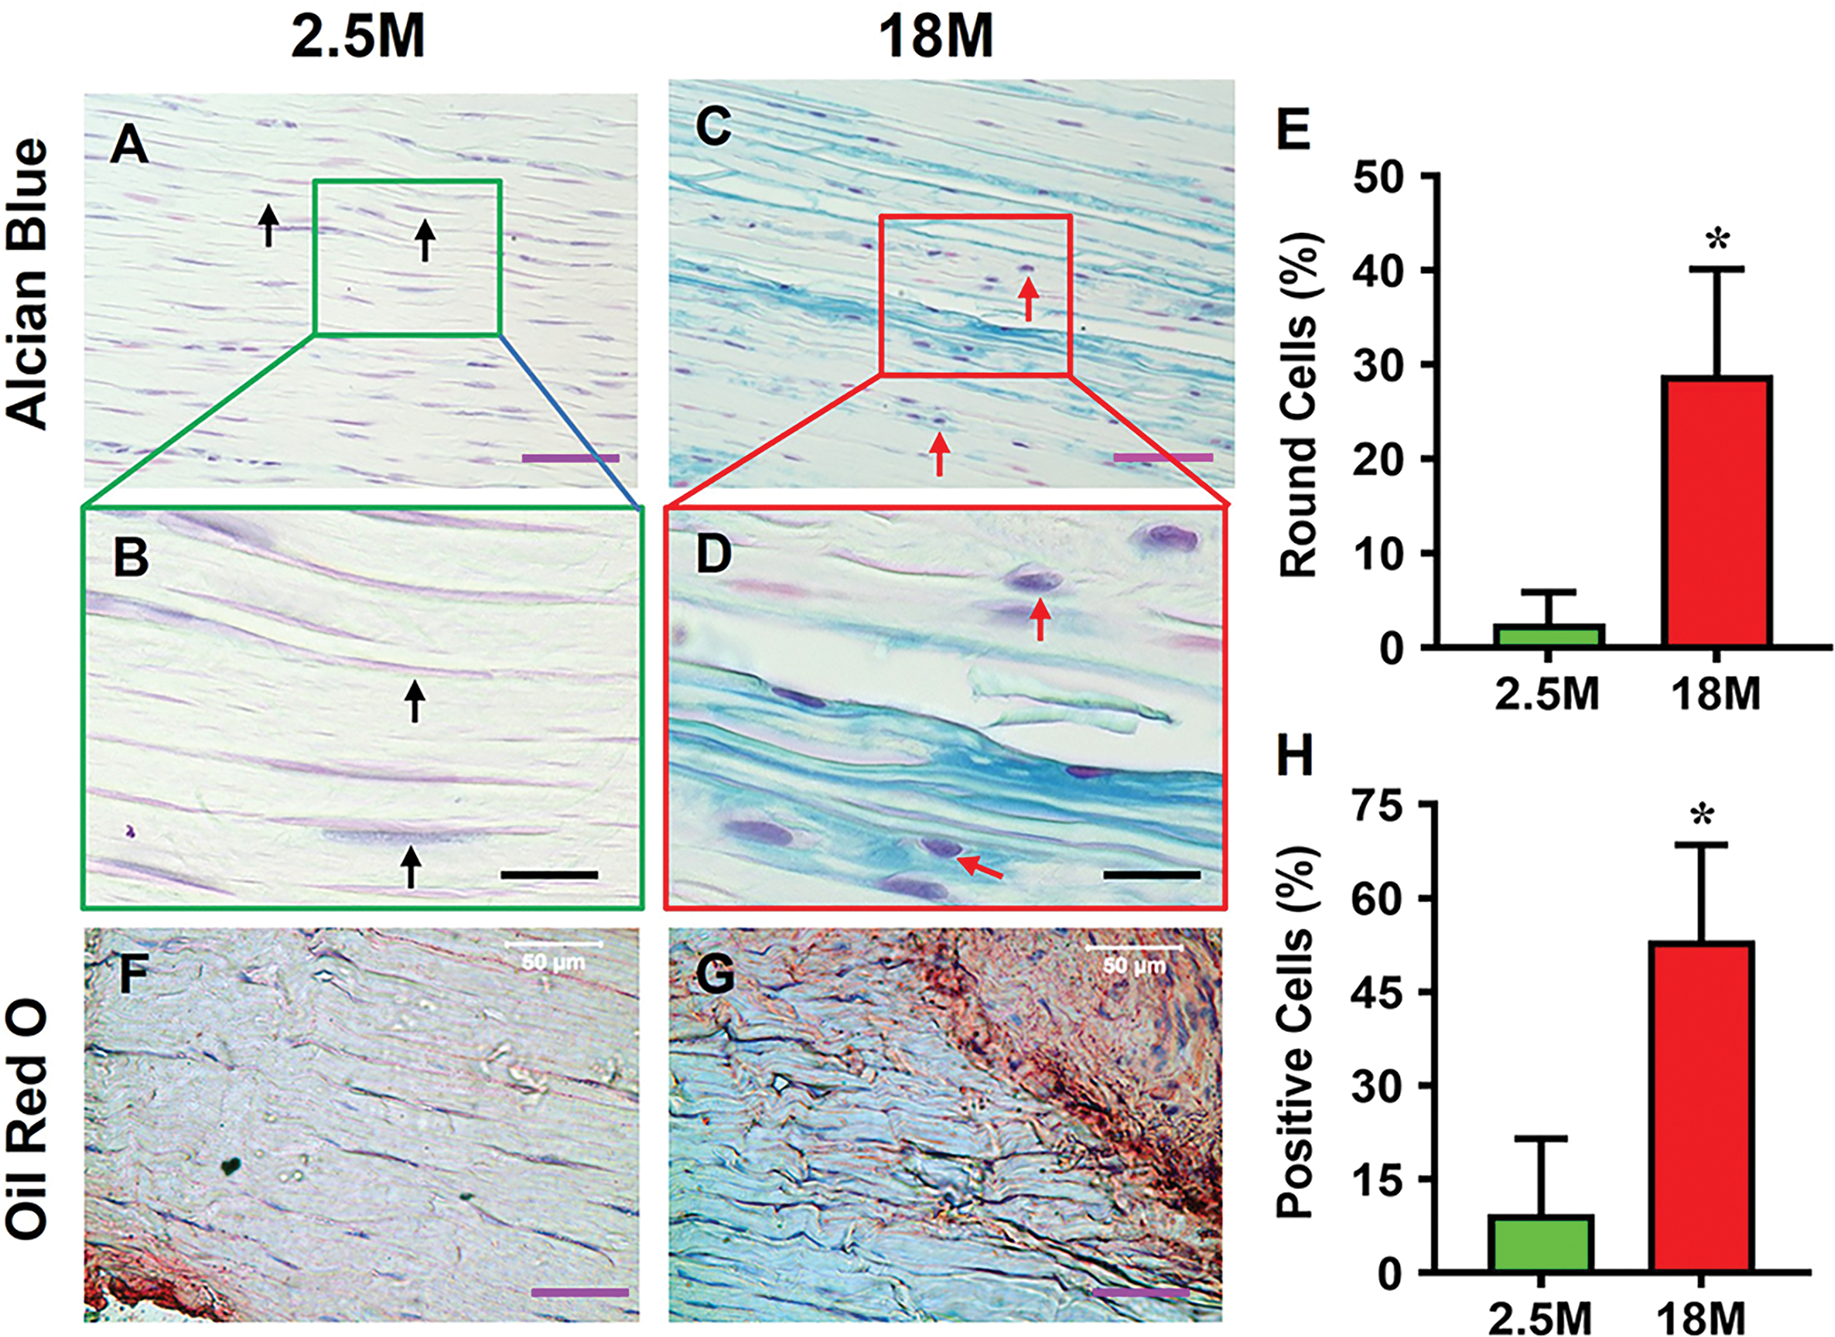
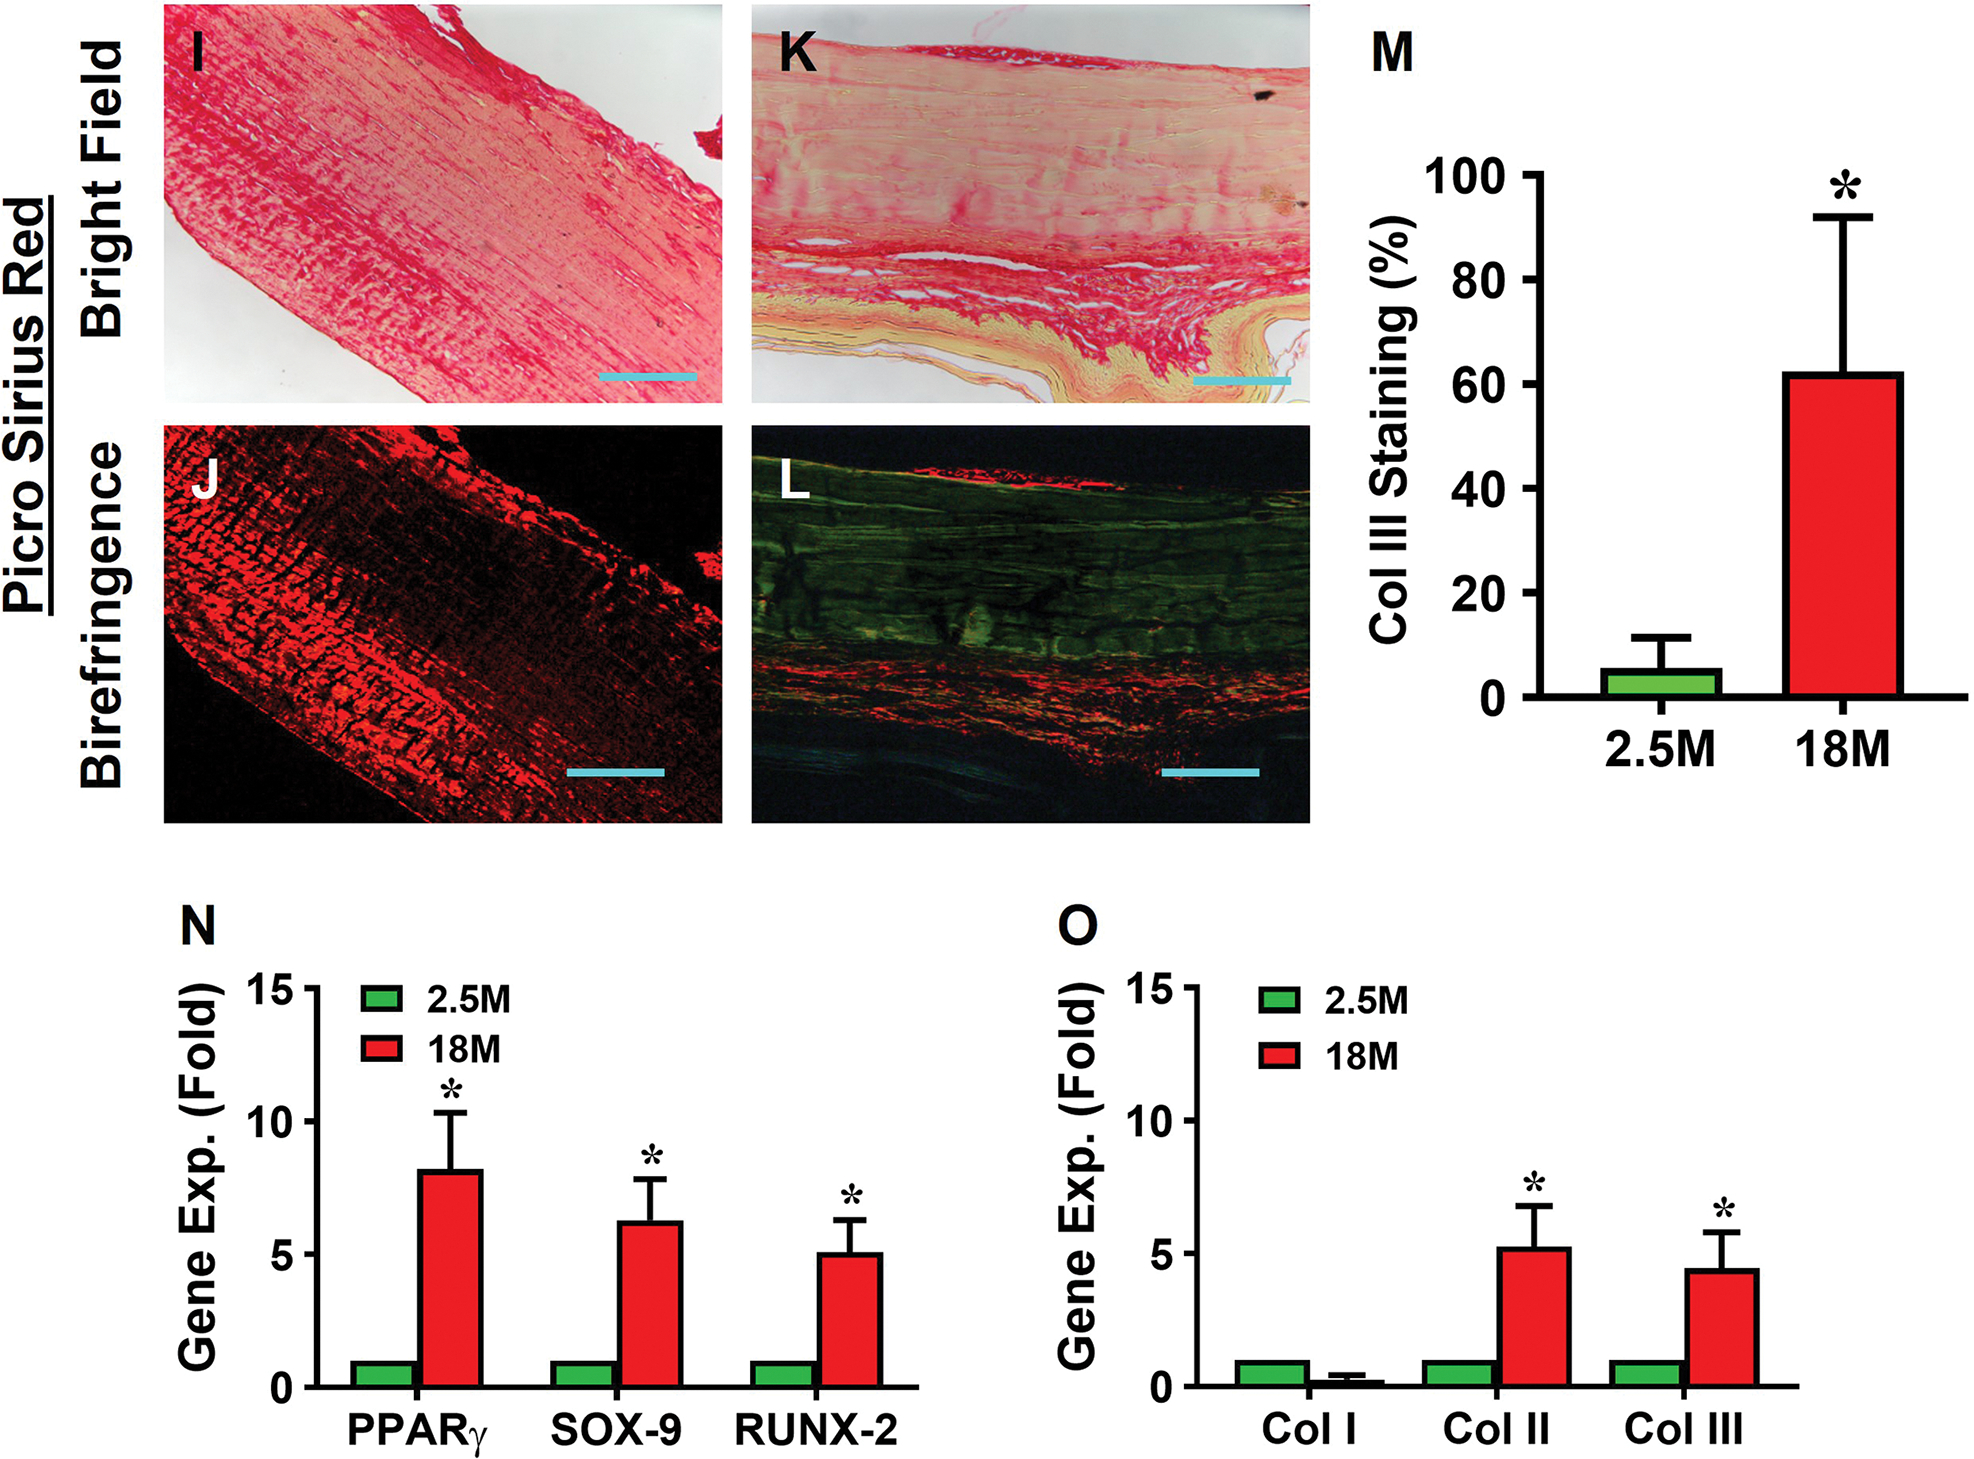
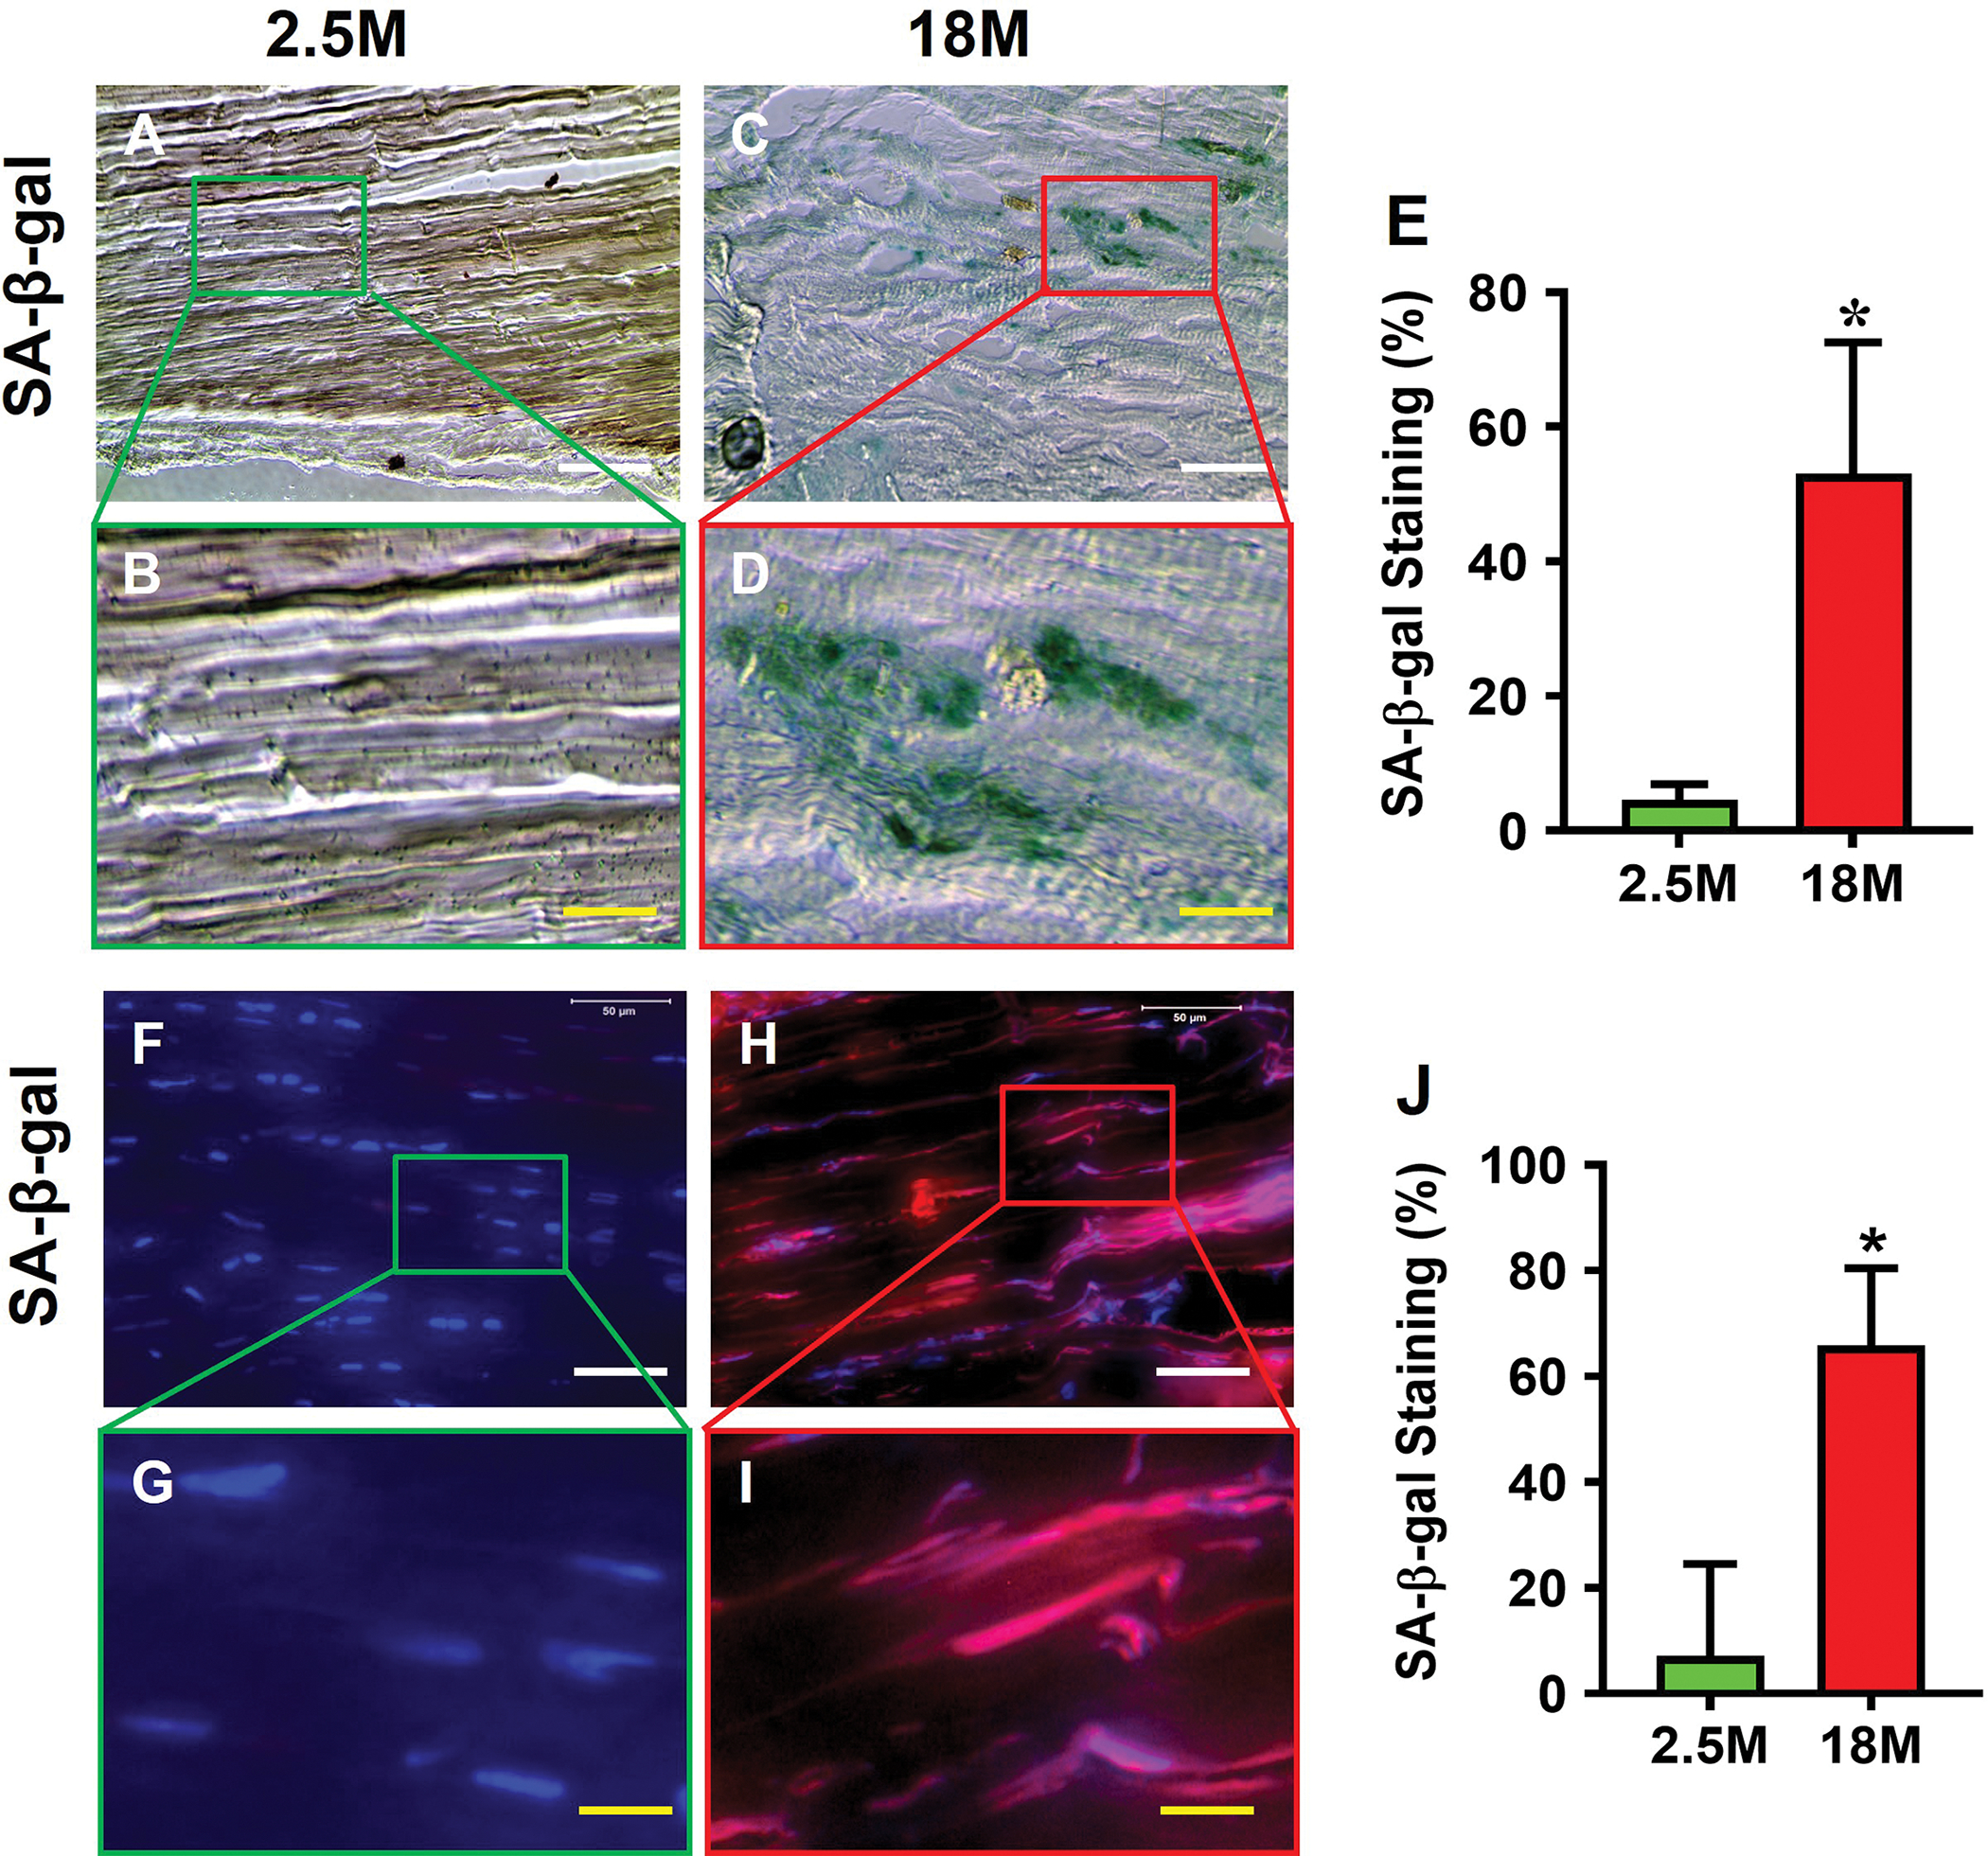
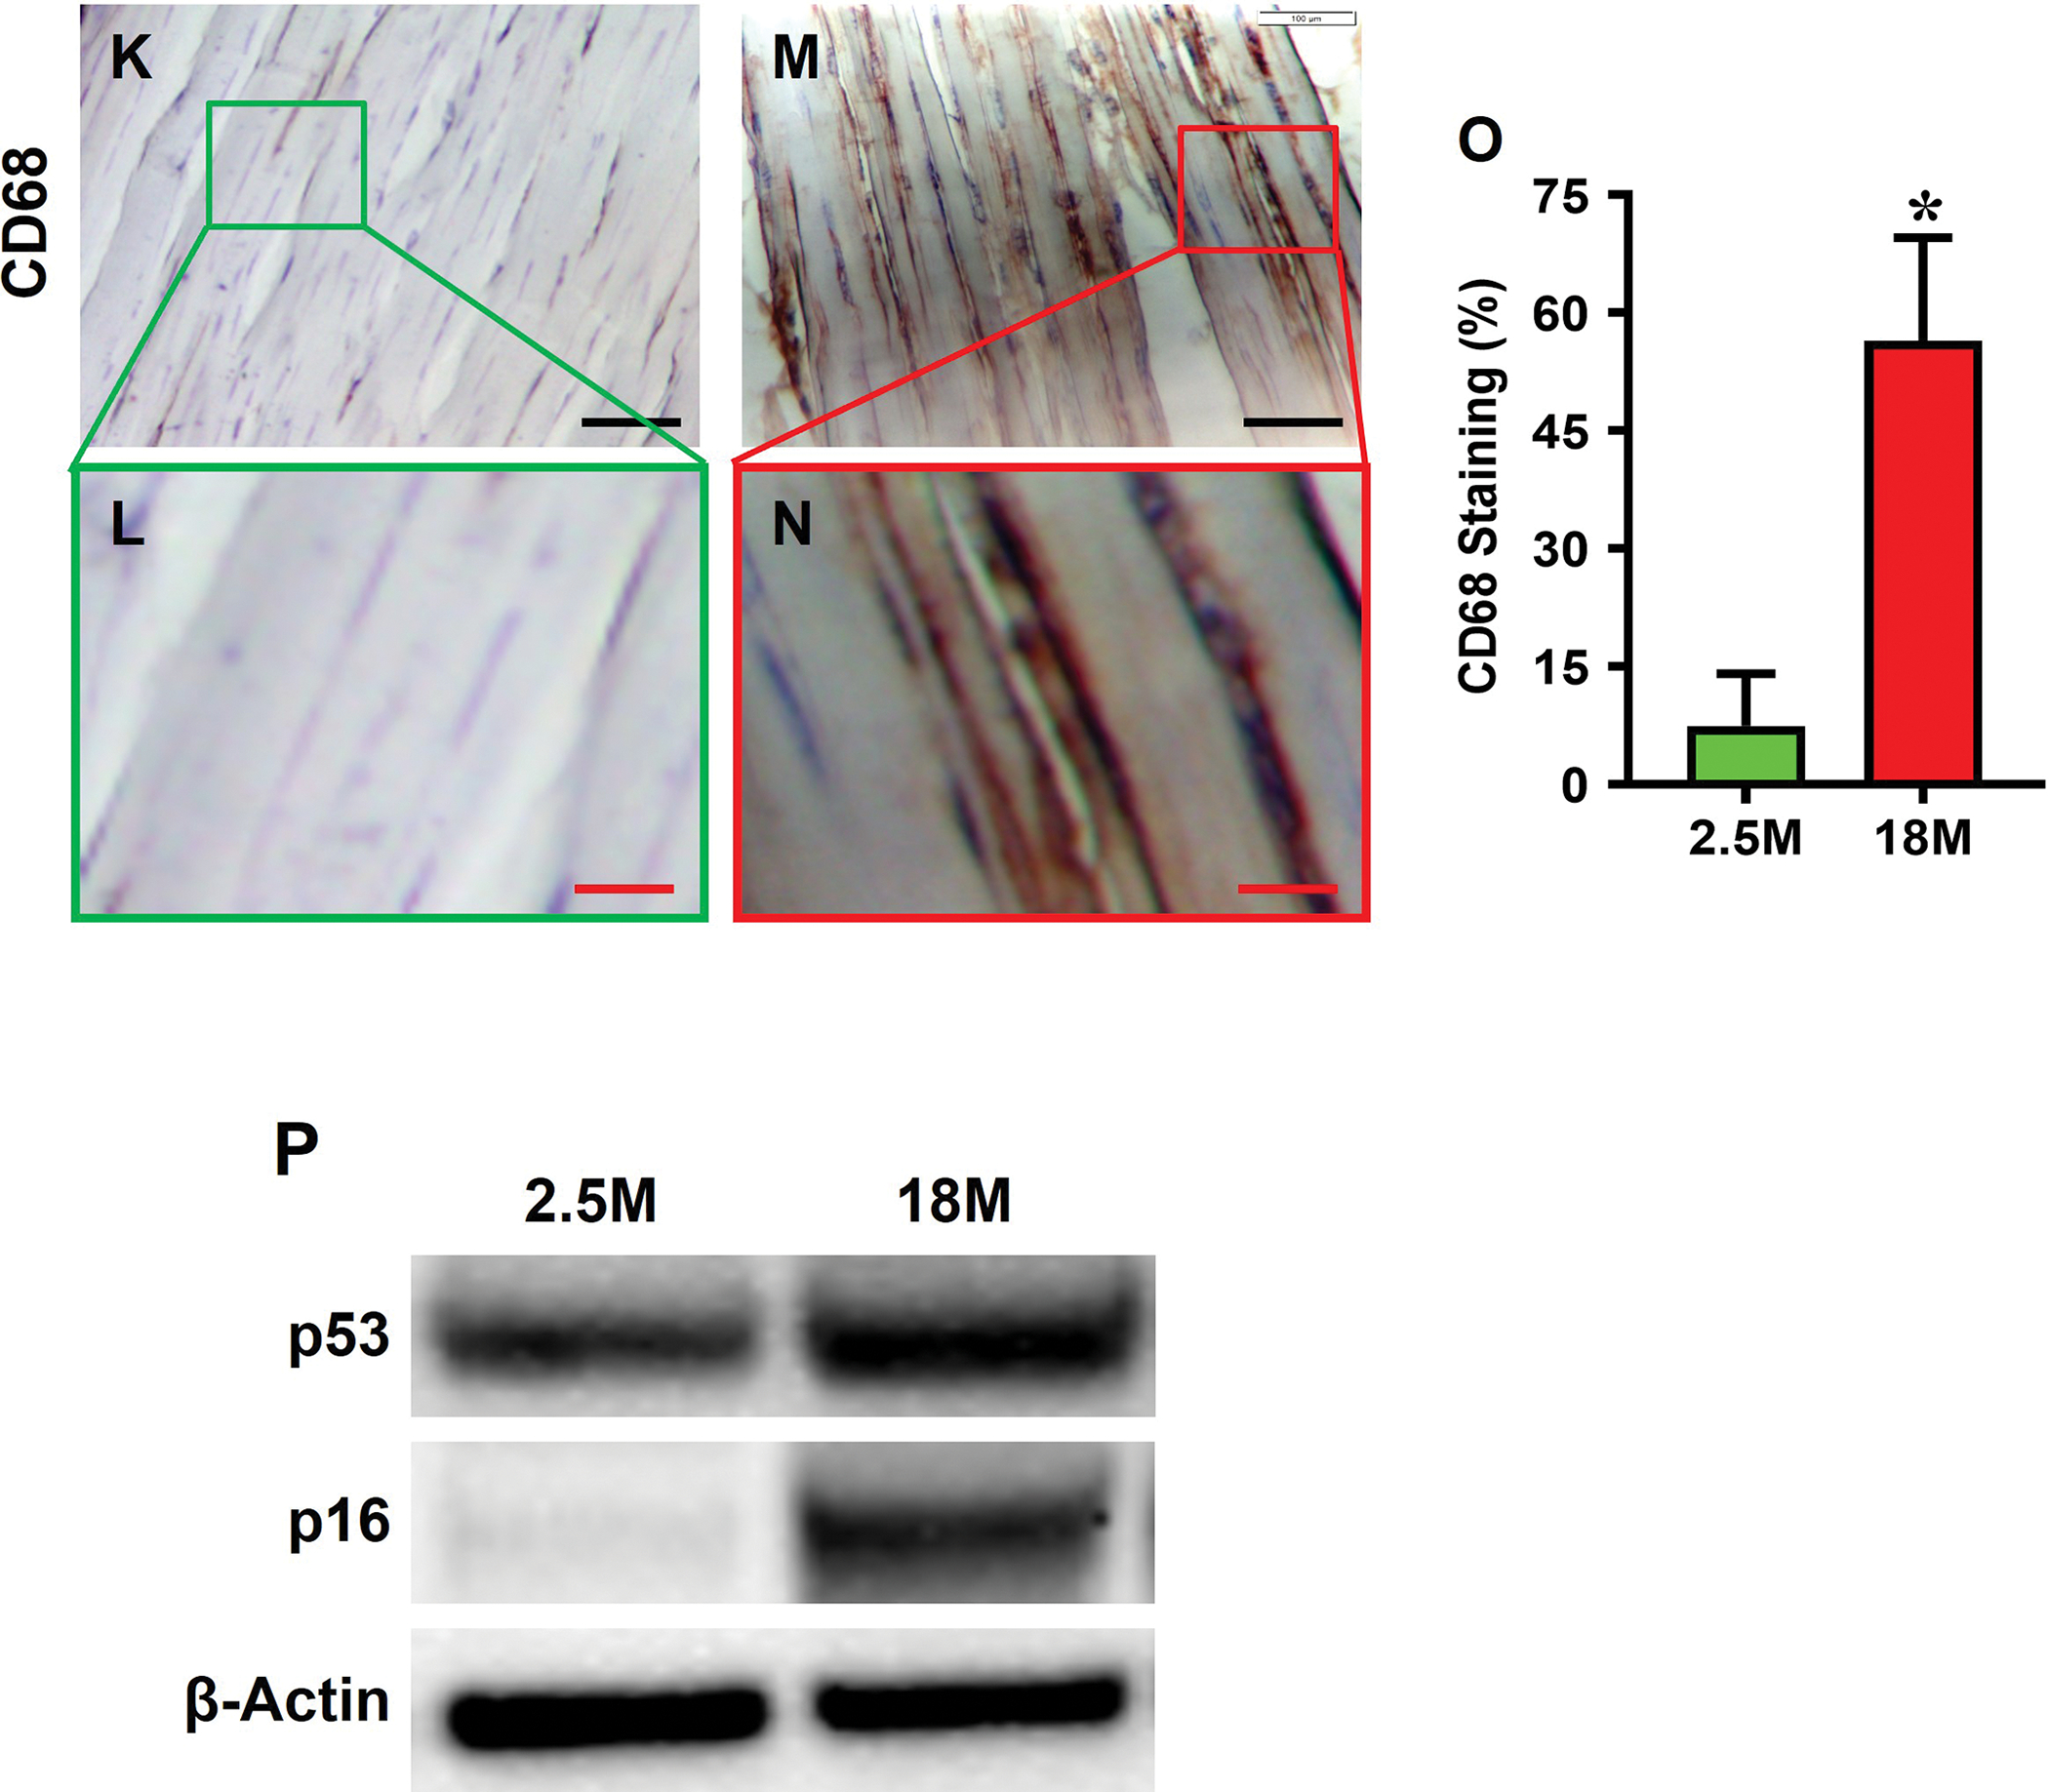
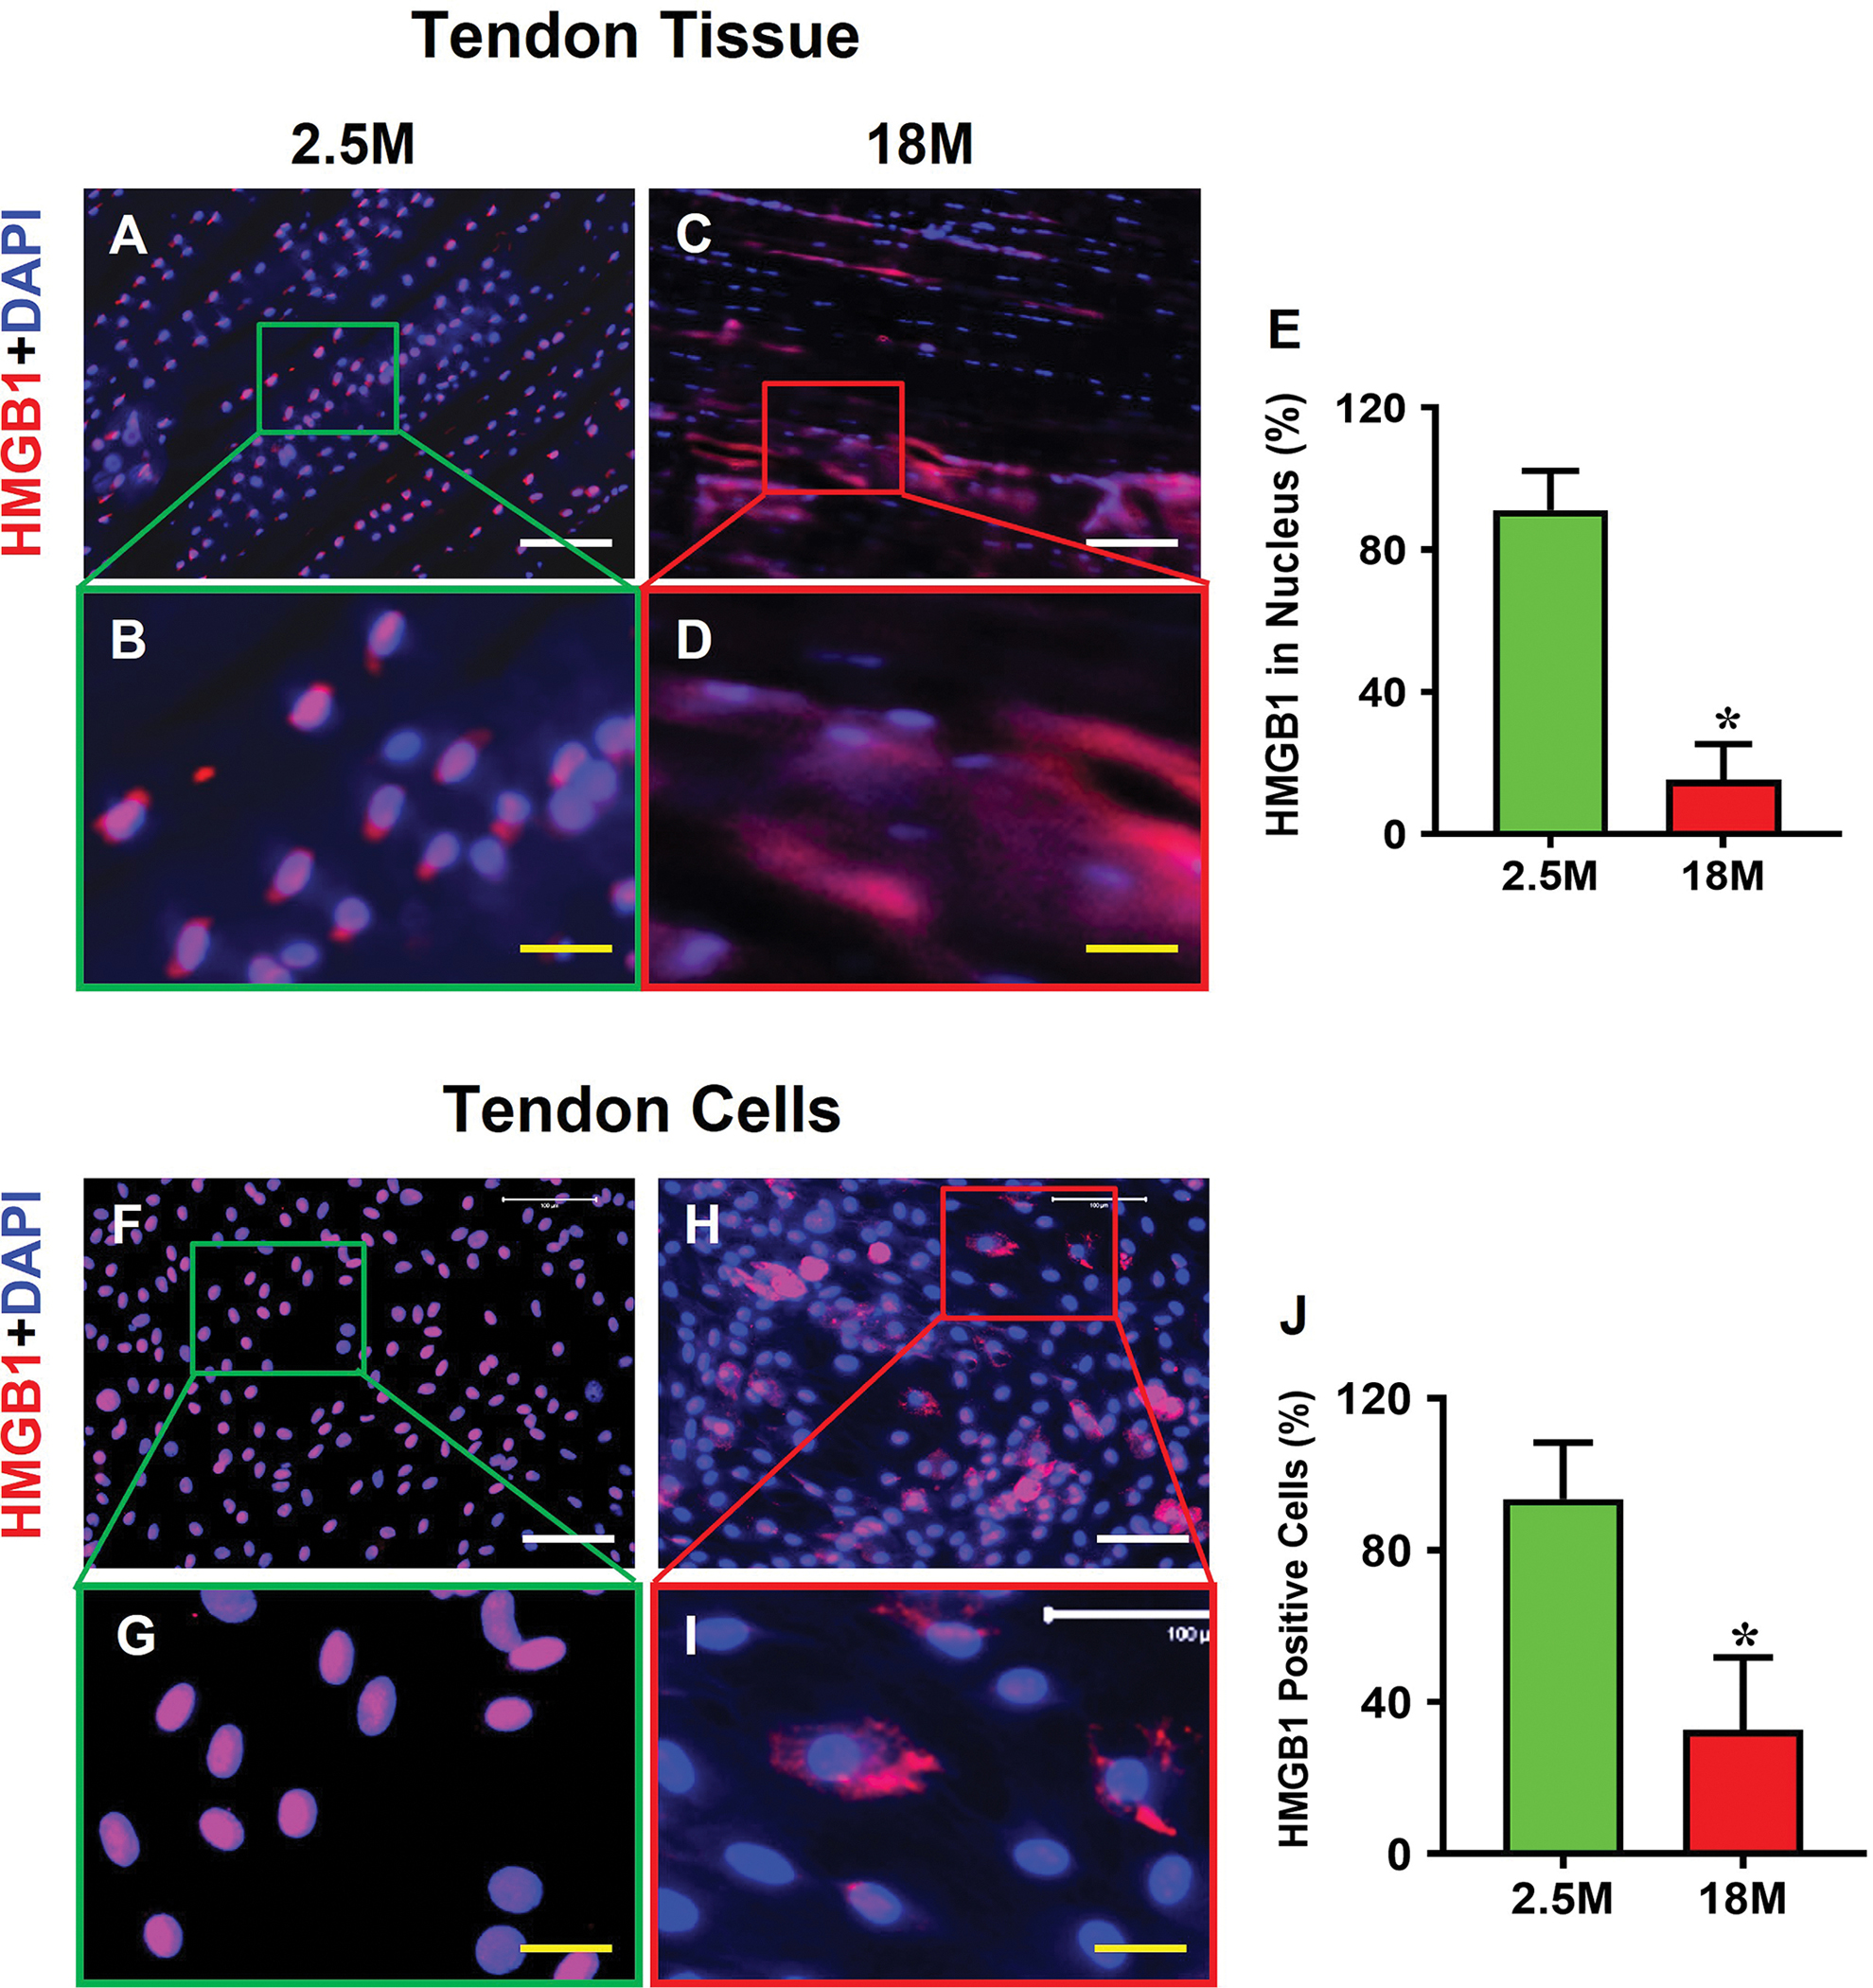
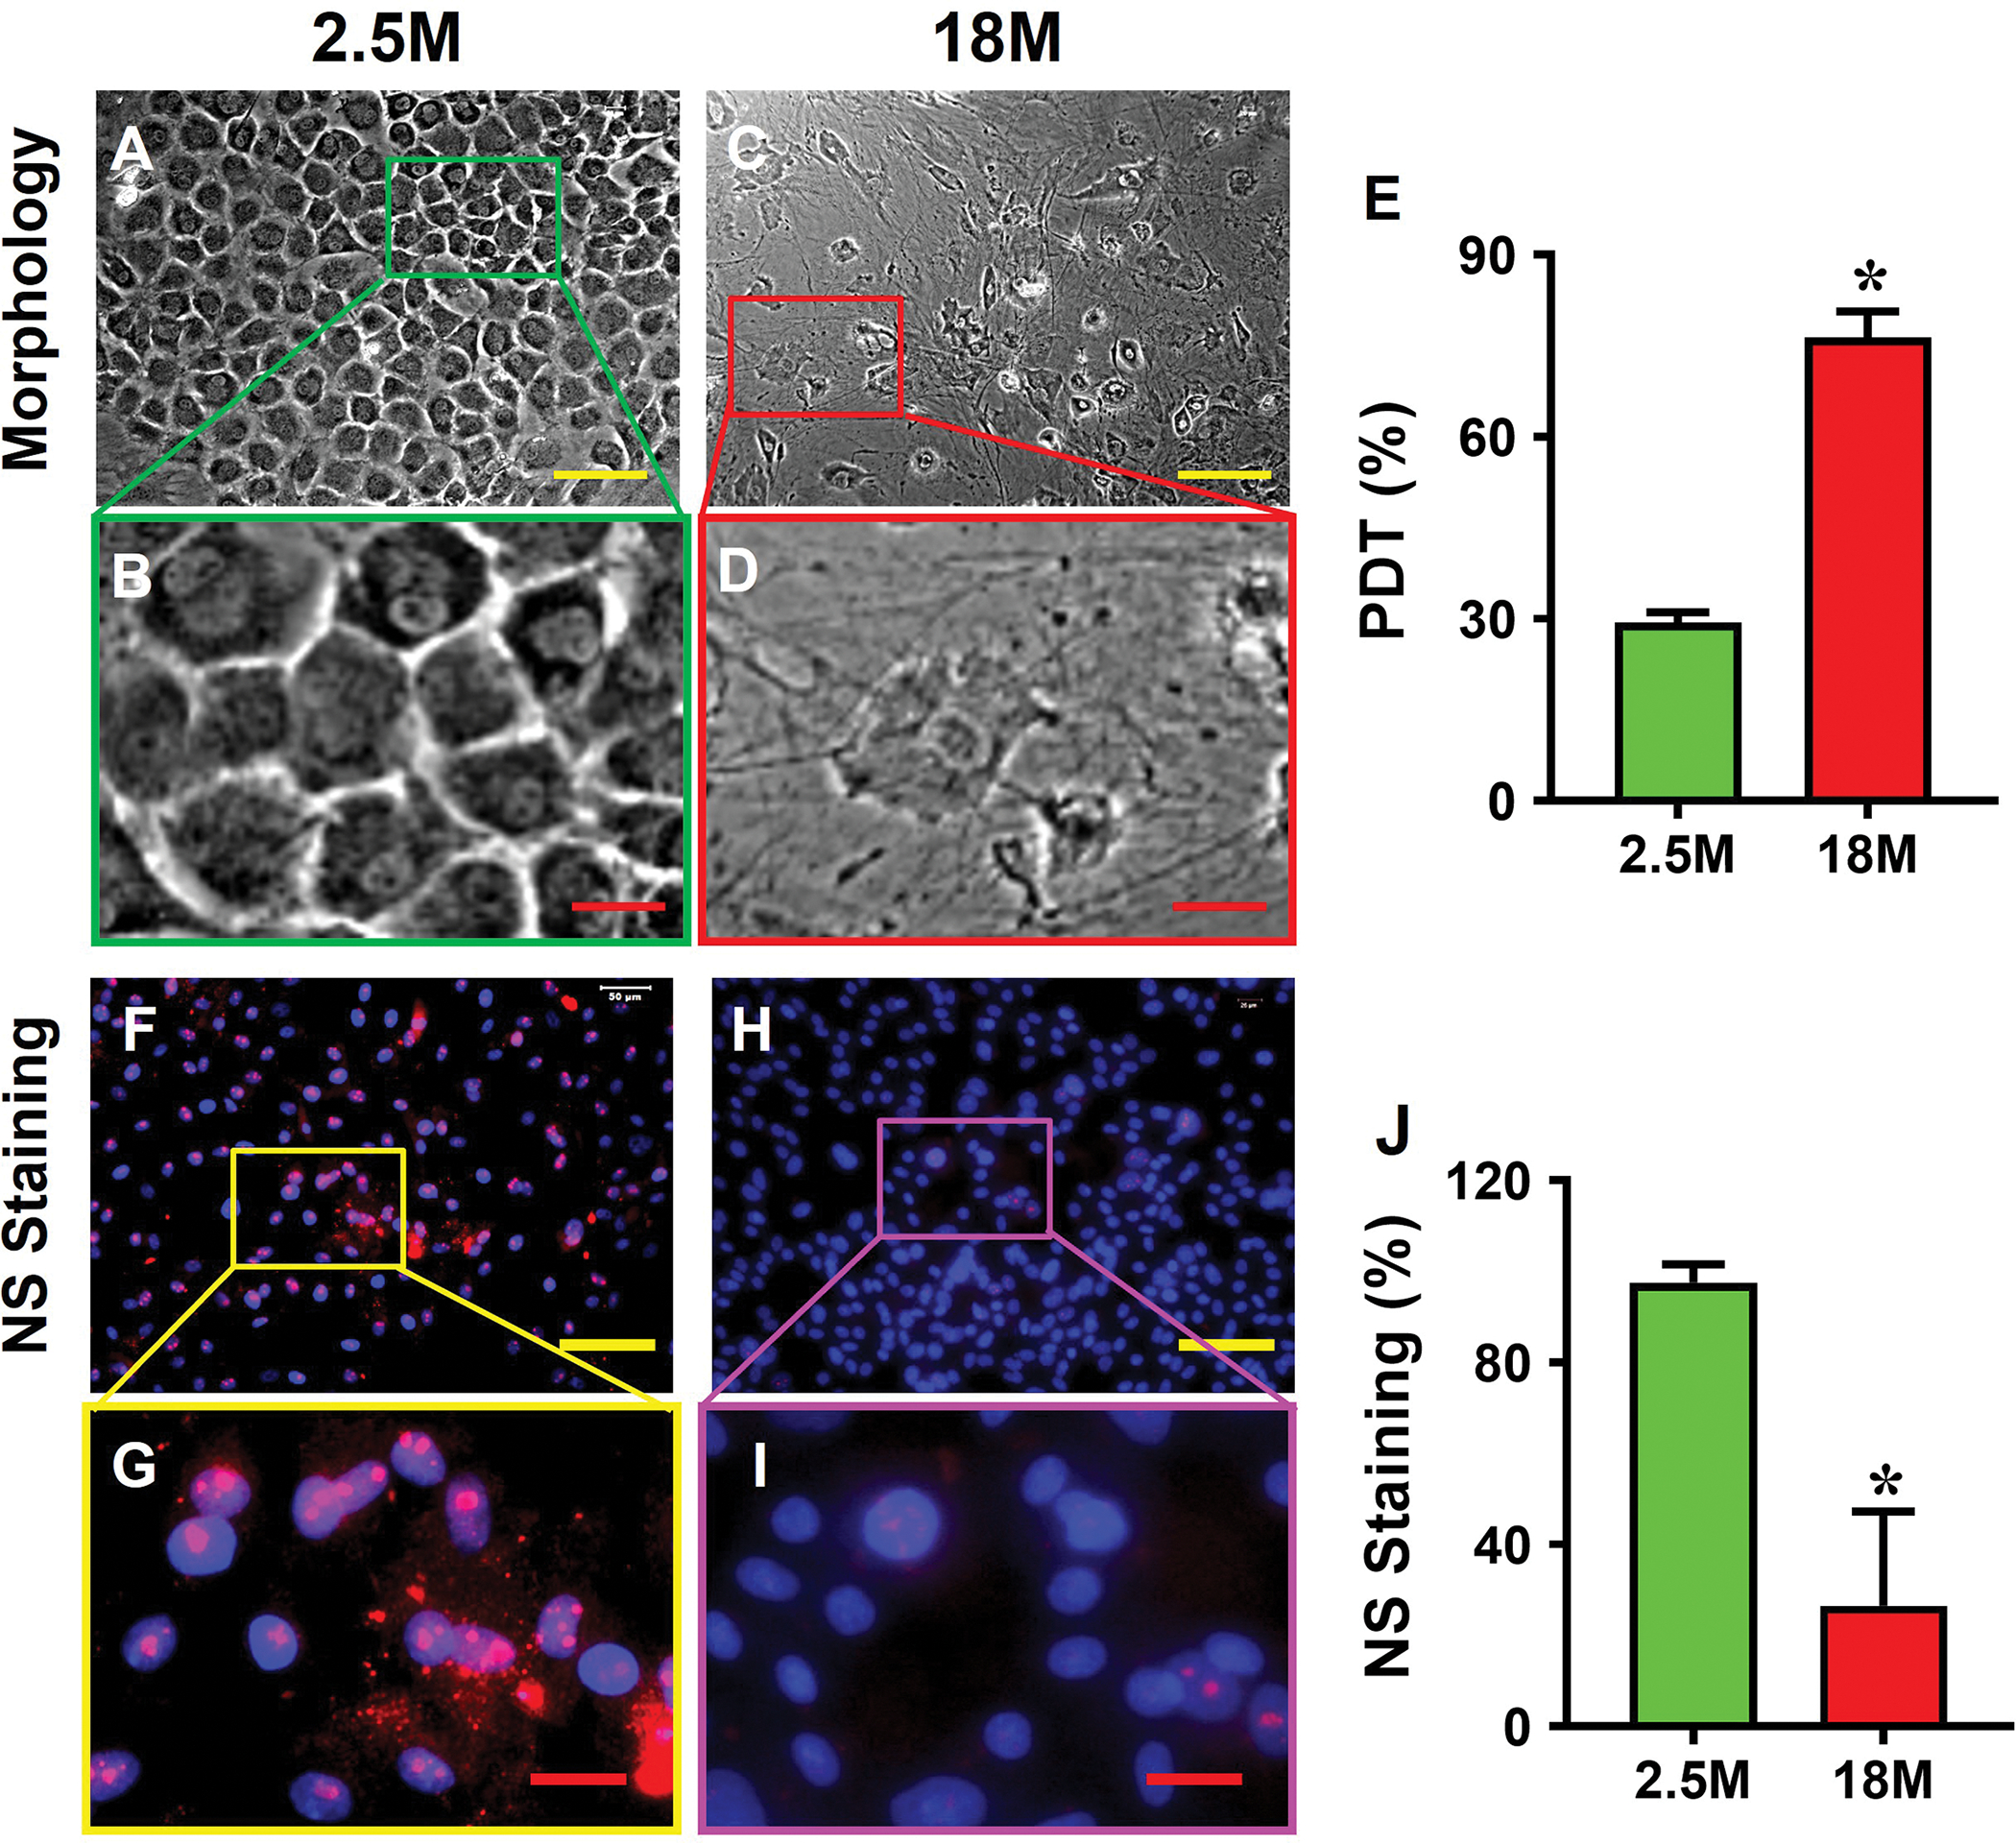
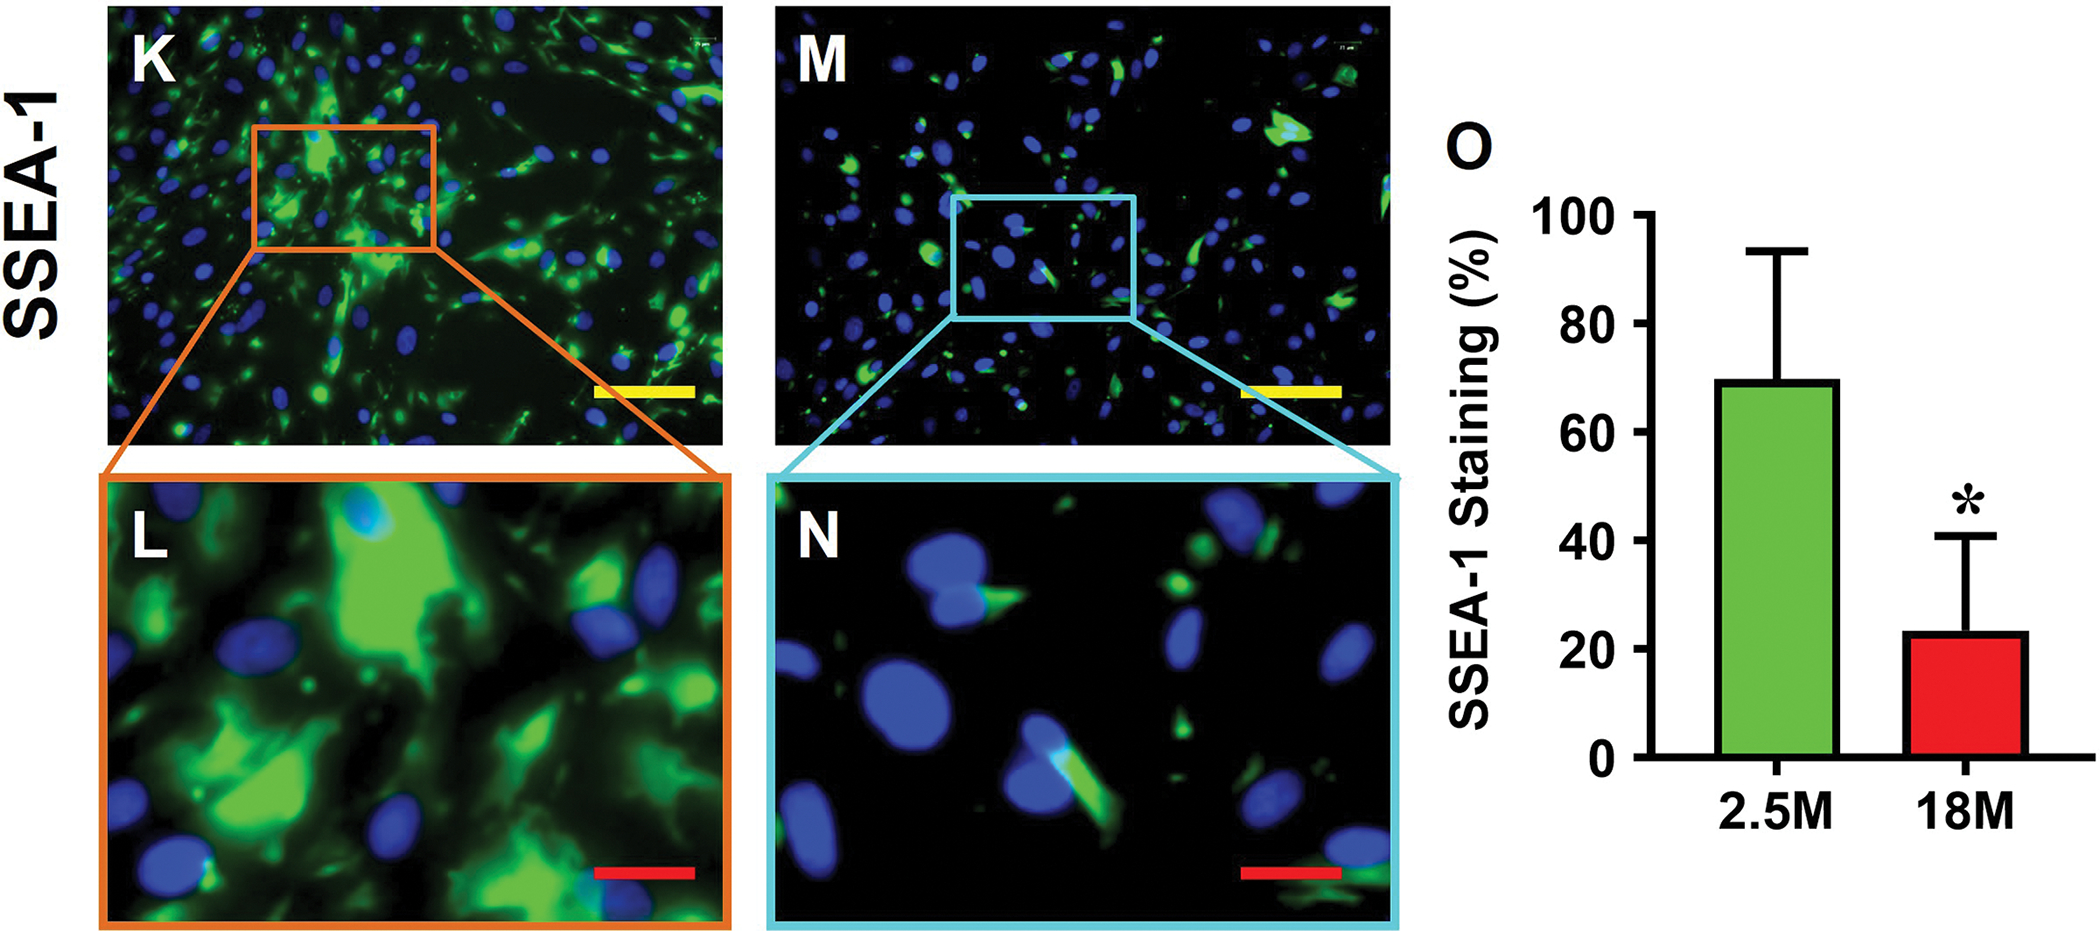
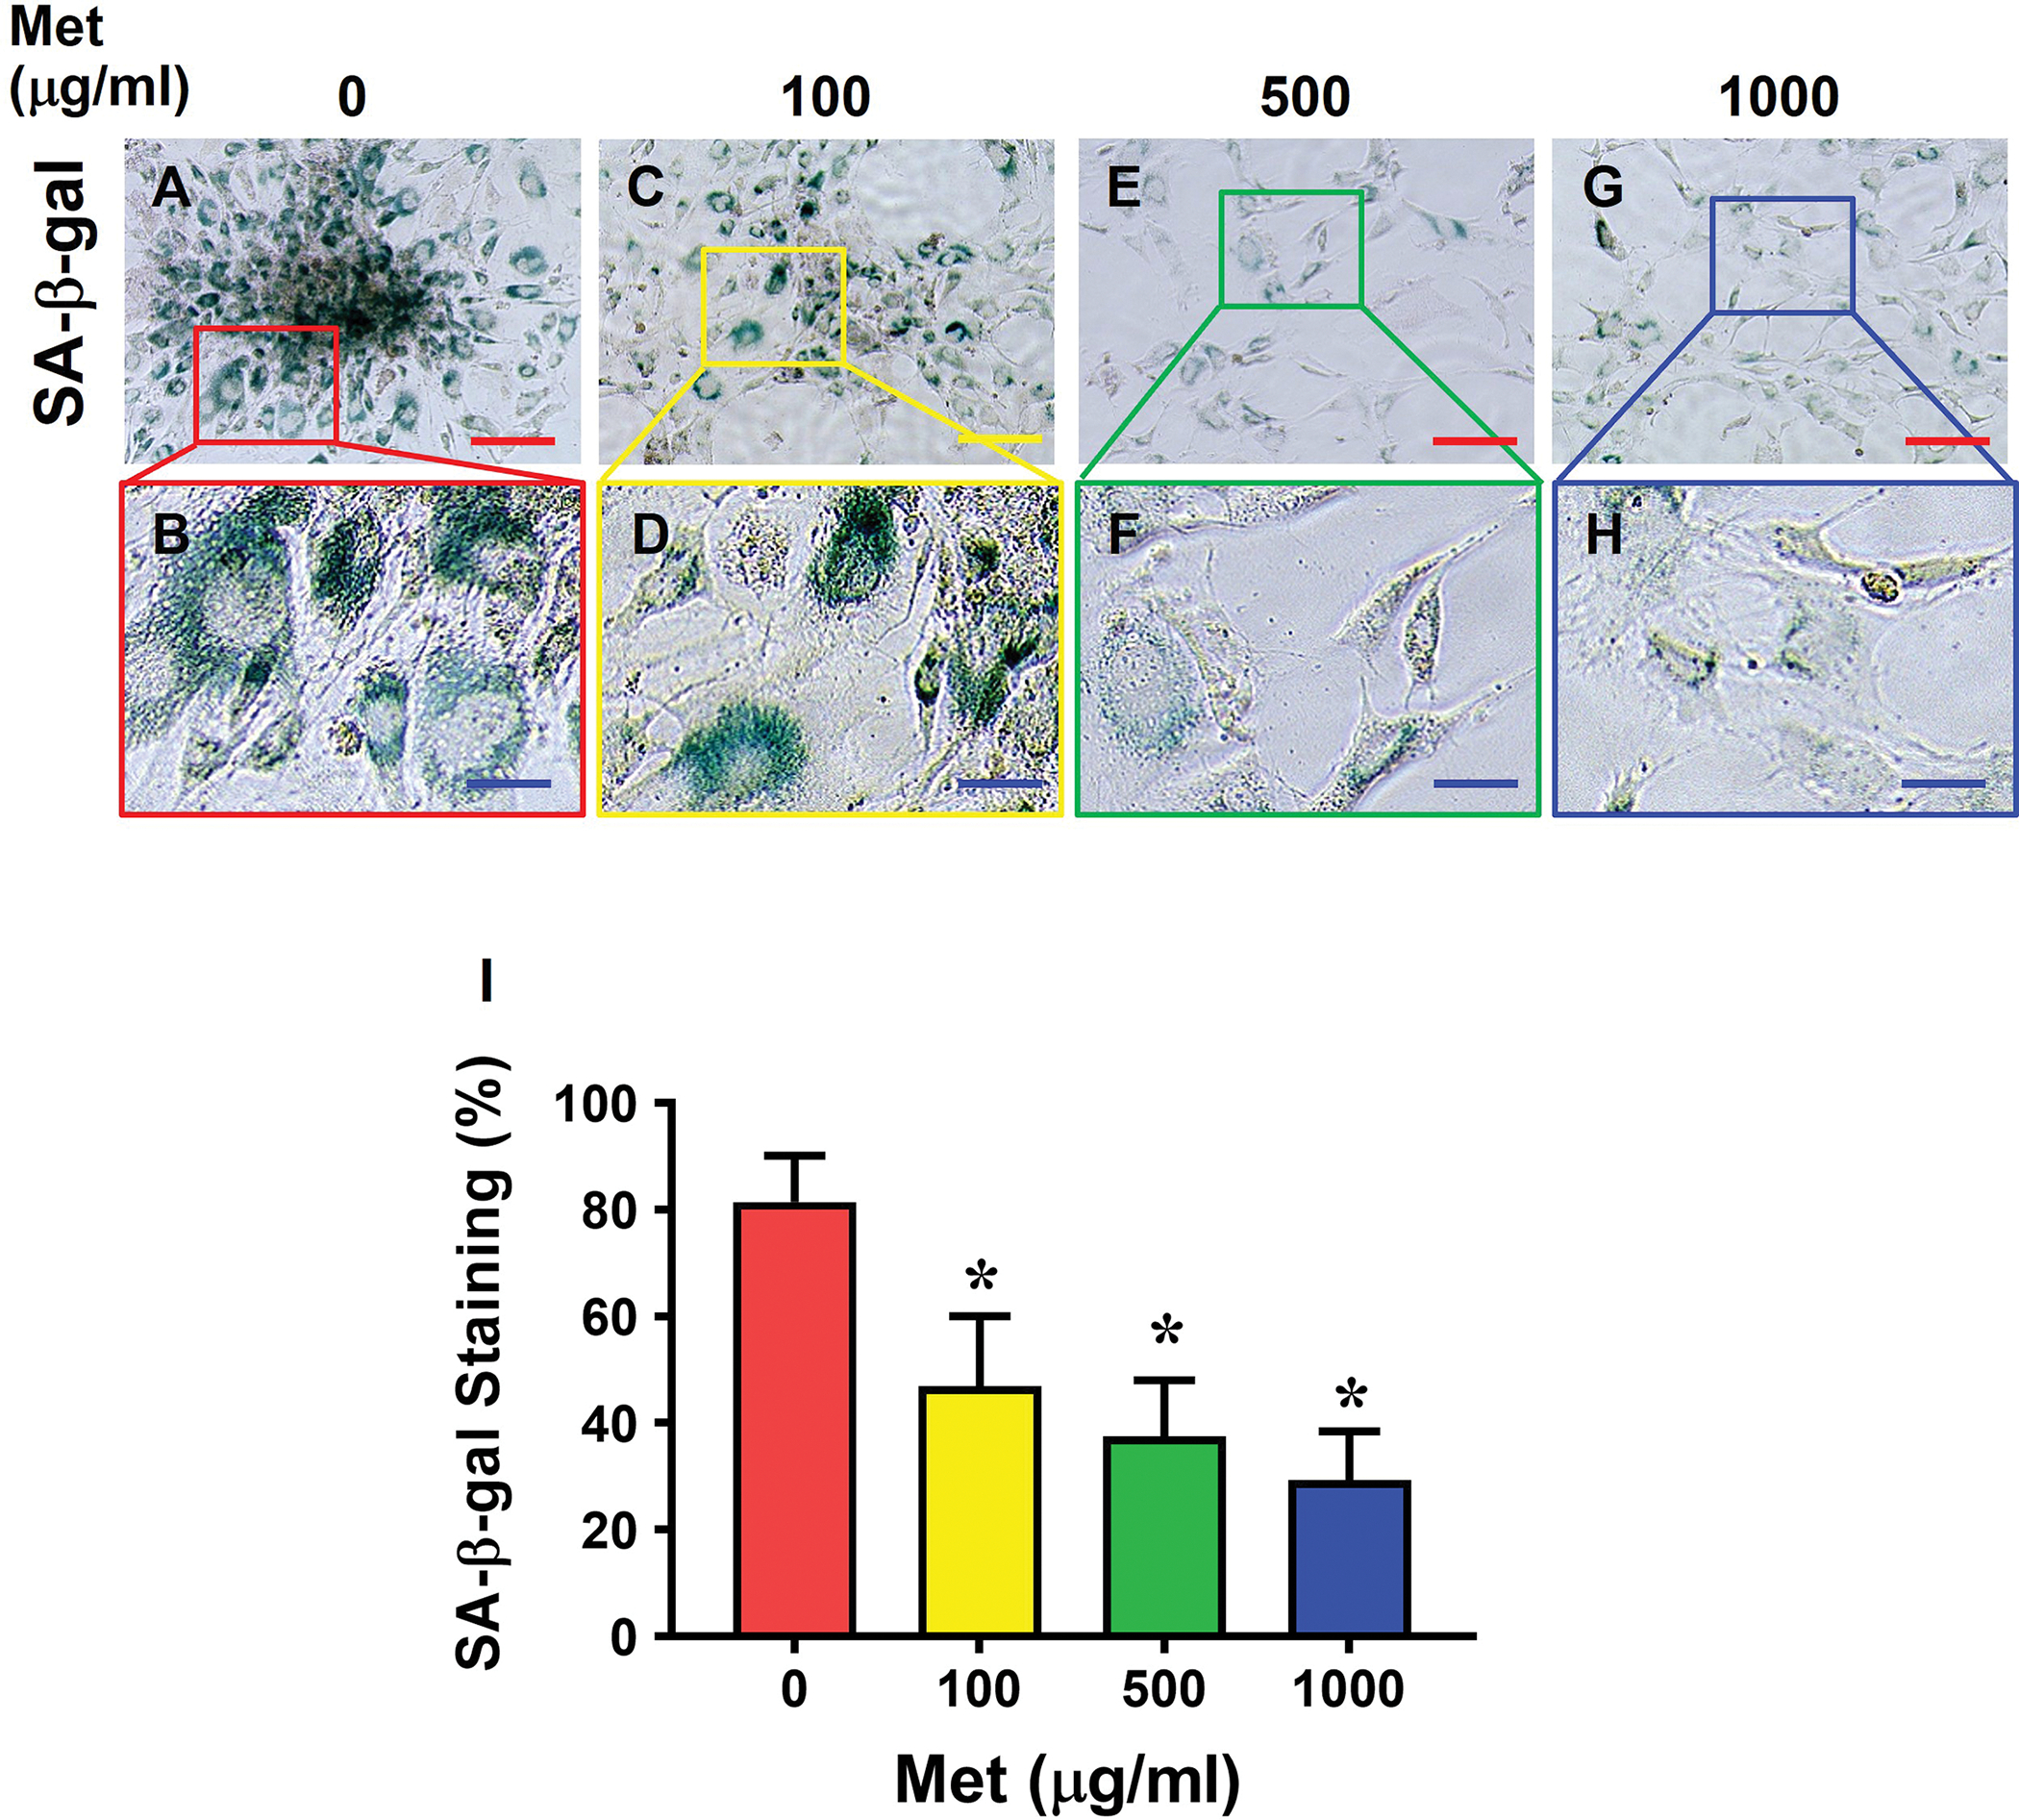
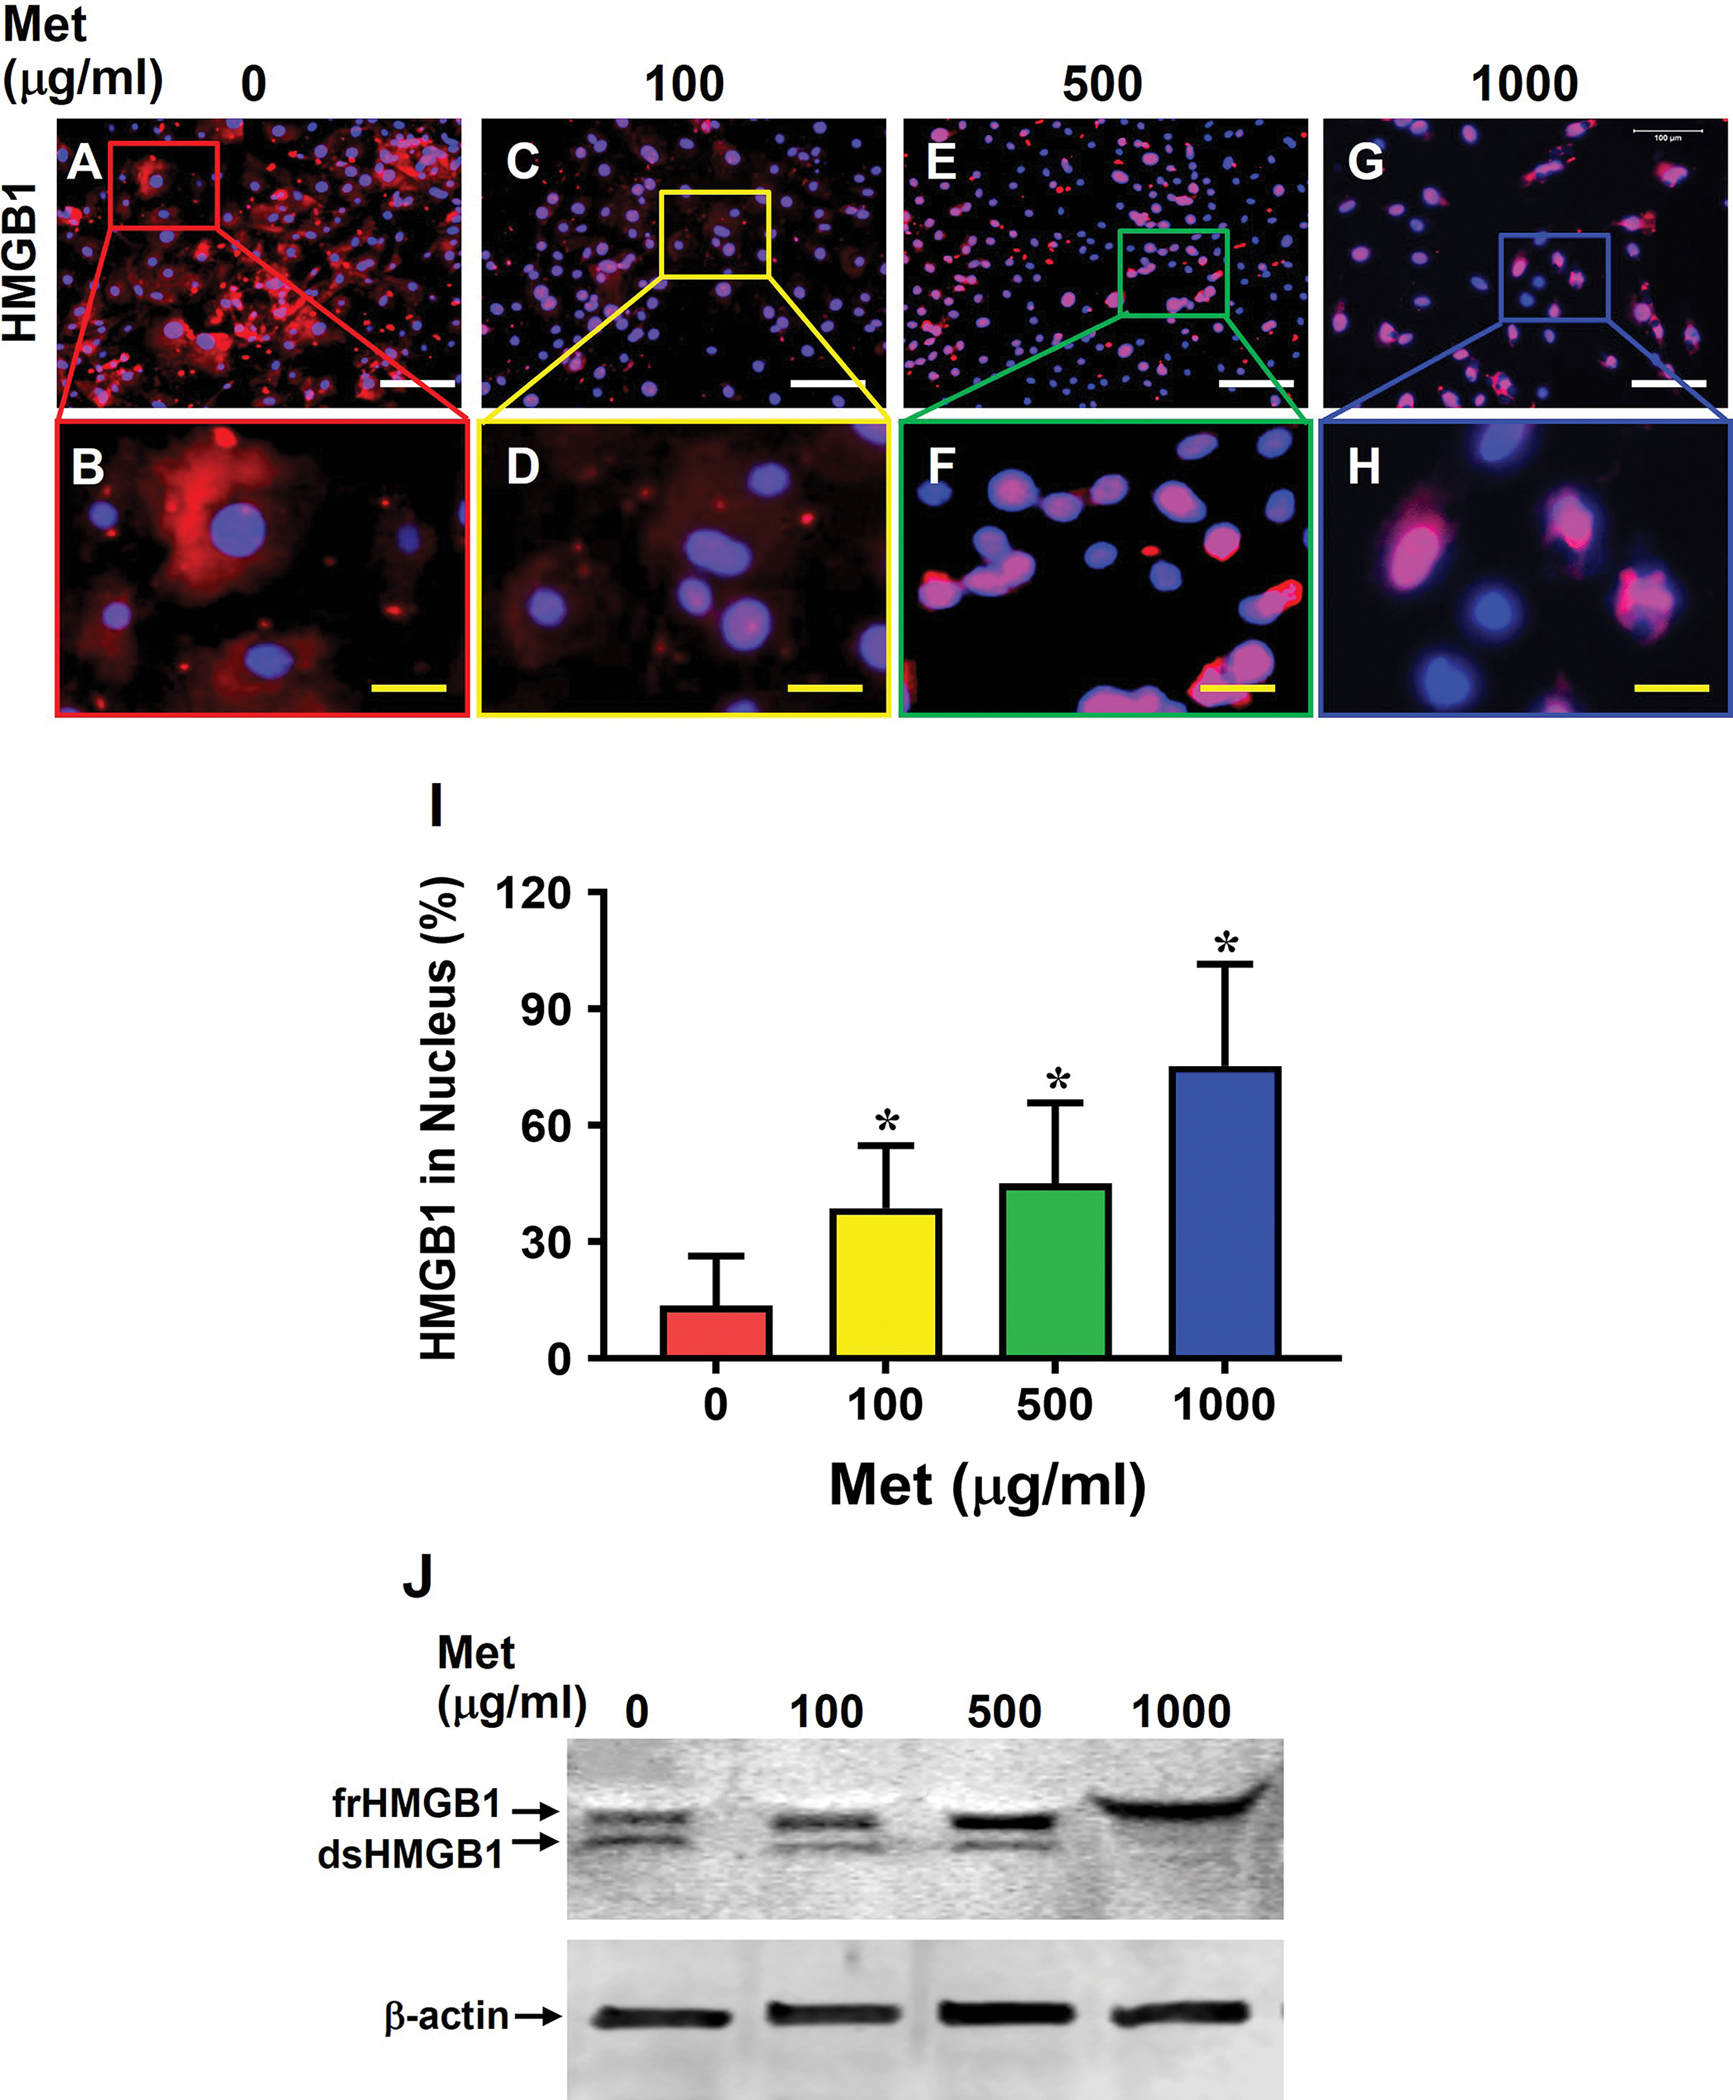
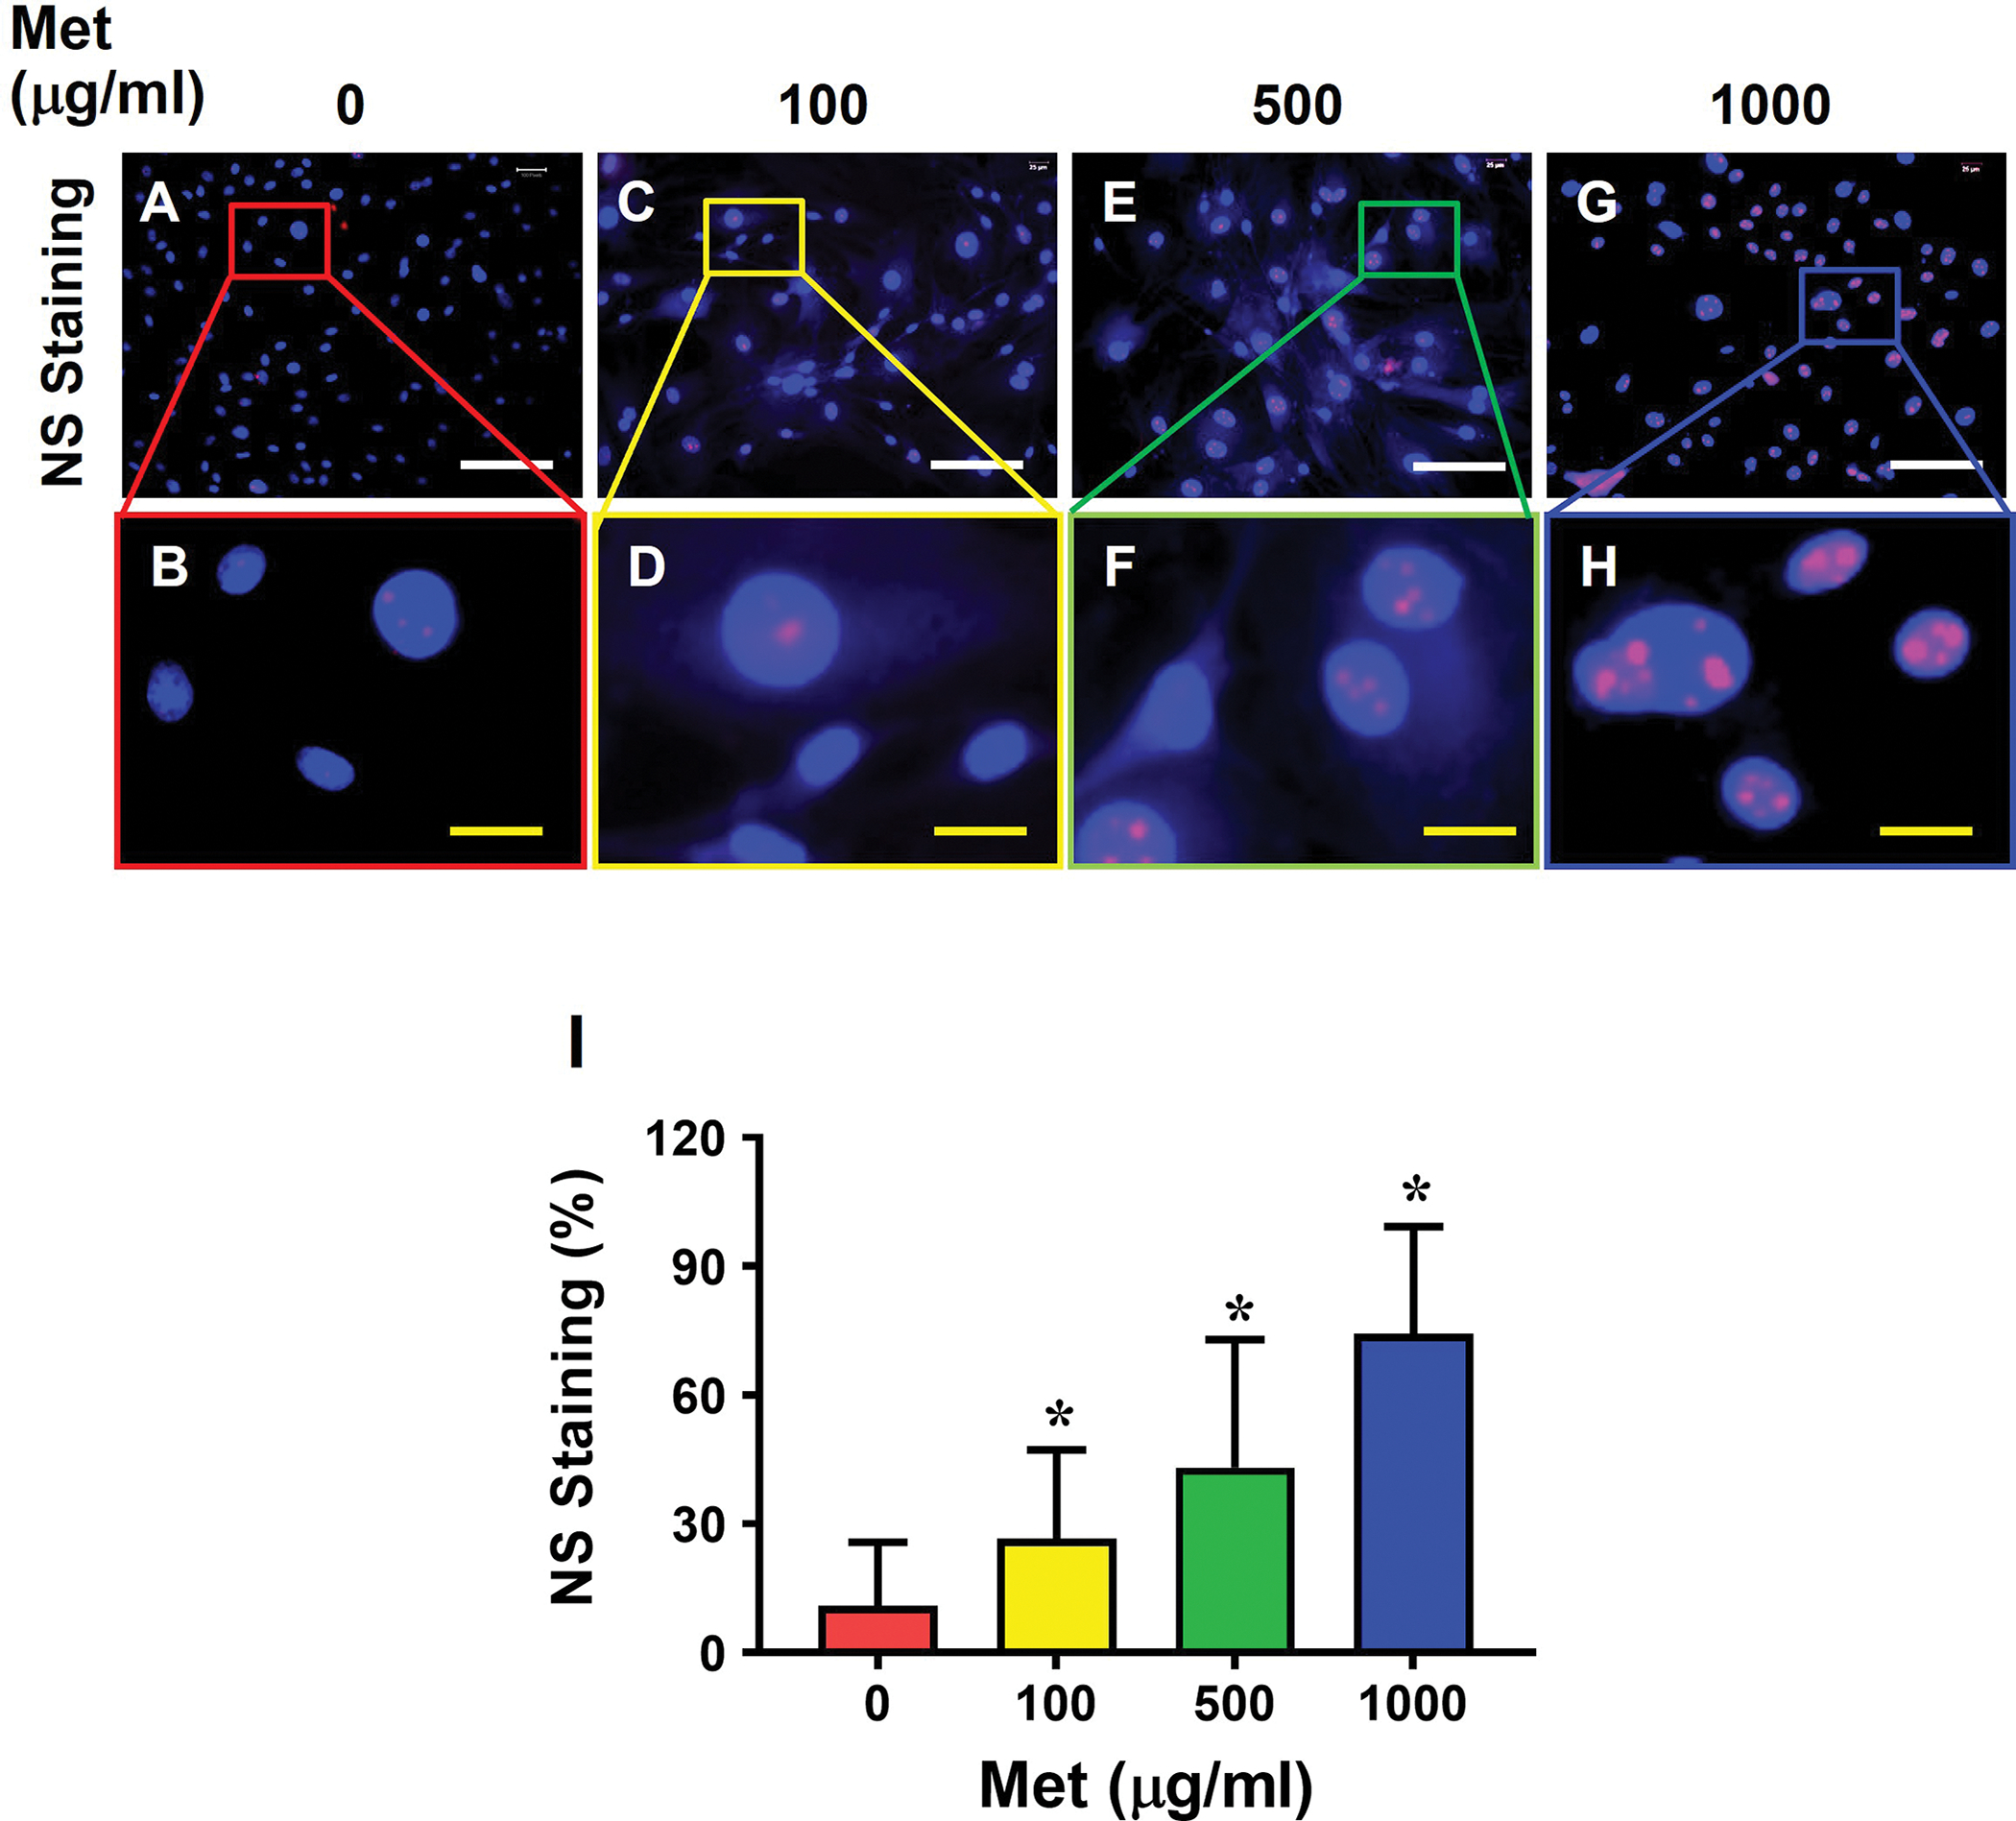
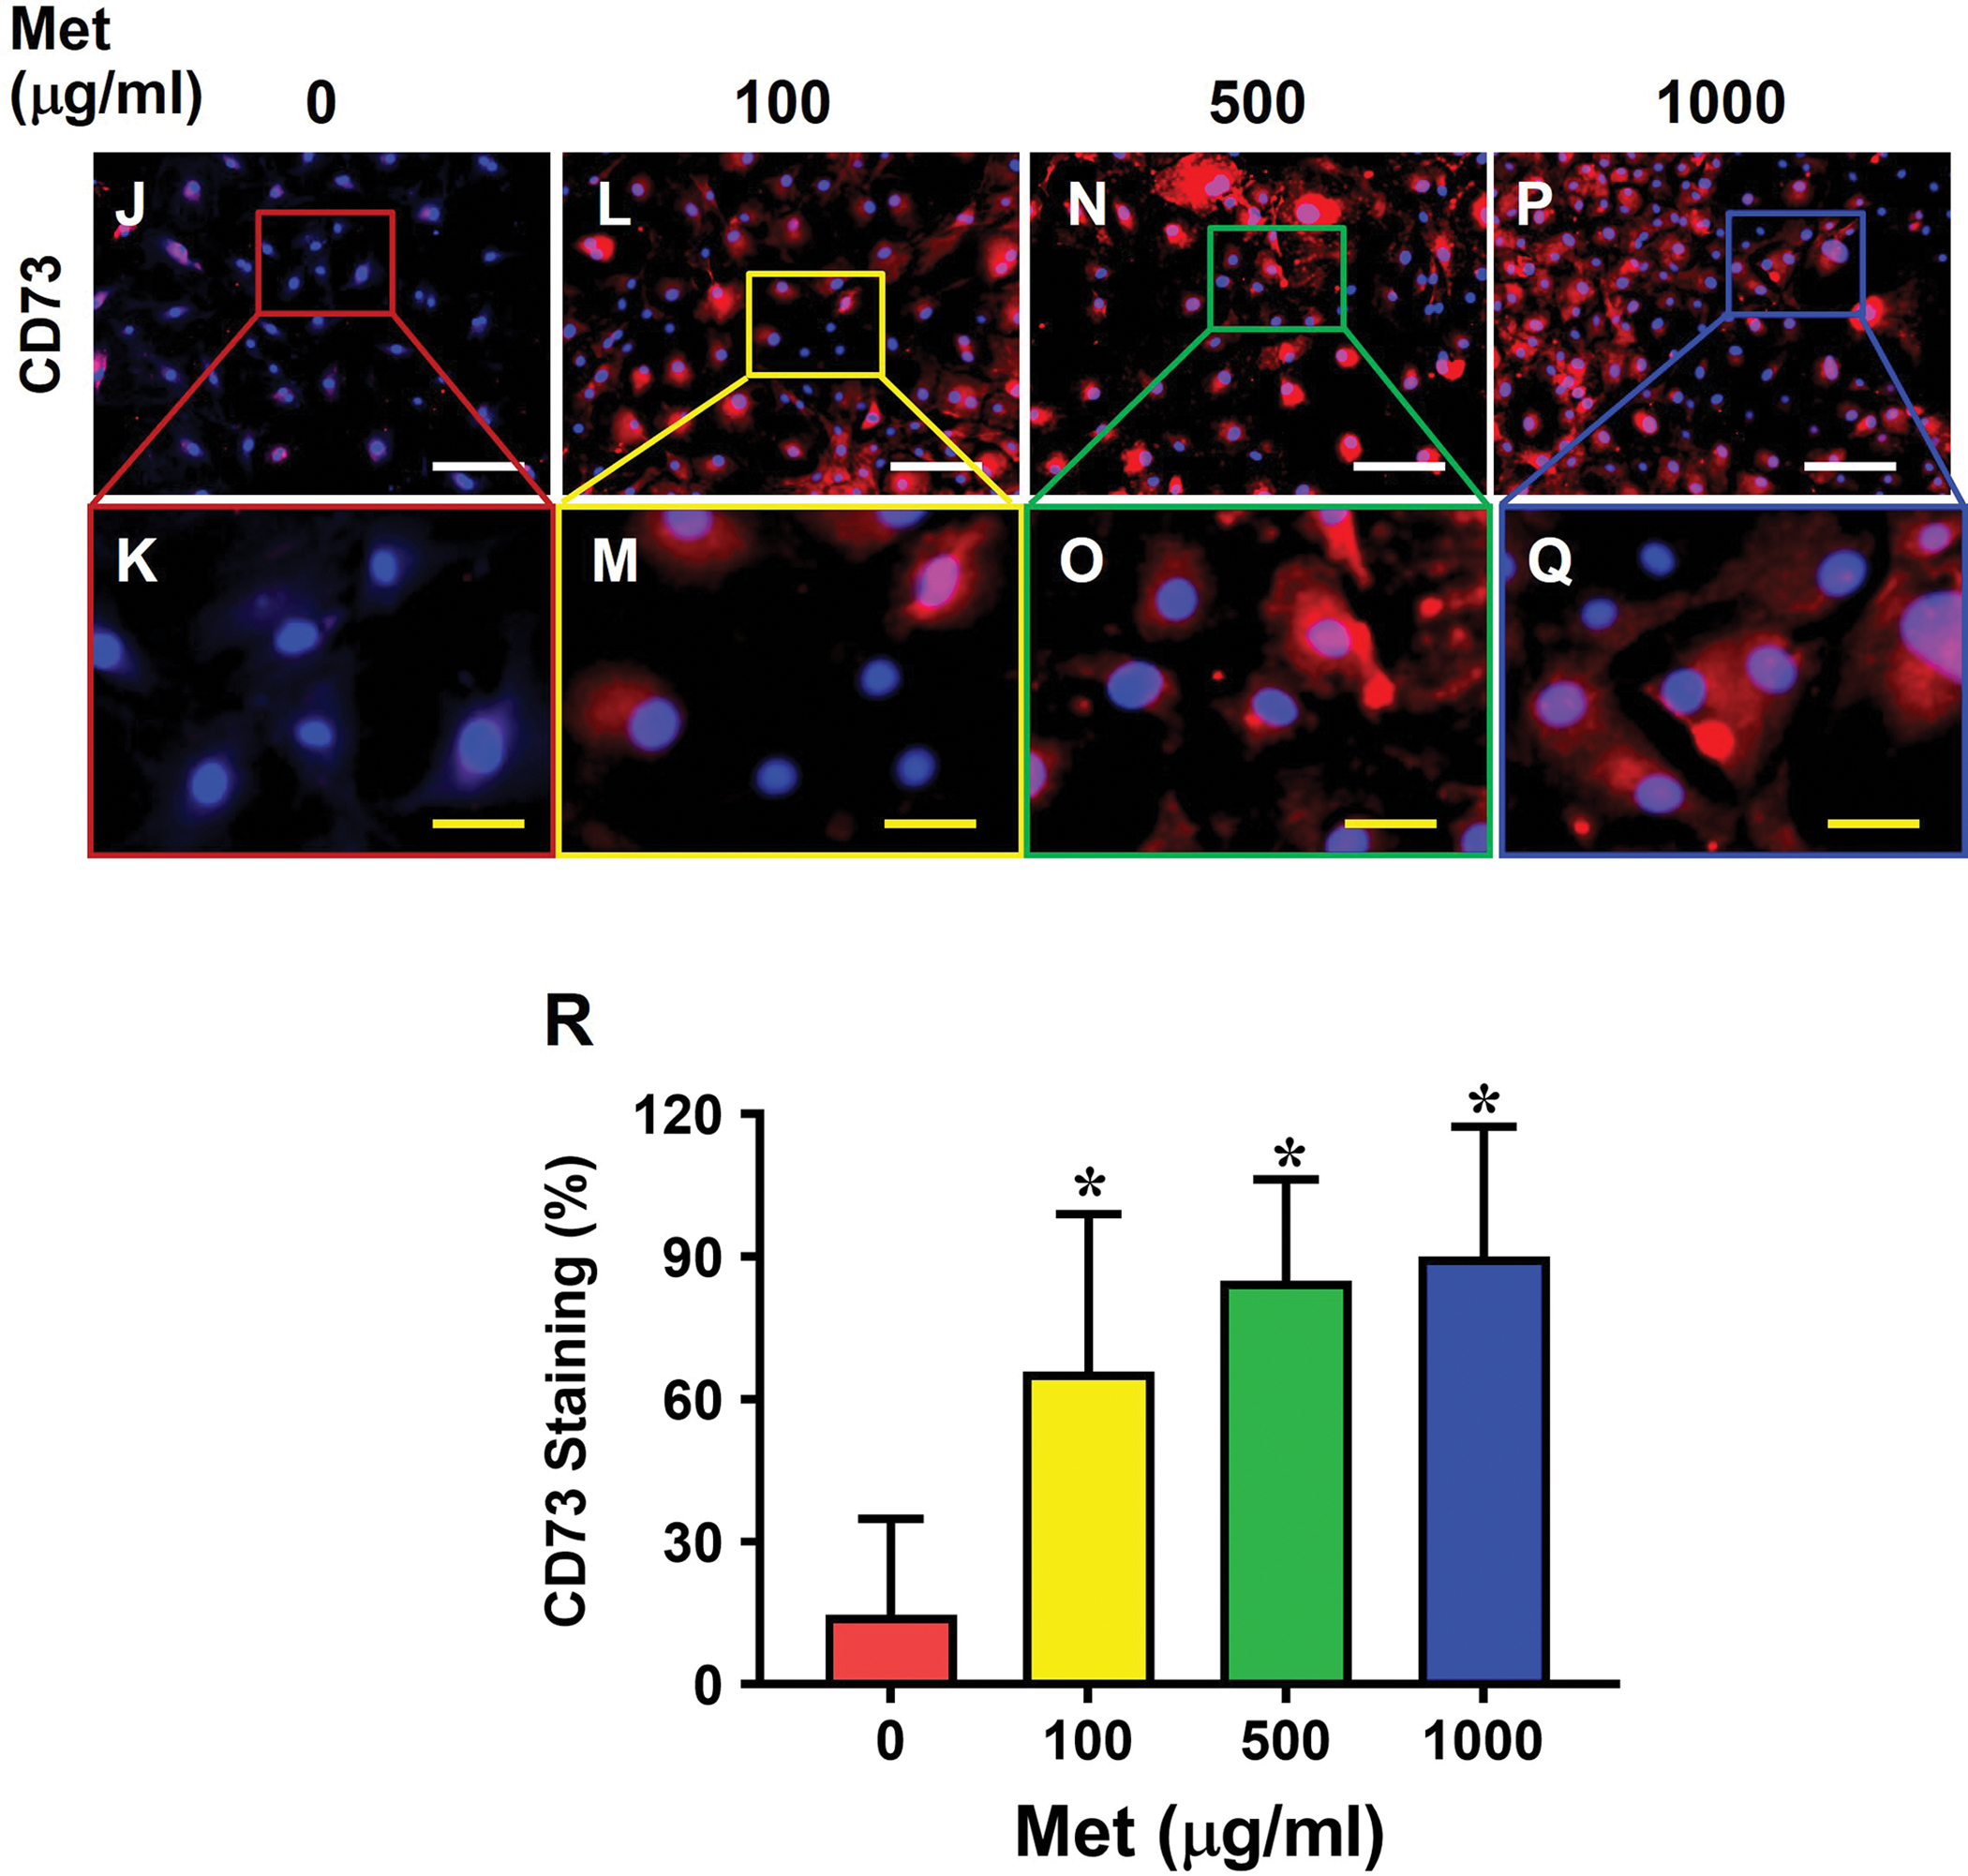
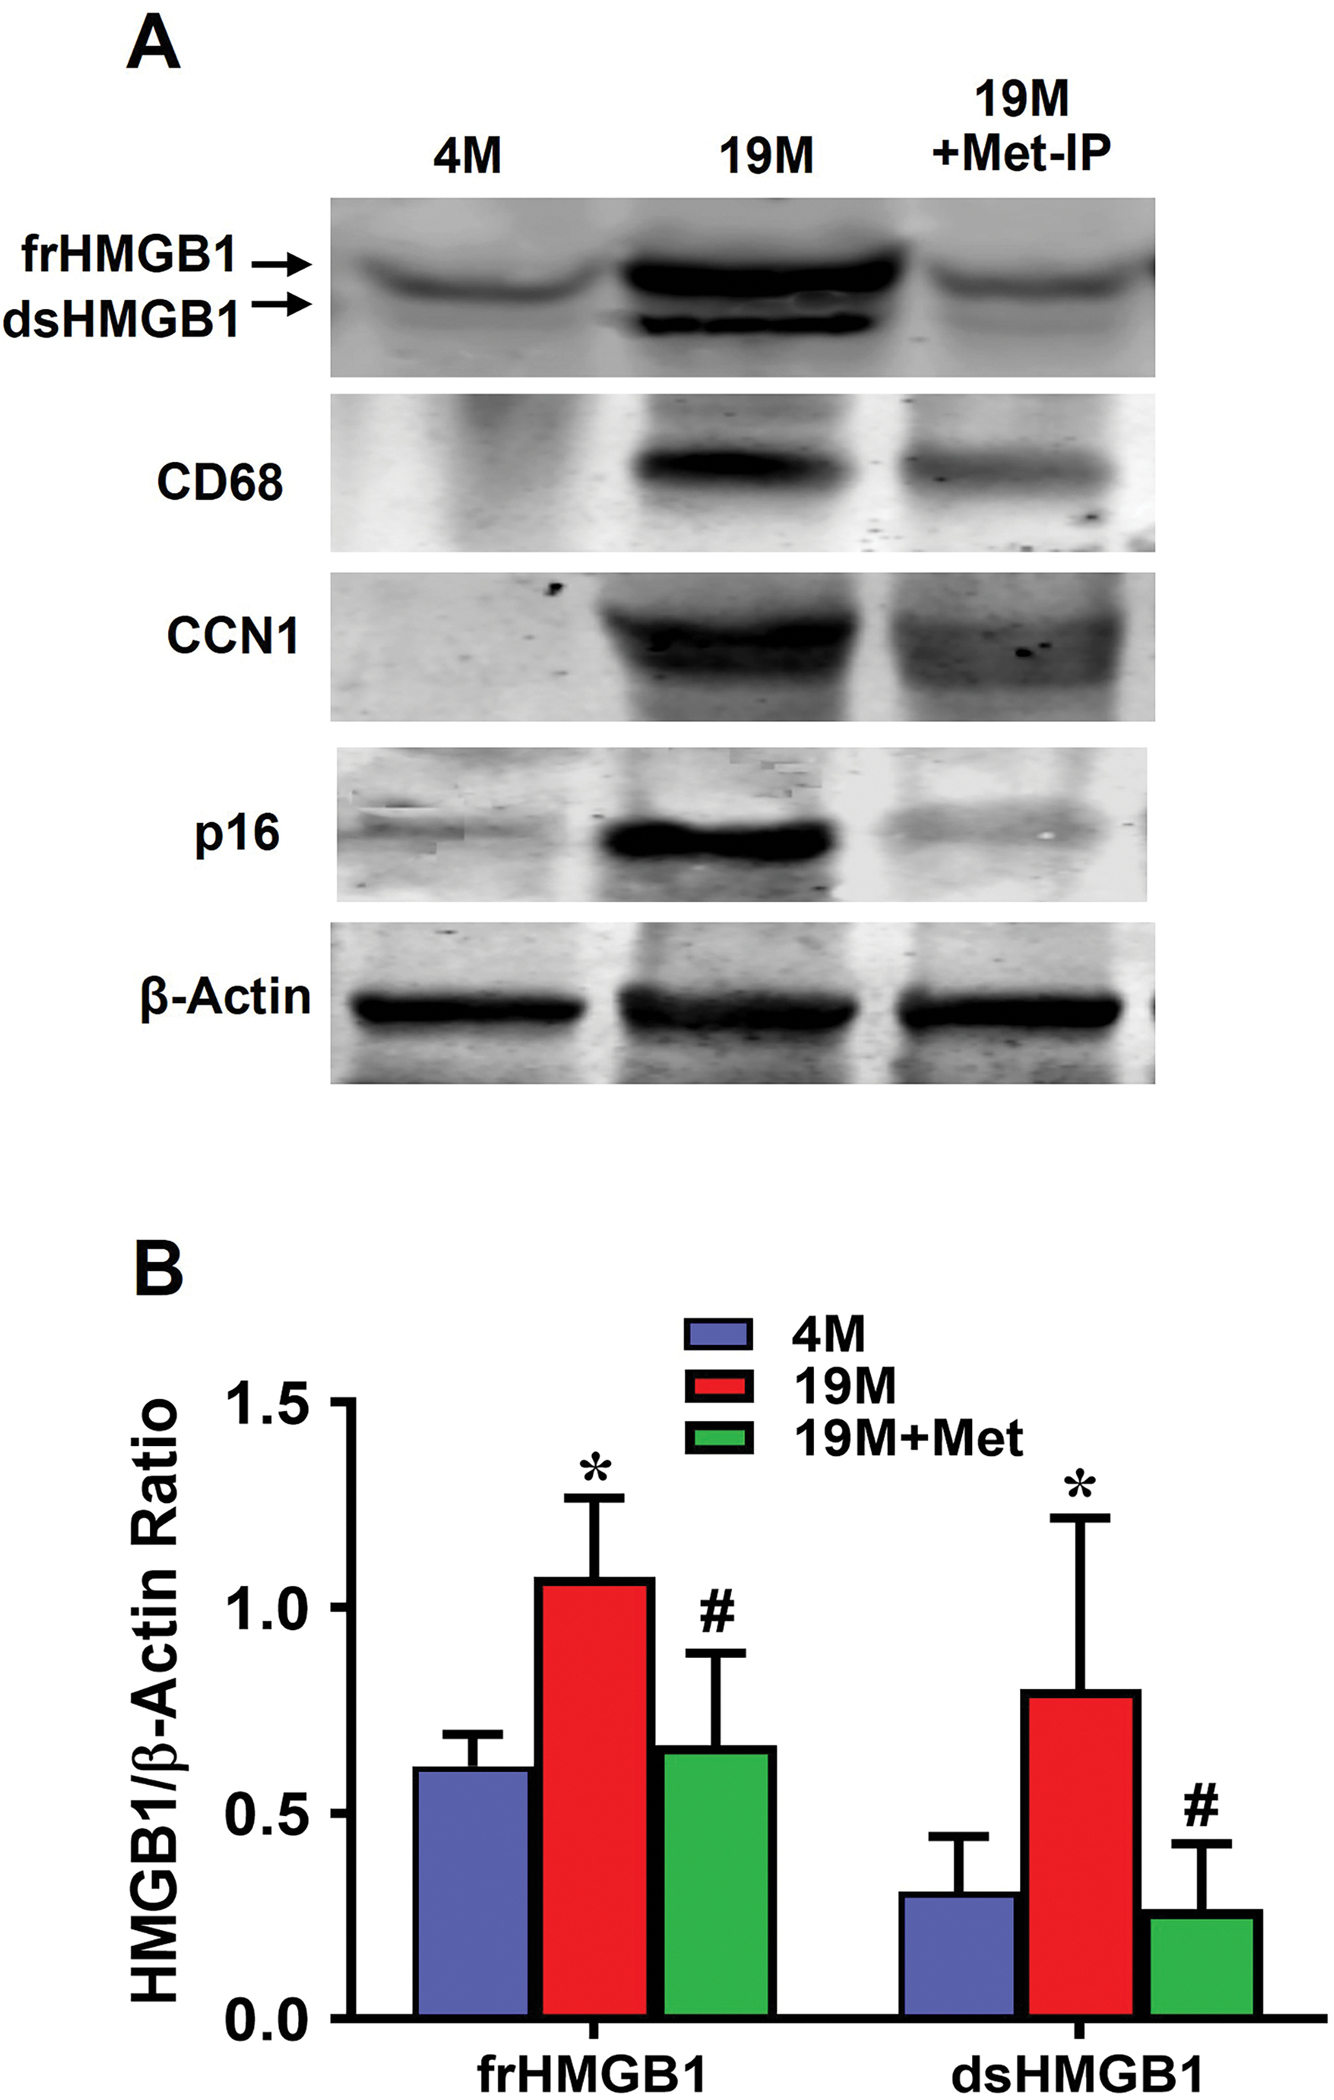
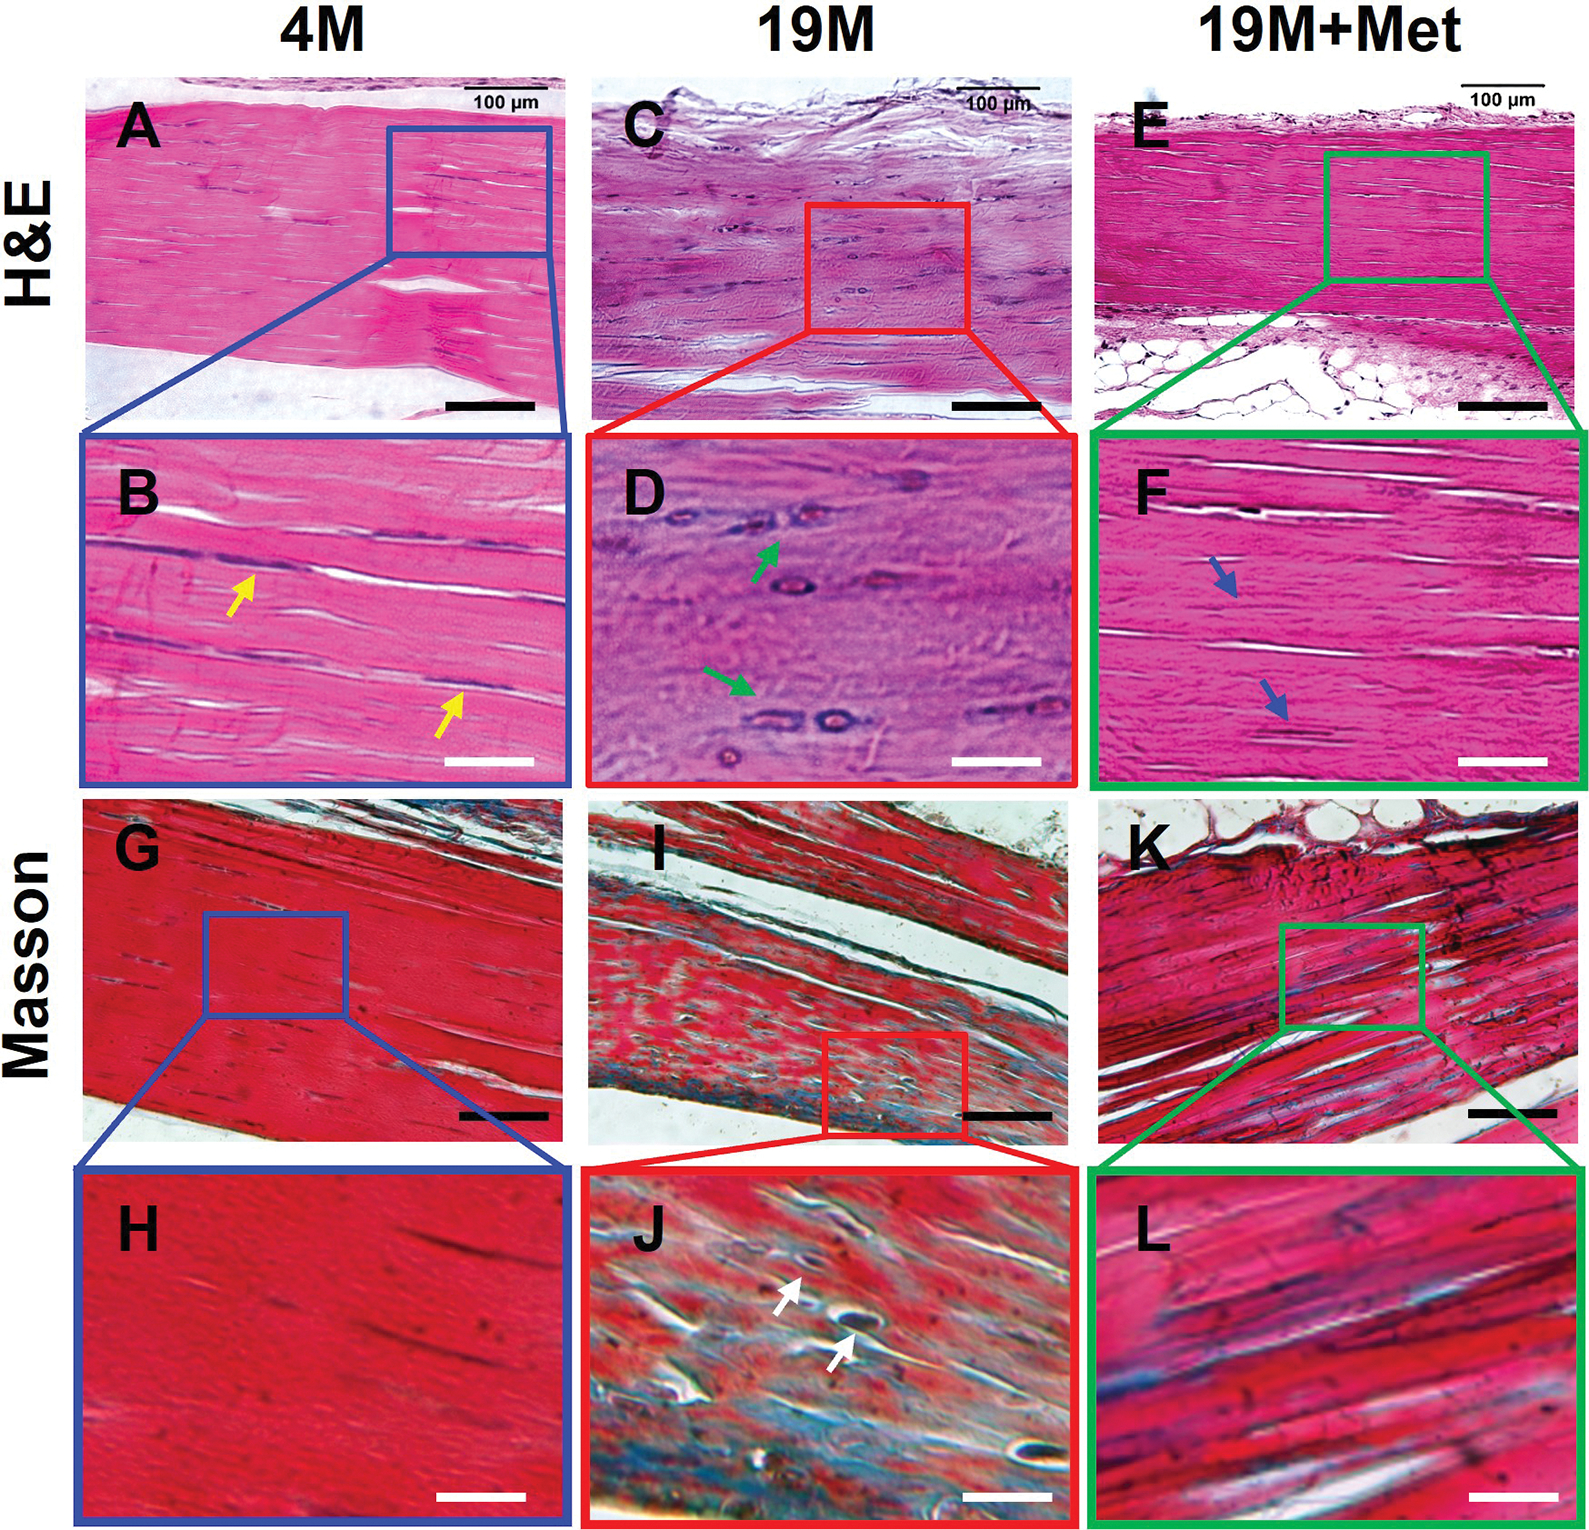
This study aimed to characterize aging-induced tendinopathy in mouse Achilles tendon and also to assess the treatment effects of metformin (Met) on aging tendon. We showed that compared to young tendon, aging tendon was in an inflammatory and senescent state as shown by increased expression of inflammatory disulfide HMGB1 (dsHMGB1), inflammatory macrophage marker CD68, and senescent cell markers SA-β-gal, p53, and p16. Moreover, aging tendon was degenerated marked by accumulation of proteoglycans and lipids in its interior. However, treatment of aging tendon by intraperitoneal (IP) injection of Met, a specific inhibitor of HMGB1, reduced dsHMGB1 levels, decreased the expression of CD68, SA-β-gal, CCN1, and p16 in vitro and in vivo. Furthermore, Met treatment also increased the number of NS, SSEA-1, and CD73 positive stem cells in culture and improved the tendon structure in aging mouse. These findings of this study indicate that Met exerts anti-inflammatory and anti-senescent effects on aging tendon.

Keywords: HMGB1; aging; degeneration; inflammation; metformin; senescence; tendon.


Figures

Fig. 1
Fig. 1. Aging tendon exhibits degenerative changes.
Histochemical staining for proteoglycans (PG) by Alcian blue shows minimal staining for PG in young tendon, and the cells exhibit an elongated morphology (A, B, black arrows). In contrast, aging tendon shows robust presence of PG along with round shaped cells (C, D, red arrows). Semi-quantification shows a significantly higher number of round cells in aging tendon compared to young tendon, with more than 28% round cells in aging tendon vs 2% cells in young tendon I. Similarly, young tendon does not show the presence of lipids by Oil Red O staining (F), while aging tendon has extensive lipid staining (G, red area). Aging tendon has significantly greater lipid staining compared to young tendon, with 53% staining in aging vs 9% in young tendon as shown by semi-quantification (H). Picro Sirius Red staining shows that young tendon under light microscope is formed by strong collagen fibers (red in I), while aging tendon under light microscope is formed by loose collagen fibers (yellow in K). Polarized light microscopy results indicate that the thick collagen fibers in young tendon are formed by collagen type I (red/yellow in J), while the loose collagen fibers in aging tendon are formed by collagen type III (green in L). Semi-quantification shows 62% of collagen fibers in aging tendon are collagen III, but 5.7% of collagen fibers in young tendon are collagen III (M). Gene analysis by qRT-PCR shows significantly decreased expression of collagen I (Col I) for tendon-related gene marker, and increased expression of non-tenocyte-related genes, PPARγ for adipocytes, SOX-9 and collagen II (Col II) for chondrocytes, Runx-2 for osteocytes, and collagen III (Col III) for scar tissue in aging tendon compared to those in young tendon (N, O). Purple bars: 50 μm; Black bars: 12.5 μm; Blue bars: 100 μm. *p < 0.05 (aging compared to young).
Fig. 2
Fig. 2. Senescent cells are present in aging tendon.
Histochemical (top panel) and immunostaining (bottom panel) show that few cells are positively stained with SA-β-gal in young tendon (A, B, F, G), but abundant staining is evident in aging tendon (green in C, D and red in H, I), which are confirmed by semi-quantification (E, J). Immunostaining for CD68 on young tendon tissue section shows minimal staining (K, L), but aging tendon tissue section exhibits abundant positive staining (M, N, brown), which are confirmed by semi-quantification showing 56.5% positive staining in aging vs 7.5% in young tendon (O). Western blot results show that the expression of senescent cell markers p53 and p16 are greatly increased in aging tendon compared to young tendon, which shows nearly no expression of p16 (P). Black bars: 100 μm; White bars: 50 μm; Red bars: 25 μm; Yellow bars: 12.5 μm; *p < 0.01 (aging compared to young).
Fig. 3
Fig. 3. HMGB1 is translocated from the nucleus to cytoplasm and extracellular matrix in aging tendon.
Immunofluorescence analysis on mouse tendon tissue sections shows that HMGB1 is present within the cell nuclei in young tendon (A, B). In contrast, HMGB1 in aging tendon is translocated to cytoplasm (C, D). Semi-quantification results of tendon tissue sections indicate that 91% of the cells in young tendon have HMGB1 within the nuclei, but only 15% of the cells in aging tendon have HMGB1 in the cell nuclei (E). Similarly, isolated cells cultured from young tendon harbor HMGB1 within the cell nuclei (F, G), whereas the aging cells show HMGB1 staining in the cytoplasm (H, I). Semi-quantification confirms the results showing that 93% of the cells in young tendon cells have HMGB1 in the nuclei with 33% in aging tendon cell nuclei (J). White bars: 100 μm; Yellow bars: 25 μm, *p < 0.01 (aging compared to young).
Fig. 4
Fig. 4. Cell morphology, proliferation, and stem cell marker expression in young vs aging tendon.
Young tendon cells are cobble-stone-like in shape (A, B), but the cells isolated from aging tendon are pancake-like in shape (C, D). PDT results show that the cells isolated from young tendon grow much faster than the cells isolated from aging tendon (E). Immunostaining for NS shows that more than 90% of the cells isolated from young mouse tendon tissues are positively stained with NS (F, G), but less than 27% of the cells isolated from aging tendon tissues are positively stained with NS (red in H, I). Similarly, more than 69% of the cells isolated from young tendon tissues are positively stained with SSEA-1 (green in K, L), but less than 24% of the aging tendon cells express SSEA-1 (green in M, N). These results are further confirmed by semi-quantification (J, O). Yellow bars: 100 μm; Red bars: 25 μm, *p < 0.01 (aging compared to young).
Fig. 5
Fig. 5. Met treatment decreases the number of SA-β-gal positive cells from aging tendon.
SA-β-gal staining is evident in control cells without Met treatment (A-B), but it decreases markedly in a Met concentration-dependent manner (C-H). Semi-quantification confirms the results (I). Red bars: 100 μm; Blue bars: 25 μm, *p < 0.01 (treatment groups compared to without Met).
Fig. 6
Fig. 6. Met treatment inhibits HMGB1 translocation from the nuclei of the cells from aging tendon to the cytoplasm.
Most of HMGB1 in aging tendon cells without Met treatment (0) are in cytoplasm (A, B), but Met treatment inhibits HMGB1 translocation in a concentration-dependent manner, with the difference between 100 and 500 μg/ml Met not being significantly different(C-H). Semi-quantification confirms the results (I). Western blot result further shows that both frHMGB1 and dsHMGB1 exist in aging tendon cells, but Met treatment decreases dsHMGB1 levels and increases frHMGB1 levels in aging tendon cells in an apparent concentration-dependent manner (J). White bars: 100 μm; Yellow bars: 25 μm, *p < 0.01 (treatment groups compared to without Met).
Fig. 7
Fig. 7. Met treatment increases stem cell numbers in aging tendon.
Cells from aging tendon without Met treatment show few NS positive cells (A, B), or CD73 positive cells (J, K), but the number of NS positively stained cells (C-H, I) increases in a Met concentration-dependent manner. However, the number of CD73 positively stained cells has no significant difference between 500 and 1000 μg/ml Met concentrations (N-Q, R). Semi-quantification confirms the results (I, R). White bars: 100 μm; Yellow bars: 20 μm, *p < 0.01 (treatment groups compared to without Met).
Fig. 8
Fig. 8. IP injection of Met decreases HMGB1 levels and reduce inflammation and cellular senescence in aging tendon.
Western blot results show that both fr- and ds-HMGB1 are expressed in the extracellular matrix of aging mouse tendon, but Met treatment nearly eliminates dsHMGB1, reduces frHMGB1 to the level close to that of young tendon, decreases the expression of inflammatory macrophage marker CD68, and senescent markers CCN1 and p16 expression in aging tendon (A). Semi-quantification of the Western blot shows the increased levels of both frHMGB1 and dsHMGB1in aging tendon, but Met treatment decreases both frHMGB1 and dsHMGB1, with dsHMGB1 nearly absent (B). *p < 0.01 (19M compared to 4M); #p < 0.01 (19M+Met compared to 19M).
Fig. 9
Fig. 9. IP injection of Met decreases degenerative changes in aging tendon.
H&E staining on young mouse (4M) tendon tissue section shows that the cells are elongated in shape (B, yellow arrows), whereas cells in aging tendon (19M), are round shaped (D, green arrows). However, Met injection decreases the number of round shape cells in aging tendons (F, blue arrows). Masson trichrome staining on young tendon tissue sections shows that it is formed by dense collagen fibers all stained red (G, H), but the aging tendon has some blue staining interspersed across the tendon section, indicating loose collagen fibers with tendon cells (J, white arrows). However, IP injection of Met for 8 weeks decreases the presence of loose collagen fibers in aging tendon (K, L). Black bars: 100 μm; White bars: 25 μm.

Similar articles

Cited by

References

    1. Colby SL, Ortman JM. 2015. Projections of the Size and Composition of the U.S. Population: 2014 to 2060. In: Commerce editor; pp. 1–13.
    1. Dean BJF, Dakin SG, Millar NL, et al. 2017. Review: Emerging concepts in the pathogenesis of tendinopathy. Surgeon 15:349–354. - PMC - PubMed
    1. Zhou B, Zhou Y, Tang K. 2014. An overview of structure, mechanical properties, and treatment for age-related tendinopathy. J Nutr Health Aging 18:441–448. - PubMed
    1. Albers IS, Zwerver J, Diercks RL, et al. 2016. Incidence and prevalence of lower extremity tendinopathy in a Dutch general practice population: a cross sectional study. BMC Musculoskelet Disord 17:16. - PMC - PubMed
    1. Lui PPY, Wong CM. 2019. Biology of Tendon Stem Cells and Tendon in Aging. Front Genet 10:1338. - PMC - PubMed

Publication types