. 2022 Oct 3:13:1015585.
doi: 10.3389/fimmu.2022.1015585. eCollection 2022.

Engineered red blood cells (activating antigen carriers) drive potent T cell responses and tumor regression in mice

Affiliations

Engineered red blood cells (activating antigen carriers) drive potent T cell responses and tumor regression in mice

Katarina Blagovic et al. Front Immunol. .

Abstract

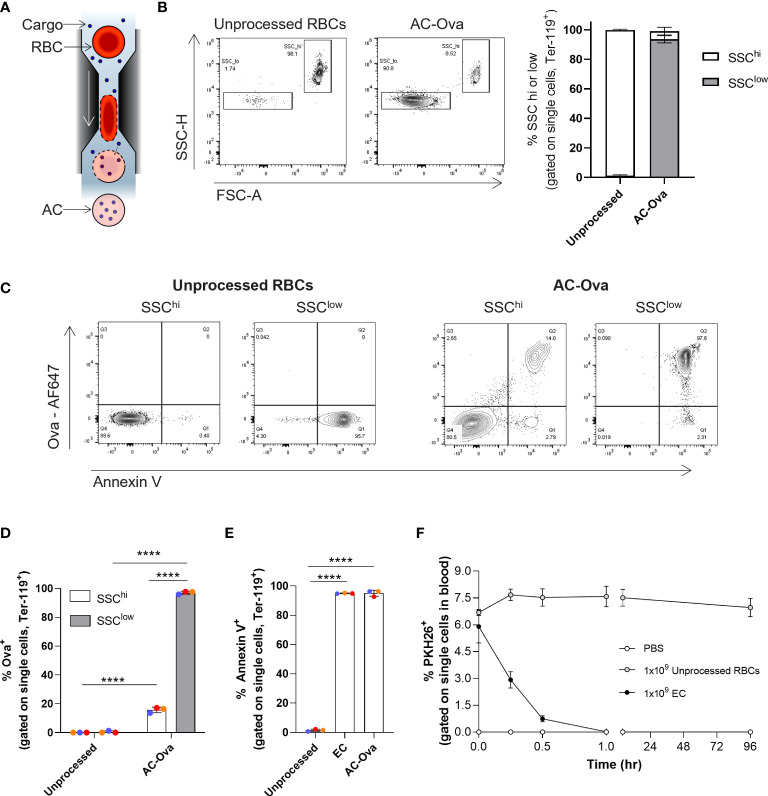
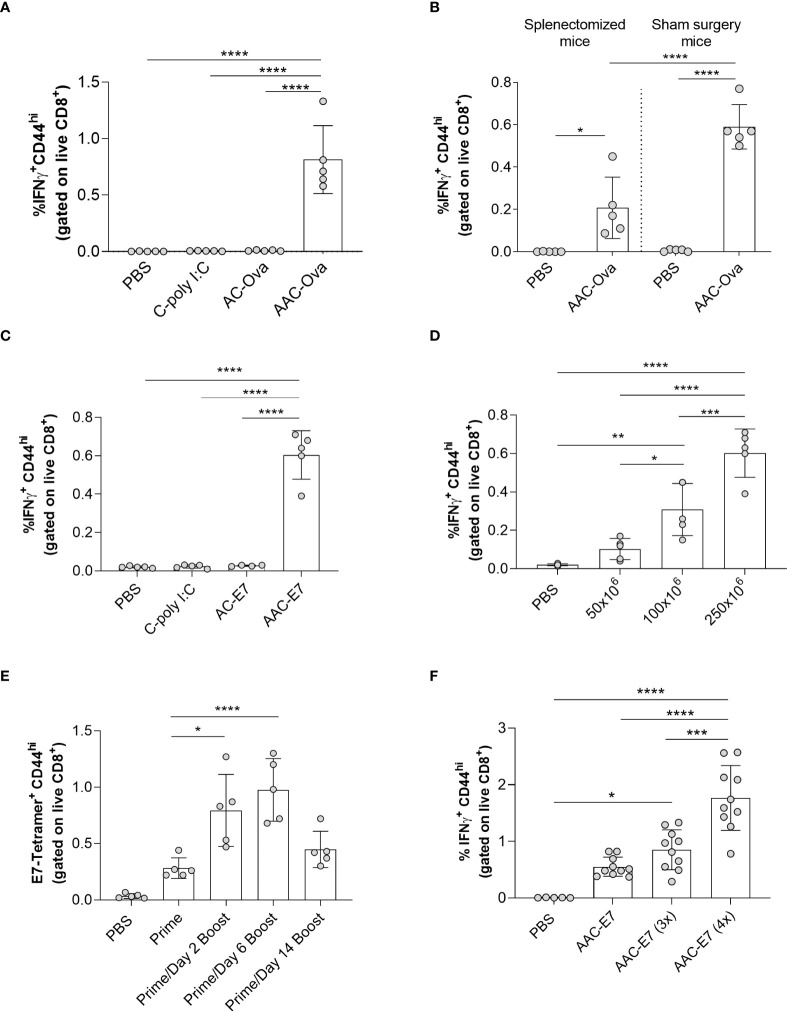
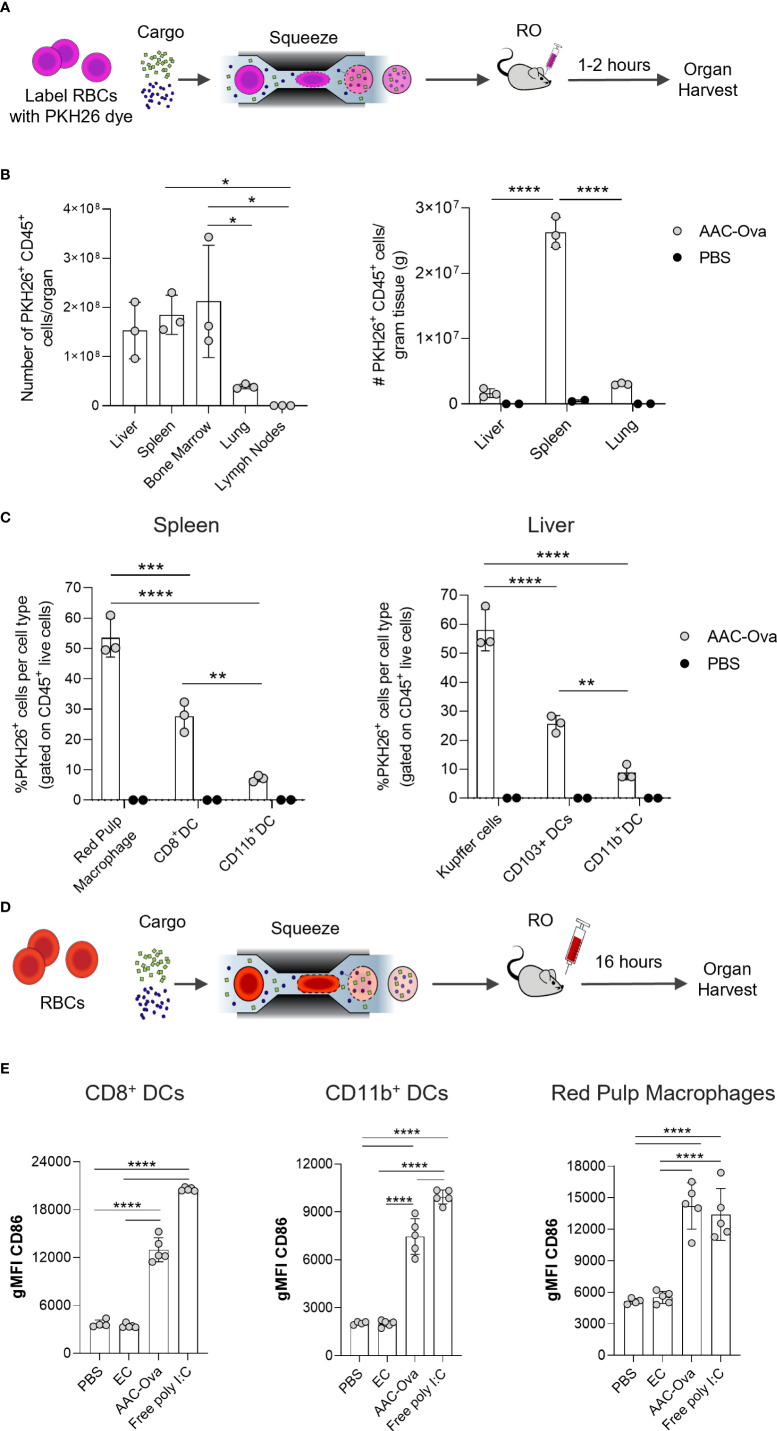
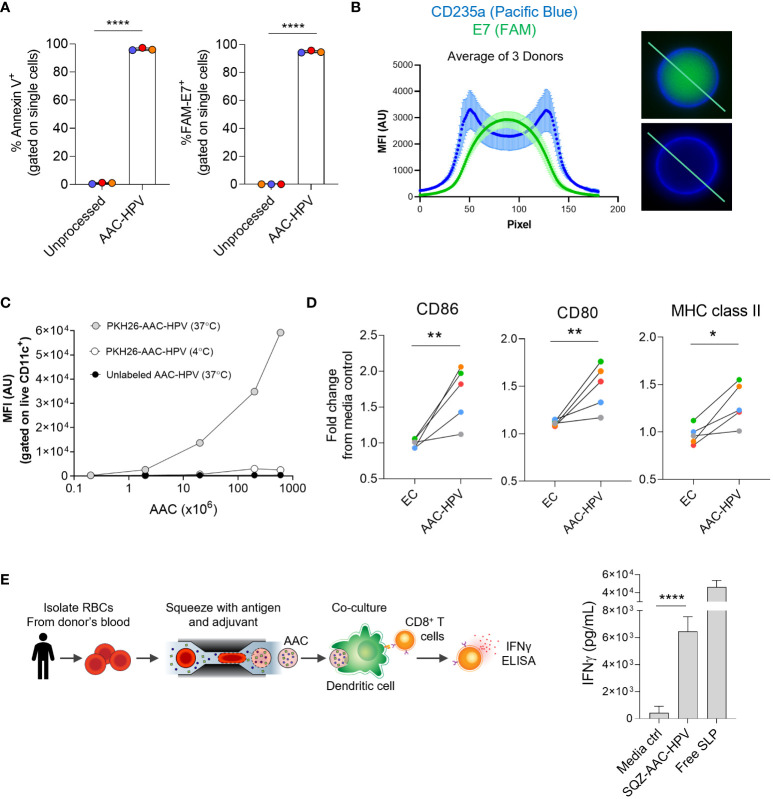
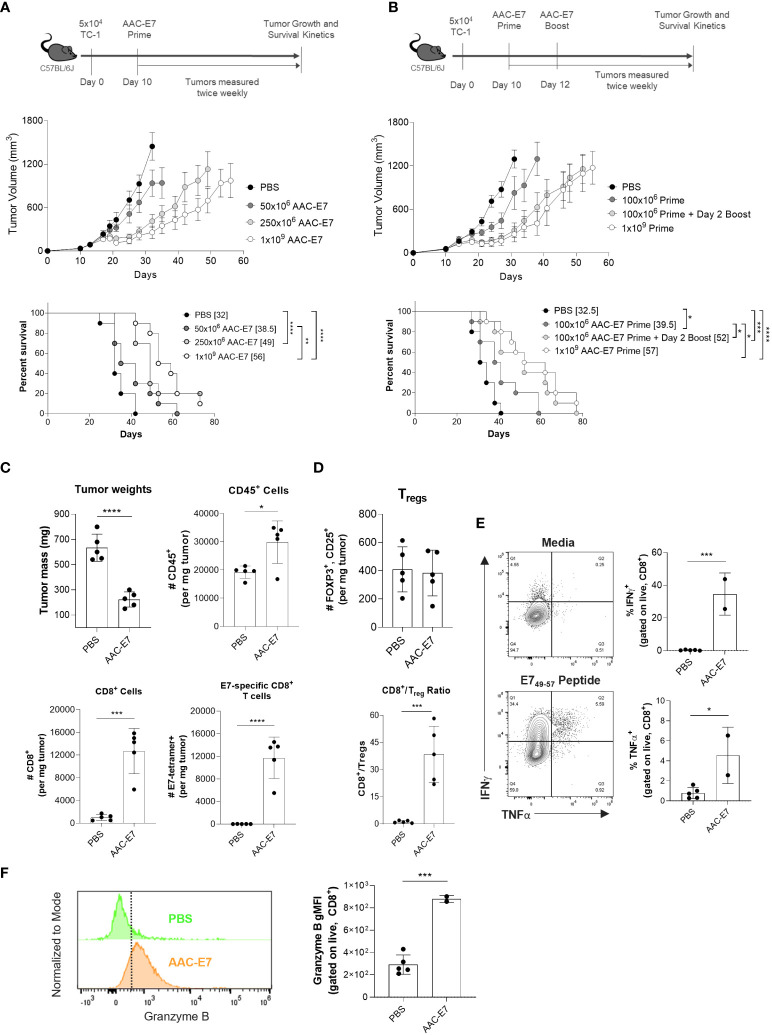
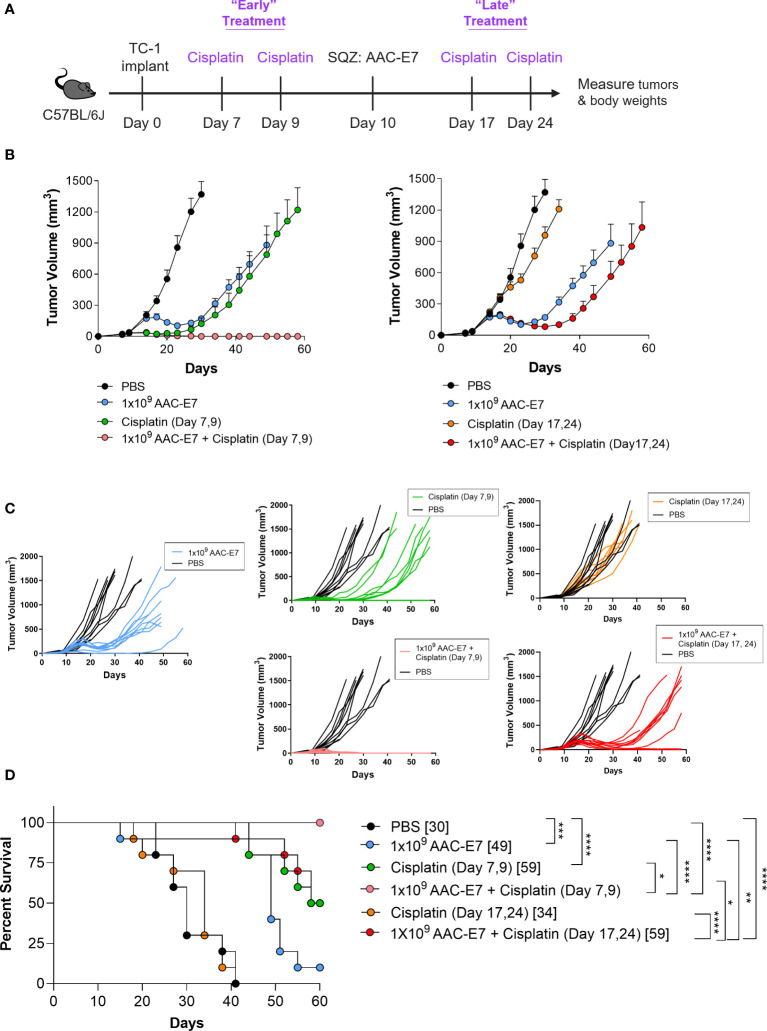
Activation of T cell responses is essential for effective tumor clearance; however, inducing targeted, potent antigen presentation to stimulate T cell responses remains challenging. We generated Activating Antigen Carriers (AACs) by engineering red blood cells (RBCs) to encapsulate relevant tumor antigens and the adjuvant polyinosinic-polycytidylic acid (poly I:C), for use as a tumor-specific cancer vaccine. The processing method and conditions used to create the AACs promote phosphatidylserine exposure on RBCs and thus harness the natural process of aged RBC clearance to enable targeting of the AACs to endogenous professional antigen presenting cells (APCs) without the use of chemicals or viral vectors. AAC uptake, antigen processing, and presentation by APCs drive antigen-specific activation of T cells, both in mouse in vivo and human in vitro systems, promoting polyfunctionality of CD8+ T cells and, in a tumor model, driving high levels of antigen-specific CD8+ T cell infiltration and tumor killing. The efficacy of AAC therapy was further enhanced by combination with the chemotherapeutic agent Cisplatin. In summary, these findings support AACs as a potential vector-free immunotherapy strategy to enable potent antigen presentation and T cell stimulation by endogenous APCs with broad therapeutic potential.

Keywords: CD8 T cells; activating antigen carriers; adjuvant; antigen presenting cell; cancer immunotherapy; dendritic cells; human papillomavirus; red blood cells.


Conflict of interest statement

All listed authors are current or former SQZ Biotechnologies Company employees.

Figures

Figure 1
Figure 1
Cell Squeeze® platform generates Antigen Carriers (AC) which exhibit rapid in vivo uptake. (A) Schematic of Cell Squeeze® microfluidic platform for intracellular delivery of cargo to RBCs. (B) Unprocessed mouse RBCs and Ova-AF647 squeezed carriers (AC-Ova) with distinct SSClow and SSChi populations (from single cell gate). Left: flow plots (SSC-H vs. FSC-A). Right: Percent SSClow and SSChi populations. (C) Annexin V levels and Ova-AF647 delivery in unprocessed RBCs and AC-Ova. (D) Percent Ova-AF647 delivery to events in SSClow and SSChi populations. (E) Percent annexin V positive events in unprocessed RBC or carrier groups. (F) In vivo clearance kinetics of untouched RBCs and EC from n = 2 mice in PBS group and n = 3 mice in each unprocessed RBC and EC group. n = 2 independent studies. ****P < 0.0001, one-way ANOVA.
Figure 2
Figure 2
Characterization of AAC-induced CD8+ T cell responses in vivo. (A) Flow analysis of IFNγ+ CD44hi of CD8+ T cells (referred to as IFNγ+ CD8+ T cells) from the spleen of mice administered with control vehicle (PBS), C-poly I:C (adjuvant only), AC-Ova (antigen only), or AAC-Ova (antigen and adjuvant). (B) CD8+ T cell IFNγ responses in the blood following AAC-Ova administration in mice that have undergone splenectomy or sham surgery. (C) Flow analysis of IFNγ+ CD8+ T cells from the spleen of mice administered with control vehicle (PBS), C-poly I:C (adjuvant only), AC-E7 (antigen only), or AAC-E7 (antigen and adjuvant). (D) Flow analysis of IFNγ+ CD8+ T cells from the spleen of mice administered with different doses of AAC-E7. (E) Frequency of E7-tetramer+ CD8+ T cells from the blood for different immunization schedules (250x106 AAC-E7 per animal). (F) Flow analysis of IFNγ+ CD8+ T cells from spleen following dose response to 1, 3 or 4 AAC-E7 immunizations (250x106 AAC-E7 per animal). Figures show one dot per mouse for all studies. *P < 0.05, **P = 0.001, ***P < 0.005, ****P < 0.0001, one-way ANOVA.
Figure 3
Figure 3
Mouse AACs are rapidly internalized by APCs, inducing maturation in vivo. Murine RBCs were squeezed in the presence of Ovalbumin (Ova) and poly I:C to generate AAC-Ova and injected RO at 1x10⁹ per animal. AAC uptake studies (A–C) used PKH26-labeled RBCs and organ analysis was performed 1–2 hours after PKH26-labeled AAC-Ova injection. (B) The number of PKH26+ CD45+ cells was determined for each organ. Liver, spleen, and lung were weighed to determine PKH26+ CD45+ cells per gram tissue for animals injected with AAC-Ova (n = 3 mice) or PBS (n = 2 mice). (C) The cell type for PKH26-AAC-Ova uptake was determined in the spleen and liver. For APC maturation studies (D, E), unlabeled RBCs were used for squeeze and organs analyzed the day following AAC-Ova administration. (E) Upregulation of CD86 maturation marker on recipient mouse splenic APCs following uptake of AAC-Ova. Figures show one dot per mouse for all studies. n = 2 independent uptake studies, and n = 3 independent maturation studies. *P < 0.05, **P < 0.005, ***P ≤ 0.0005, ****P < 0.0001, one-way ANOVA.
Figure 4
Figure 4
Human AACs show antigen encapsulation and, after uptake, induce MoDC maturation to activate antigen-specific CD8+ T cells in vitro. (A) Annexin V staining and FAM-labeled E7 SLP delivery to human RBCs following squeeze. (B) Left: graph displaying mean of 3 donors (see methods section), anti-human CD235a (blue) and FAM-E7 (green) fluorescence intensity along line-scan drawn across the length of the AAC-HPV. Right: line-scan is shown in representative microscopy images of a single human AAC-HPV squeezed with (top) FAM-E7 or (bottom) unlabeled E7 stained with erythrocyte marker anti-human CD235a. (C) Uptake of PKH26-AAC-HPV by HLA-A*02+ CD11c+ MoDCs at 37°C or 4°C. For display purposes, conditions with unlabeled AAC-HPV were plotted on the x-axis at 0.2, since zero cannot be plotted on a log scale (n = 3 independent experiments with 3 distinct RBC donors). (D) Expression of maturation markers CD86, CD80 and MHC class II on MoDCs following 2-day culture with AAC-HPV. Data is shown as fold change in gMFI in comparison to media control (n = 5 MoDC donors). Each colored dot represents a different donor. (E) Manufacturing scale SQZ-AAC-HPV and HLA-A*02+ MoDCs were cultured overnight with E711-20 -specific CD8+ T cells. Supernatants analyzed for IFNγ release by ELISA (n = 6 different RBC donors). *P < 0.05, **P < 0.01, ****P < 0.0001, unpaired t-test.
Figure 5
Figure 5
AAC therapeutic treatment primes anti-tumor activity and enhances infiltration of antigen-specific CD8+ T cells in vivo. (A) Scheme and results of AAC-E7 single dose response in TC-1 bearing C57BL/6J mice: (top) tumor growth and (bottom) median survival (number in brackets), n = 10 mice per group. (B) Scheme and results of AAC-E7 prime/boost on (top) tumor growth and (bottom) survival, n = 10 mice per group. (C) Tumor weight in AAC-E7 and PBS-treated groups collected day 23 post TC-1 cell implant. Analysis of tumor infiltrating lymphocytes: total number of CD45+, CD8+ and tetramer+ E7-specific CD8+ T cells per mg tumor, n = 5 mice per group. (D) Top: total number Tregs (FOXP3+, CD25+) per mg tumor. Bottom: ratio of CD8+ cells to Tregs in tumors. (E) Polyfunctionality (IFNg+, TNFα+)of tumor infiltrating CD8+ T cells upon restimulation (n = 2 for AAC-E7 or n = 5 mice per PBS group). (F) Granzyme B+ levels in tumor infiltrating CD8+ T cells. *P < 0.05, **P < 0.01, ***P < 0.001, ****P < 0.0001, Mantel-Cox test for median survival, other figures analyzed by unpaired t-test.
Figure 6
Figure 6
Synergistic therapeutic effect of AACs and chemotherapy combination. (A) Schematic of Cisplatin and AAC-E7 dosing. Early (two doses: day 7, 9 post TC-1 implant) and late (two doses: day 17, 24 post TC-1 implant) Cisplatin dosing was administered as monotherapy or in combination with AAC-E7. (B) Tumor growth curves for PBS, AAC-E7 and Cisplatin monotherapy, or combination therapy. The figures show the same PBS and AAC-E7 monotherapy treatment groups overlayed with early (left) and late (right) Cisplatin dosing. (C) Spider plots of individual mice per each treatment group. (D) Median survival (n = 10 mice per group). *P < 0.05, **P < 0.01, ***P < 0.001, ****P < 0.0001, Mantel-Cox test for median survival.

References

    1. Tumeh PC, Harview CL, Yearley JH, Shintaku IP, Taylor EJM, Robert L, et al. . PD-1 blockade induces responses by inhibiting adaptive immune resistance. Nature (2014) 515:568–71. doi: 10.1038/nature13954 - DOI - PMC - PubMed
    1. Burg van der SH, Arens R, Ossendorp F, Hall van T, Melief CJM. Vaccines for established cancer: overcoming the challenges posed by immune evasion. Nat Rev Cancer (2016) 16:219–33. doi: 10.1038/nrc.2016.16 - DOI - PubMed
    1. Cha E, Klinger M, Hou Y, Cummings C, Ribas A, Faham M, et al. . Improved survival with T cell clonotype stability after anti–CTLA-4 treatment in cancer patients. Sci Transl Med (2014) 6:238ra70–238ra70. doi: 10.1126/scitranslmed.3008211 - DOI - PMC - PubMed
    1. Perez CR, Palma MD. Engineering dendritic cell vaccines to improve cancer immunotherapy. Nat Commun (2019) 10:5408. doi: 10.1038/s41467-019-13368-y - DOI - PMC - PubMed
    1. Mastelic-Gavillet B, Balint K, Boudousquie C, Gannon PO, Kandalaft LE. Personalized dendritic cell vaccines–recent breakthroughs and encouraging clinical results. Front Immunol (2019) 10:766. doi: 10.3389/fimmu.2019.00766 - DOI - PMC - PubMed