. 2022 Sep 1;18(15):5591-5606.
doi: 10.7150/ijbs.78002. eCollection 2022.

Serological responses to human virome define clinical outcomes of Italian patients infected with SARS-CoV-2

Affiliations

Serological responses to human virome define clinical outcomes of Italian patients infected with SARS-CoV-2

Limin Wang et al. Int J Biol Sci. .

Abstract

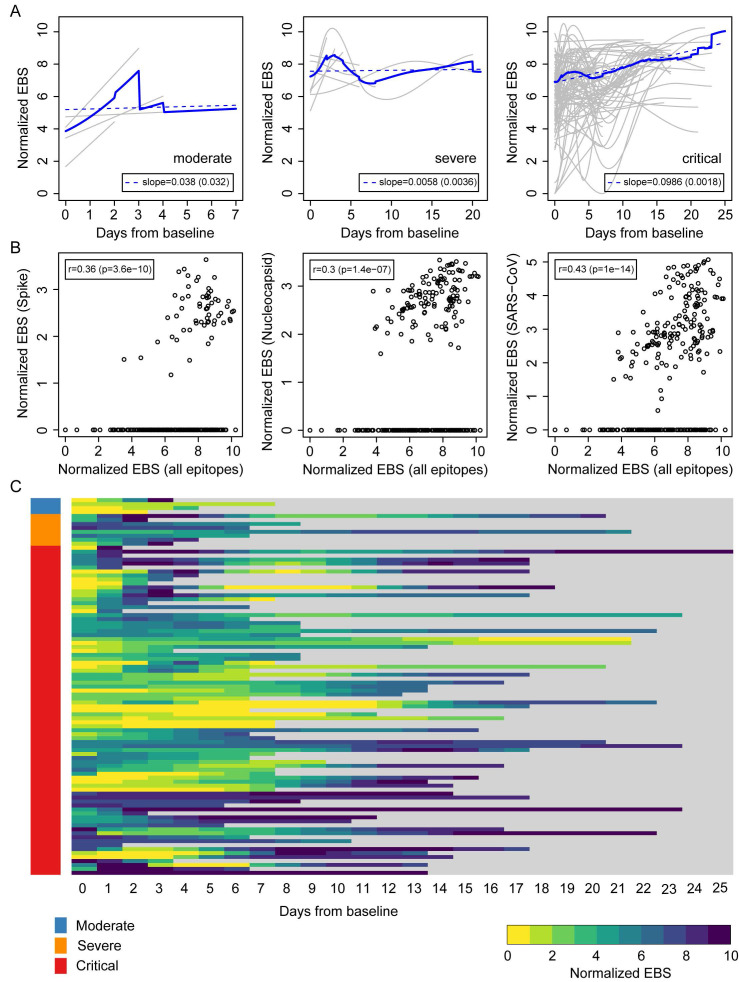
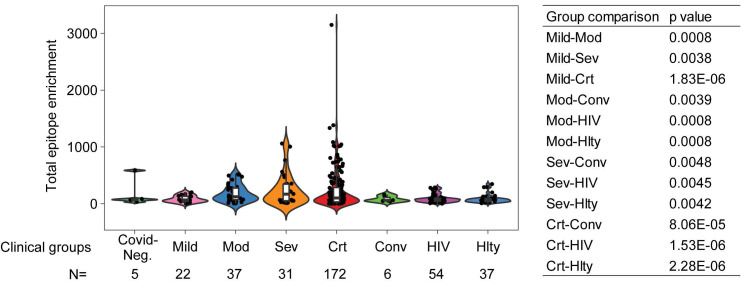
Severe acute respiratory syndrome coronavirus 2 (SARS-CoV-2) is responsible for the pandemic respiratory infectious disease COVID-19. However, clinical manifestations and outcomes differ significantly among COVID-19 patients, ranging from asymptomatic to extremely severe, and it remains unclear what drives these disparities. Here, we studied 159 sequentially enrolled hospitalized patients with COVID-19-associated pneumonia from Brescia, Italy using the VirScan phage-display method to characterize circulating antibodies binding to 96,179 viral peptides encoded by 1,276 strains of human viruses. SARS-CoV-2 infection was associated with a marked increase in immune antibody repertoires against many known pathogenic and non-pathogenic human viruses. This antiviral antibody response was linked to longitudinal trajectories of disease severity and was further confirmed in additional 125 COVID-19 patients from the same geographical region in Northern Italy. By applying a machine-learning-based strategy, a viral exposure signature predictive of COVID-19-related disease severity linked to patient survival was developed and validated. These results provide a basis for understanding the role of memory B-cell repertoire to viral epitopes in COVID-19-related symptoms and suggest that a unique anti-viral antibody repertoire signature may be useful to define COVID-19 clinical severity.


Conflict of interest statement

Competing Interests: The authors have declared that no competing interest exists.

Figures

Figure 1
Figure 1
Overview of viral exposure across Italian COVID-19 cohorts. (A) Discovery and validation workflow of our VirScan study. (B) Total number of unique epitopes in non-COVID-19 and COVID-19 cases in the Brescia discovery cohort. (C) Viral prevalence (left), number of unique epitopes of moderate, severe, and critical groups of patients (3 center panels) and composition of prevalence across patient groups (right) for 156 COVID-19 cases in the Brescia discovery cohort. (D) Antibody reactivity of all epitopes detected in at least two cases. Rows represent epitopes and columns represent COVID-19 cases from the Brescia discovery cohort, where -log10 (p-value) was used to quantify peptide enrichment. (E) Log-transformed total enrichment across all epitopes in the moderate, severe, and critical groups from the Brescia discovery cohort. For each violin plot, the embedded box spans the interquartile range around the median (thick horizontal line), whereas the contour denotes the kernel density estimate of the distribution. Box plots represent 25th to 75th percentiles and whiskers extend to 10th and 90th percentiles. P-values were determined with Student's t-test.
Figure 2
Figure 2
SARS-CoV epitope reactivity in moderate, severe, and critical cases from the Brescia discovery cohort. (A) Total reactivity of all SARS-CoV epitopes in non-COVID and COVID-19 cases. Log transformation was applied. (B) Antibody reactivity of 85 SARS-CoV epitopes. Each row represents the significant peptide tiling corresponding to spike protein (1-1255) and nucleocapsid protein (1-422). The color intensity of each cell corresponds to the scaled -log10(p value) measure of significance of enrichment for a peptide in a sample. (C) Organization of SARS-CoV-2 genome encoding various viral proteins. (D) B-cell epitope prediction score for spike and nucleocapsid based on the Immune Epitope Database and Analysis Resource (IEDB). (E-F) Sequence alignment of reactive peptides corresponding to spike (E) and nucleocapsid protein (F) of SARS-CoV and SARS-CoV-2. Only peptide sequences in the phage library are shown. Residues with perfect match are capitalized. Predicted epitopes by IEDB are highlighted. (G) Normalized EBS of spike (785-840, left) and nucleocapsid (141-196 right) proteins in moderate, severe, and critical patients. (H) Normalized EBS of spike (785-840, left) and nucleocapsid (141-196 right) proteins in patients at different time points. In violin plots, boxes span the interquartile range; lines within boxes represent the median; the width of violin plots indicates the kernel density of values. Box plots represent 25th to 75th percentiles and whiskers extend to 10th and 90th percentiles. P-values were determined with Student's t-test.
Figure 3
Figure 3
Longitudinal progression of the normalized EBS across individuals from the Brescia discovery cohort. (A) Individual trajectories over time for patients grouped by disease severity (gray lines), which were averaged (solid blue line) and fitted by linear regression (dashed blue line; slope and standard error shown in the legend). Baseline refers to the first sample obtained after admission to the hospital. (B) Normalized EBS in SARS-CoV spike, nucleocapsid, and all SARS-CoV reactive proteins compared against the normalized EBS across all VirScan epitopes. (C) Heatmap showing the longitudinal progression of individual patients integrated across all three patient groups by disease severity. P-values were determined with Student's t-test.
Figure 4
Figure 4
Development and validation of a viral exposure signature predictive of disease severity. (A) XGBoost with 10-fold cross validation for 100 iterations of balanced input data generated by ROSE. Each iteration showing the AUC value of training and cross validation sets. (B) The COVID-VES signature consisted of 28 viral strains that were selected in at least 50 of the 100 iterations predicted by XGBoost. (C and E) Survival risk predictions based on the COVID-VES signature in low- and high-risk patient groups in the discovery (C) and validation (E) cohorts, respectively. Survival time was based on days since admission. (D and F) Results from Cox proportional hazards regression analyses in the discovery (D) and validation (F) cohorts, respectively. Patients within each clinical group were classified into low- and high-risk categories based on the COVID-VES, then Cox proportional hazards ratios were determined. ND, not determined. P-values were determined with Logrank and Student's t-test. Error bars represent 95% confidential intervals.
Figure 5
Figure 5
Total epitope enrichment comparison in COVID-19 and HIV-1-infected patients. Log-transformed total enrichment across all epitopes in the combined discovery and validation cohorts of COVID-19 patients from Northern Italy, and a cohort of HIV-1-infected (n=54) and healthy subjects (n=37) from NIH, USA. Significant p-values (<0.05) from the pairwise comparison of all patient groups are shown in the right-hand side panel. Covid-Neg, Covid negative; Mod, Moderate; Sev, Severe; Crt, Critical; Conv, Convalescent; Hlty, Healthy subjects. Box plots represent 25th to 75th percentiles and whiskers extend to 10th and 90th percentiles. P-values were determined with Student's t-test.

Update of

References

    1. Zhu N, Zhang D, Wang W, Li X, Yang B, Song J. et al. A Novel Coronavirus from Patients with Pneumonia in China, 2019. N Engl J Med. 2020;382:727–33. - PMC - PubMed
    1. Lu R, Zhao X, Li J, Niu P, Yang B, Wu H. et al. Genomic characterisation and epidemiology of 2019 novel coronavirus: implications for virus origins and receptor binding. Lancet. 2020;395:565–74. - PMC - PubMed
    1. Wu F, Zhao S, Yu B, Chen YM, Wang W, Song ZG. et al. A new coronavirus associated with human respiratory disease in China. Nature. 2020;579:265–9. - PMC - PubMed
    1. Zhou P, Yang XL, Wang XG, Hu B, Zhang L, Zhang W. et al. A pneumonia outbreak associated with a new coronavirus of probable bat origin. Nature. 2020;579:270–3. - PMC - PubMed
    1. Tian H, Liu Y, Li Y, Wu CH, Chen B, Kraemer MUG. et al. An investigation of transmission control measures during the first 50 days of the COVID-19 epidemic in China. Science (New York, NY) 2020;368:638–42. - PMC - PubMed

Publication types

LinkOut - more resources