. 2022 Sep 11;18(15):5724-5739.
doi: 10.7150/ijbs.76140. eCollection 2022.

HDAC5-mediated Smad7 silencing through MEF2A is critical for fibroblast activation and hypertrophic scar formation

Affiliations

HDAC5-mediated Smad7 silencing through MEF2A is critical for fibroblast activation and hypertrophic scar formation

Ya Gao et al. Int J Biol Sci. .

Abstract

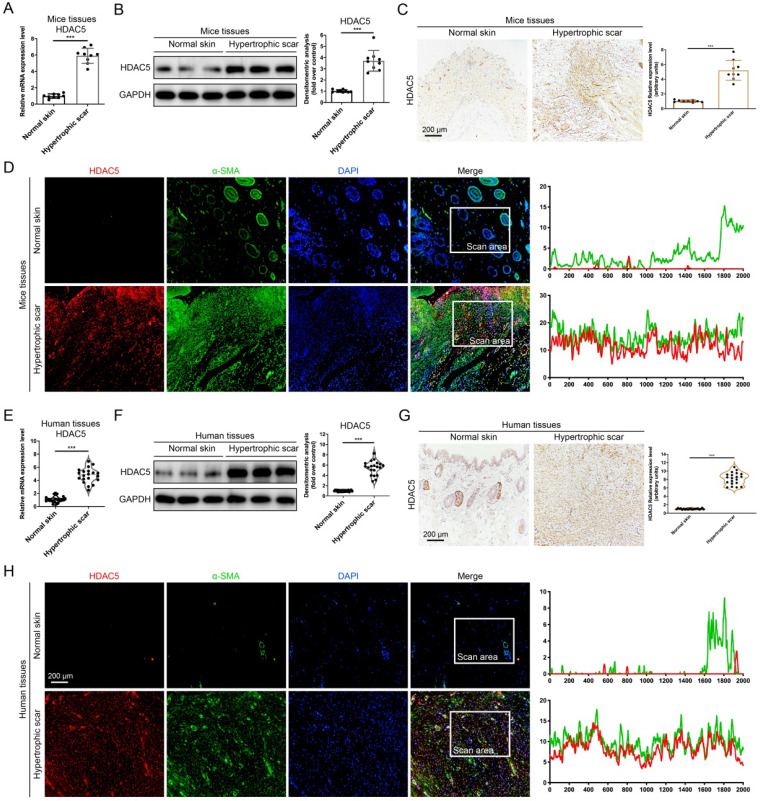
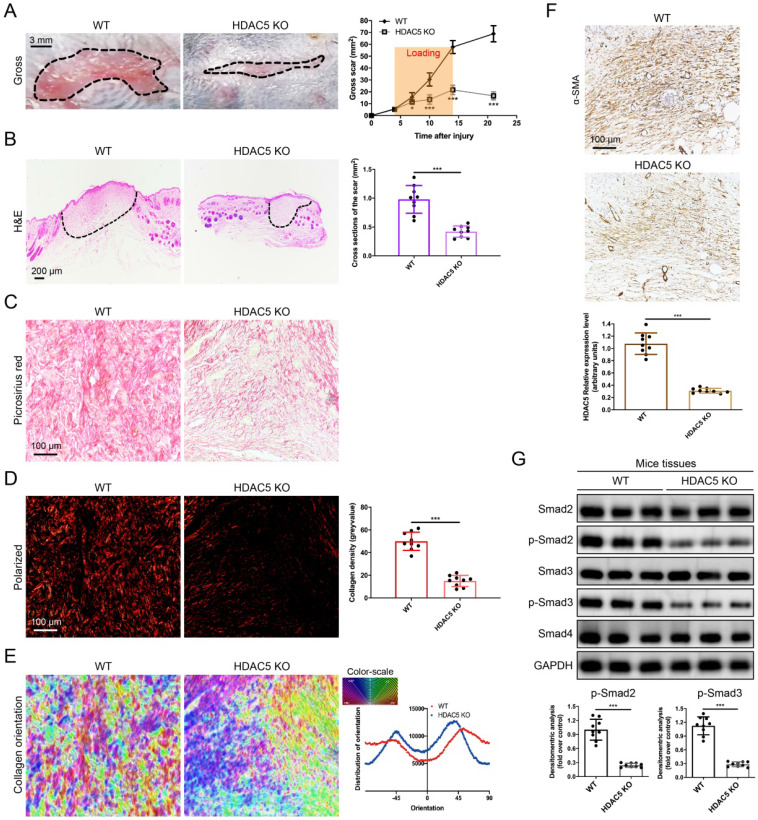
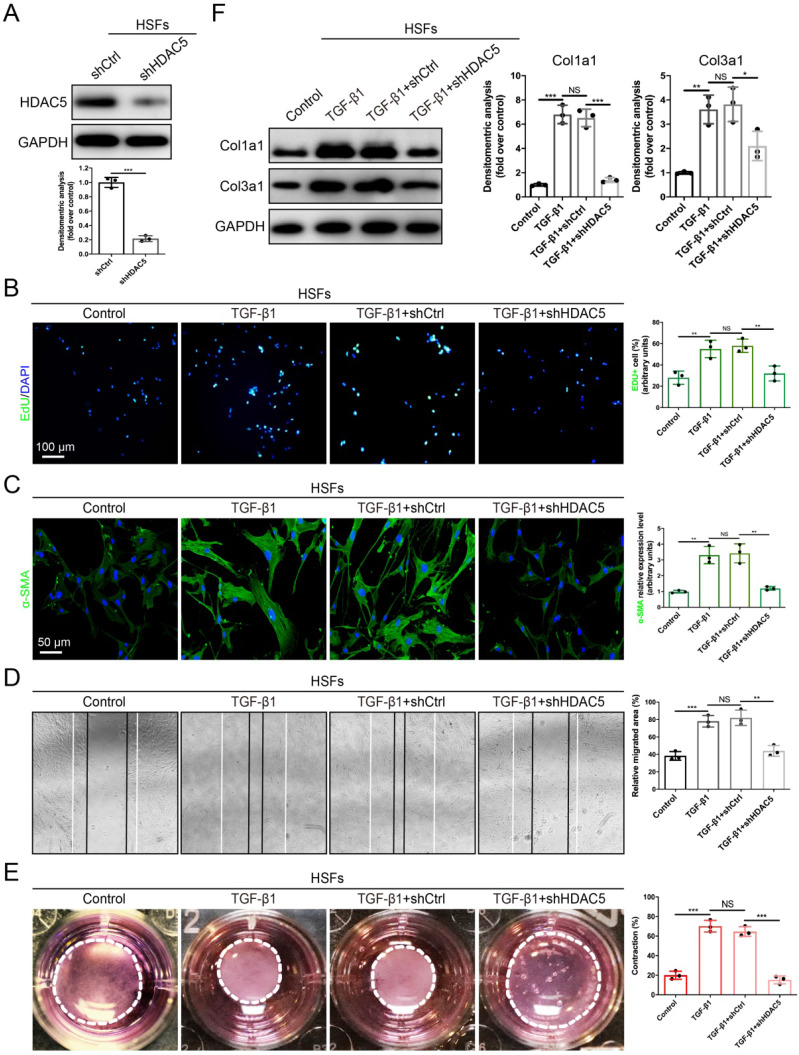
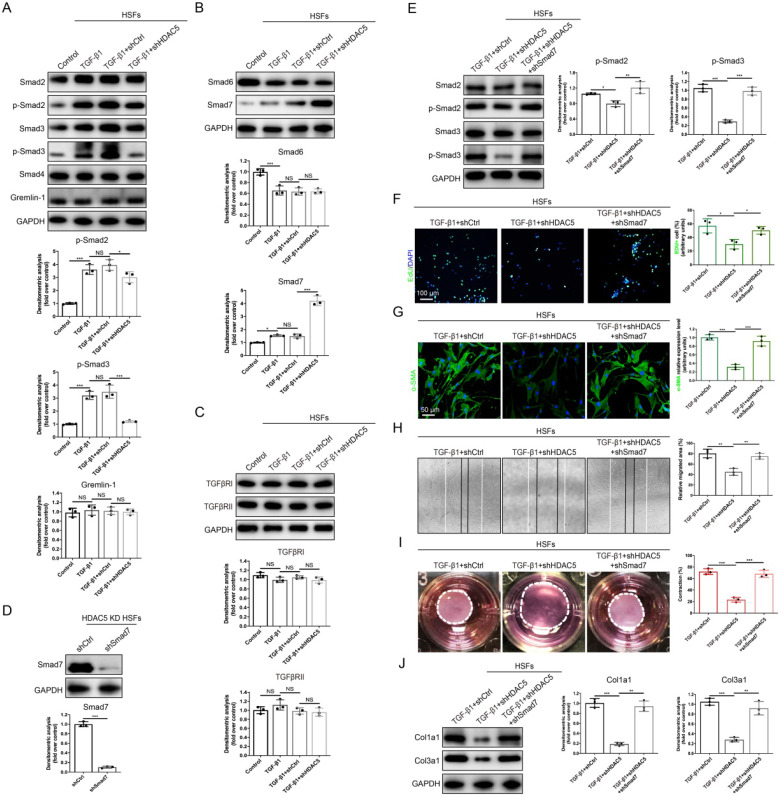
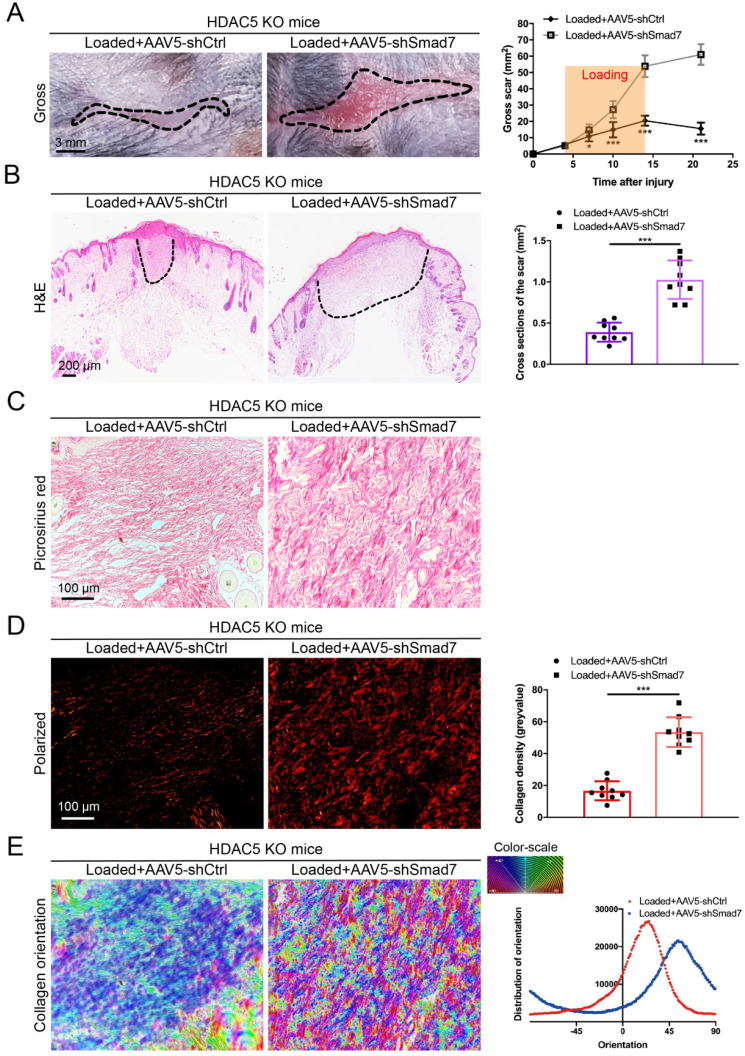
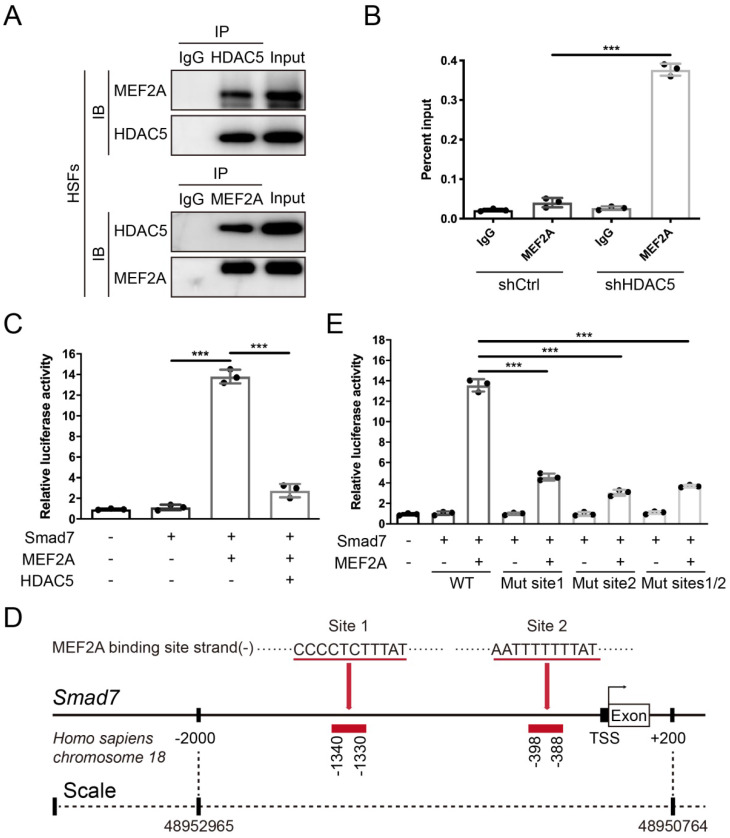
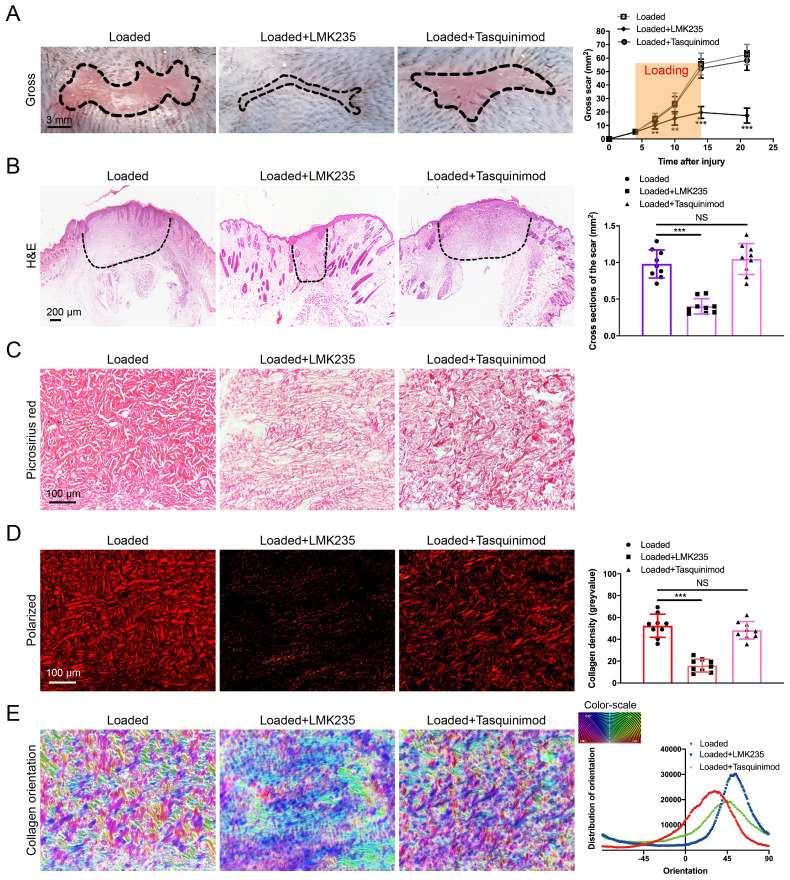
Transforming growth factor-β (TGF-β) signaling plays a key role in excessive fibrosis. As a class IIa family histone deacetylase (HDAC), HDAC5 shows a close relationship with TGF-β signaling and fibrosis. However, the effect and regulatory mechanism of HDAC5 in hypertrophic scar (HS) formation remain elusive. We show that HDAC5 was overexpressed in HS tissues and depletion of HDAC5 attenuated HS formation in vivo and inhibited fibroblast activation in vitro. HDAC5 knockdown (KD) significantly downregulated TGF-β1 induced Smad2/3 phosphorylation and increased Smad7 expression. Meanwhile, Smad7 KD rescued the Smad2/3 phosphorylation downregulation and scar hyperplasia inhibition mediated by HDAC5 deficiency. Luciferase reporter assays and ChIP-qPCR assays revealed that HDAC5 interacts with myocyte enhancer factor 2A (MEF2A) suppressing MEF2A binding to the Smad7 promoter region, which results in Smad7 promoter activity repression. HDAC4/5 inhibitor, LMK235, significantly alleviated hypertrophic scar formation. Our study provides clues for the development of HDAC5 targeting strategies for the therapy or prophylaxis of fibrotic diseases.

Keywords: HDAC5; Hypertrophic scar; MEF2A; Smad7; TGF-β.


Conflict of interest statement

Competing Interests: The authors have declared that no competing interest exists.

Figures

Figure 1
Figure 1
HDAC5 is overexpressed in mice and human HS. (A, B) The mRNA and protein levels of HDAC5 in normal mouse skin and HS tissues. (C) Images and quantitative analysis of immunohistochemical staining of HDAC5 in normal skin and HS tissues of mice. (Scale bar = 200 µm). (D) Immunofluorescence colocalization assay of HDAC5 and α-SMA in normal skin and HS tissues of mice. HDAC5 is labeled in red, and α-SMA is labeled in green. (Scale bar = 200 µm). (E, F) The mRNA and protein levels of HDAC5 in normal human skin and HS tissues. (G) Images and quantitative analysis of immunohistochemical staining of HDAC5 in normal skin and HS tissues of humans. (Scale bar = 200 µm). (H) Immunofluorescence colocalization assay of HDAC5 and α-SMA in normal skin and HS tissues of humans. HDAC5 is labeled in red, and α-SMA is labeled in green (Scale bar = 200 µm). Data are presented as the mean ± SD (n = 9 biologically independent animals and n = 20 biologically independent humans). ***P < 0.001.
Figure 2
Figure 2
HDAC5 knockout attenuates hypertrophic scar formation in vivo. (A) Images of scars 14 days postincision and gross area quantification at all examined time points. (Scale bar = 3 mm). (B) Images of H&E-stained sections and cross-section size quantification. The dashed lines outline the scar. (Scale bar = 200 µm). (C, D) Images of picrosirius red-stained sections under ordinary light and polarized light and collagen density quantification. (Scale bar = 100 µm). (E) The orientation of collagen fibers was quantified from picrosirius red using Orientation J software. The color representation reflects the different orientations. (F) Images and quantitative analysis of immunohistochemical staining of α-SMA in HS tissues. (Scale bar = 100 µm). (G) Western blot assay of phosphorylated and total Smad2 and Smad3 and total Smad4 in HS tissues. Data are presented as the mean ± SD (n = 9 biologically independent animals). *P < 0.05, ***P < 0.001.
Figure 3
Figure 3
HDAC5 knockdown inhibits TGF-β1-induced HSF activation. (A) Identification of shHDAC5 efficiency in HSFs. (B) EdU (green) proliferation assay for cultured HSFs after incubation with TGF-β1 for 24 h. (Scale bar = 100 µm). (C) Images and quantification of immunofluorescence staining for α-SMA in different groups. α-SMA is labeled in green. (Scale bar = 50 µm). (D) Images and quantification of wound healing assays in different groups 12 h after the addition of TGF-β1. (E) Images and quantification of collagen gel contraction assays in different groups on Day 3 after TGF-β1 addition. Dashed lines indicate the areas of collagen gel. (F) The protein levels of collagen I and III in HSFs pretreated with TGF-β1 for 24 h. Data are presented as the means with SEs (n = 3 independent experiments). *P < 0.05, **P < 0.01, ***P < 0.001, NS = not significant.
Figure 4
Figure 4
HDAC5-mediated Smad7 silencing is critical for TGF-β1-induced HSF activation. (A-C) Western blot assay of phosphorylated and total Smad2 and Smad3 and total Smad4, Smad6, Smad7, Gremlin 1, TGFβRI and TGFβRII in different groups. Samples were collected 12 h after the addition of TGF-β1. (D) Identification of shSmad7 efficiency in HSFs with HDAC5 KD. (E) The protein levels of phosphorylated and total Smad2 and Smad3 in MEFs pretreated with TGF-β1 for 12 h. (F) EdU (green) proliferation assay of cultured HSFs after incubation with TGF-β1 for 24 h (scale bar = 100 µm). (G) Images and quantification of immunofluorescence staining for α-SMA in different groups. α-SMA is labeled in green. (Scale bar = 50 µm). (H) Images and quantification of wound healing assays in different groups 12 h after TGF-β1 addition. (I) Images and quantification of collagen gel contraction assays in different groups on Day 3 after TGF-β1 addition. Dashed lines indicate the areas of collagen gel. (J) The protein levels of collagen I and III in HSFs pretreated with TGF-β1 for 24 h. Data are presented as the means with SEs (n = 3 independent experiments). *P < 0.05, **P < 0.01, ***P < 0.001, NS = not significant.
Figure 5
Figure 5
Smad7 KD promotes hypertrophic scar formation in HDAC5 KO mice. (A) Images of scars 14 days post-incision and gross area quantification at all examined time points. (Scale bar = 3 mm). (B) Images of H&E-stained sections and cross-section size quantification in different groups. The dashed lines outline the scar (scale bar = 200 µm). (C, D) Images of picrosirius red-stained sections under ordinary light and polarized light and collagen density quantification in different groups (scale bar = 100 µm). (E) The orientation of collagen fibers was quantified from picrosirius red using Orientation J software. The color representation reflects the different orientations. Data are presented as the mean ± SD (n = 9 biologically independent animals). *P < 0.05, ***P < 0.001.
Figure 6
Figure 6
HDAC5 interacts with MEF2A and diminishes its transcriptional activity on the Smad7 promoter region. (A) Co-IP assay between HDAC5 and MEF2A in HSFs. (B) ChIP assay confirmation of the binding of MEF2A to the Smad7 promoter region in the shCtrl and shHDAC5 groups of HSFs. DNA immunoprecipitated by MEF2A antibody or immunoglobulin G (IgG CTL) was amplified by RT-qPCR using primers for the Smad7 promoter. (C) Activation of the Smad7 promoter luciferase reporter by MEF2 and attenuation by HDAC5 in HSFs. (D) Prediction of MEF2A-binding sites in the Smad7 promoter region using JASPAR software. (E) Effects of MEF2A-binding site mutations in the Smad7 promoter on transcriptional activation by MEF2A. Data are presented as the means with SEs (n = 3 independent experiments). ***P < 0.001.
Figure 7
Figure 7
LMK235 attenuates hypertrophic scar formation in vivo. (A) Images of scars 14 days postincision and gross area quantification at all examined time points (scale bar = 3 mm). (B) Images of H&E-stained sections and cross-section size quantification in different groups. The dashed lines outline the scar (scale bar = 200 µm). (C, D) Images of picrosirius red-stained sections under ordinary light and polarized light and collagen density quantification in different groups (scale bar = 100 µm). (E) The orientation of collagen fibers was quantified from picrosirius red using Orientation J software. The color representation reflects the different orientations. Data are presented as the mean ± SD (n = 9 biologically independent animals). **P < 0.01, ***P < 0.001, NS = not significant.

Similar articles

Cited by

References

    1. Moortgat P, Meirte J, Maertens K, Lafaire C, De Cuyper L, Anthonissen M. Can a Cohesive Silicone Bandage Outperform an Adhesive Silicone Gel Sheet in the Treatment of Scars? A Randomized Comparative Trial. Plastic and Reconstructive Surgery. 2019;143:902–11. - PubMed
    1. Frangogiannis N. Transforming growth factor-β in tissue fibrosis. J Exp Med. 2020;217:e20190103. - PMC - PubMed
    1. Coentro JQ, Pugliese E, Hanley G, Raghunath M, Zeugolis DI. Current and upcoming therapies to modulate skin scarring and fibrosis. Advanced Drug Delivery Reviews. 2019;146:37–59. - PubMed
    1. Finnerty CC, Jeschke MG, Branski LK, Barret JP, Dziewulski P, Herndon DN. Hypertrophic scarring: the greatest unmet challenge after burn injury. Lancet. 2016;388:1427–36. - PMC - PubMed
    1. Meng XM, Nikolic-Paterson DJ, Lan HY. TGF-beta: the master regulator of fibrosis. Nat Rev Nephrol. 2016;12:325–38. - PubMed

Publication types

MeSH terms