

Transmission roles of symptomatic and asymptomatic COVID-19 cases: a modelling study
- PMID: 36263615
- PMCID: PMC9588416
- DOI: 10.1017/S0950268822001467
Transmission roles of symptomatic and asymptomatic COVID-19 cases: a modelling study
Abstract
Coronavirus disease 2019 (COVID-19) asymptomatic cases are hard to identify, impeding transmissibility estimation. The value of COVID-19 transmissibility is worth further elucidation for key assumptions in further modelling studies. Through a population-based surveillance network, we collected data on 1342 confirmed cases with a 90-days follow-up for all asymptomatic cases. An age-stratified compartmental model containing contact information was built to estimate the transmissibility of symptomatic and asymptomatic COVID-19 cases. The difference in transmissibility of a symptomatic and asymptomatic case depended on age and was most distinct for the middle-age groups. The asymptomatic cases had a 66.7% lower transmissibility rate than symptomatic cases, and 74.1% (95% CI 65.9-80.7) of all asymptomatic cases were missed in detection. The average proportion of asymptomatic cases was 28.2% (95% CI 23.0-34.6). Simulation demonstrated that the burden of asymptomatic transmission increased as the epidemic continued and could potentially dominate total transmission. The transmissibility of asymptomatic COVID-19 cases is high and asymptomatic COVID-19 cases play a significant role in outbreaks.
Keywords: Age-dependent contact; COVID-19; SARS-CoV-2; asymptomatic case; transmission.
Figures
 ,
,  and
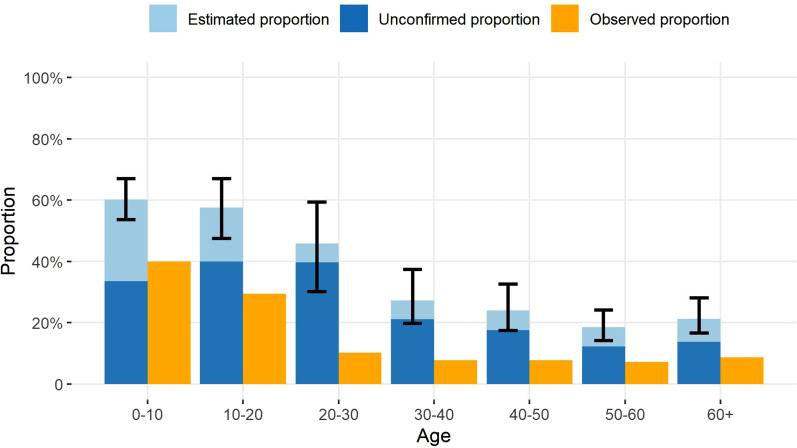
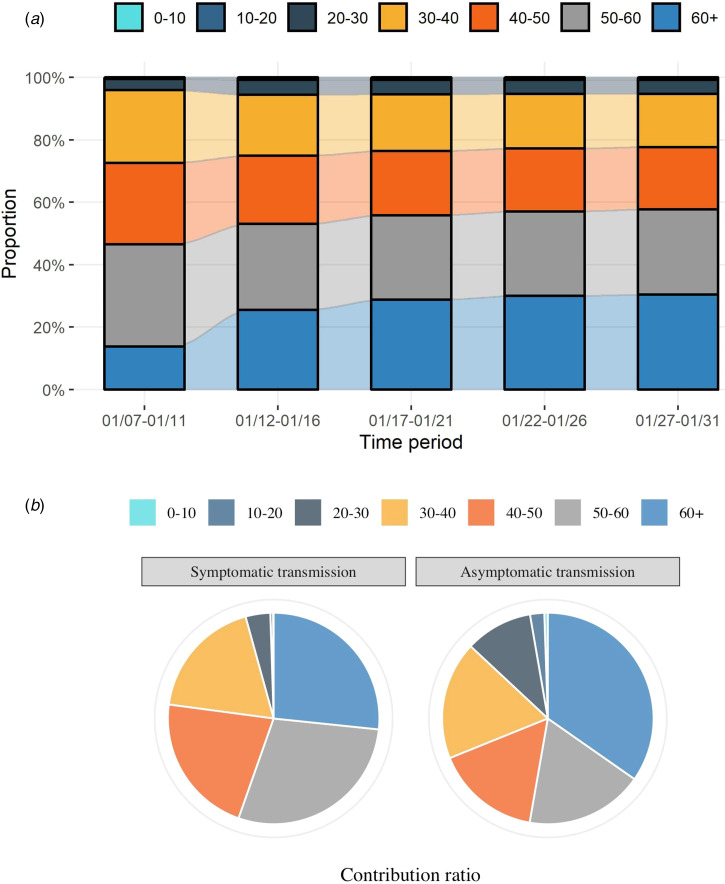
and  , respectively. The 95% credible intervals for the estimated proportions of asymptomatic cases are shown for each age group.
Similar articles
-
Age-related model for estimating the symptomatic and asymptomatic transmissibility of COVID-19 patients.Biometrics. 2023 Sep;79(3):2525-2536. doi: 10.1111/biom.13814. Epub 2022 Dec 28. Biometrics. 2023. PMID: 36517992 Free PMC article.
-
Transmission dynamics and control of two epidemic waves of SARS-CoV-2 in South Korea.BMC Infect Dis. 2021 May 26;21(1):485. doi: 10.1186/s12879-021-06204-6. BMC Infect Dis. 2021. PMID: 34039296 Free PMC article.
-
Exploring secondary SARS-CoV-2 transmission from asymptomatic cases using contact tracing data.Theor Biol Med Model. 2021 Jul 16;18(1):12. doi: 10.1186/s12976-021-00144-z. Theor Biol Med Model. 2021. PMID: 34271962 Free PMC article.
-
Global Percentage of Asymptomatic SARS-CoV-2 Infections Among the Tested Population and Individuals With Confirmed COVID-19 Diagnosis: A Systematic Review and Meta-analysis.JAMA Netw Open. 2021 Dec 1;4(12):e2137257. doi: 10.1001/jamanetworkopen.2021.37257. JAMA Netw Open. 2021. PMID: 34905008 Free PMC article.
-
Comparative analysis of viral infection outcomes in human seminal fluid from prior viral epidemics and Sars-CoV-2 may offer trends for viral sexual transmissibility and long-term reproductive health implications.Reprod Health. 2021 Jun 10;18(1):123. doi: 10.1186/s12978-021-01172-1. Reprod Health. 2021. PMID: 34112171 Free PMC article. Review.
Cited by
-
Global and genetic diversity of SARS-CoV-2 in wastewater.Heliyon. 2024 Mar 3;10(5):e27452. doi: 10.1016/j.heliyon.2024.e27452. eCollection 2024 Mar 15. Heliyon. 2024. PMID: 38463823 Free PMC article.
-
Social Mixing and Network Characteristics of COVID-19 Patients Before and After Widespread Interventions: A Population-based Study.Epidemiol Infect. 2023 Aug 14;151:1-38. doi: 10.1017/S0950268823001292. Online ahead of print. Epidemiol Infect. 2023. PMID: 37577939 Free PMC article.
-
COVID-19 surveillance report for Sudan, 2020 to 2021.Heliyon. 2024 Mar 20;10(7):e27965. doi: 10.1016/j.heliyon.2024.e27965. eCollection 2024 Apr 15. Heliyon. 2024. PMID: 38560161 Free PMC article.
-
Interventions for SARS-CoV-2 prevention among Jailed adults: A network-based modeling analysis.Infect Dis Model. 2025 Feb 4;10(2):628-638. doi: 10.1016/j.idm.2025.02.001. eCollection 2025 Jun. Infect Dis Model. 2025. PMID: 40027595 Free PMC article.
-
Treatment failure and the threshold of disease extinction.Infect Dis Model. 2024 Dec 17;10(2):453-465. doi: 10.1016/j.idm.2024.12.007. eCollection 2025 Jun. Infect Dis Model. 2024. PMID: 39816756 Free PMC article.
References
-
- World Health Organization. (2020). WHO Coronavirus Disease (COVID-19) Dashboard.
Publication types
MeSH terms
LinkOut - more resources
Full Text Sources
Medical
Miscellaneous
