Population-level salt intake in the WHO European Region in 2022: a systematic review
- PMID: 36263661
- PMCID: PMC10801383
- DOI: 10.1017/S136898002200218X
Population-level salt intake in the WHO European Region in 2022: a systematic review
Abstract
Objective: The WHO recommends that adults consume less than 5 g of salt per day to reduce the risk of CVD. This study aims to examine the average population daily salt intake in the fifty-three Member States of the WHO European Region.
Design: A systematic review was conducted to examine the most up-to-date salt intake data for adults published between 2000 and 2022. Data were obtained from peer-reviewed and grey literature, WHO surveys and studies, as well as from national and global experts.
Setting: The fifty-three Member States of the WHO European Region.
Participants: People aged 12 years or more.
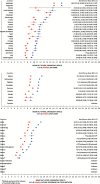
Results: We identified fifty studies published between 2010 and 2021. Most countries in the WHO European Region (n 52, 98 %) reported salt intake above WHO recommended maximum levels. In almost all countries (n 52, 98 %), men consume more salt than women, ranging between 5·39 and 18·51 g for men and 4·27 and 16·14 g for women. Generally, Western and Northern European countries have the lowest average salt intake, whilst Eastern European and Central Asian countries have the highest average. Forty-two percentage of the fifty-three countries (n 22) measured salt intake using 24 h urinary collection, considered the gold standard method.
Conclusions: This study found that salt intakes in the WHO European Region are significantly above WHO recommended levels. Most Member States of the Region have conducted some form of population salt intake. However, methodologies to estimate salt intake are highly disparate and underestimations are very likely.
Keywords: Europe; Na; Non-communicable diseases; Salt; Systematic review.
Conflict of interest statement
The writing group takes sole responsibility for the content of this article, and the content of this article reflects the views of the authors only. E.J.L.K. is a consultant, and S.W., J.B., I.R. and KW are staff members of the WHO. F.P.C. is a technical advisor to the WHO and an unpaid member of Action on Salt and World Action on Salt & Health (WASH). The authors alone are responsible for the views expressed in this publication, and they do not necessarily represent the decisions or the stated policy of the WHO.
Figures


References
Publication types
MeSH terms
Substances
Grants and funding
LinkOut - more resources
Full Text Sources
Medical

