. 2022 Dec;12(12):2191-2202.
doi: 10.1002/2211-5463.13498. Epub 2022 Oct 28.

Haemophilus influenzae Protein D antibody suppression in a multi-component vaccine formulation

Affiliations

Haemophilus influenzae Protein D antibody suppression in a multi-component vaccine formulation

Lea V Michel et al. FEBS Open Bio. 2022 Dec.

Abstract

Nontypeable Haemophilus influenzae (NTHi) has emerged as a dominant mucosal pathogen causing acute otitis media (AOM) in children, acute sinusitis in children and adults, and acute exacerbations of chronic bronchitis in adults. Consequently, there is an urgent need to develop a vaccine to protect against NTHi infection. A multi-component vaccine will be desirable to avoid emergence of strains expressing modified proteins allowing vaccine escape. Protein D (PD), outer membrane protein (OMP) 26, and Protein 6 (P6) are leading protein vaccine candidates against NTHi. In pre-clinical research using mouse models, we found that recombinantly expressed PD, OMP26, and P6 induce robust antibody responses after vaccination as individual vaccines, but when PD and OMP26 were combined into a single vaccine formulation, PD antibody levels were significantly lower. We postulated that PD and OMP26 physiochemically interacted to mask PD antigenic epitopes resulting in the observed effect on antibody response. However, column chromatography and mass spectrometry analysis did not support our hypothesis. We postulated that the effect might be in vivo through the mechanism of protein vaccine immunologic antigenic competition. We found when PD and OMP26 were injected into the same leg or separate legs of mice, so that antigens were immunologically processed at the same or different regional lymph nodes, respectively, antibody levels to PD were significantly lower with same leg vaccination. Different leg vaccination produced PD antibody levels quantitatively similar to vaccination with PD alone. We conclude that mixing PD and OMP26 into a single vaccine formulation requires further formulation studies.

Keywords: Haemophilus influenzae; Protein D; acute otitis media; antibody suppression; antigenic competition; outer membrane protein 26.


Conflict of interest statement

The authors declare no conflict of interest.

Figures

Fig. 1
Fig. 1
Antibody levels measured with ELISA. All vaccine formulations contain aluminum hydroxide (Alum). Results shown follow three vaccinations to 6‐ to 8‐week‐old C57BL mice with dose 1 at day 0, dose 2 7 days later, and dose 3 14 days after dose 2. Serum was collected 2 weeks after dose 3 and quantitated for antibody to Protein D (PD), P6, or OMP26. Plus sign (+) means the proteins were mixed in equal proportions at 10 μg each. All vaccine groups contained four or five mice, except PD + OMP26 (eight mice). Endpoint levels of antibody in log base 10 are displayed on the vertical axis and vaccine formulations on the horizontal axis. Differences between groups were determined by unpaired parametric t‐test. Not all significantly different pairs were shown for better clarity of the figure. Mean and standard error values are displayed. **P ≤ 0.01; ***P ≤ 0.001; ****P ≤ 0.0001, ns, not significant.
Fig. 2
Fig. 2
Stained SDS/PAGE gels (A and B) and western blots (C and D) from cobalt affinity purification experiments. Talon beads were incubated with cell lysates for 1 h at room temperature or overnight at 4 °C from E. coli cultures of A: (1) His‐tagged OMP26, (2) Non‐His‐tagged OMP26, (3) His‐tagged PD, (4) His‐tagged PD mixed 1 : 1 with non‐His‐tagged OMP26; B: (5) His‐tagged PD, (6) Non‐His‐tagged PD, (7) His‐tagged OMP26, (8) His‐tagged OMP26 mixed 1 : 1 with non‐His‐tagged PD. C: (1) a 1 : 1 mixture of His‐tagged PD and non‐His‐tagged OMP26, (2) His‐tagged PD, (3) non‐His‐tagged OMP26, (4) His‐tagged OMP26; D: (5) a 1 : 1 mixture of His‐tagged OMP26 and non‐His‐tagged PD, (6) His‐tagged OMP26, (7) Non‐His‐tagged PD, or (8) His‐tagged PD. Both blots were developed using a mixture of mouse antisera to PD and OMP26. Molecular weights of ladder markers (L) are in kDa.
Fig. 3
Fig. 3
Stained SDS/PAGE gel from a cobalt affinity purification experiment with cell lysates and aluminum hydroxide. Talon beads were incubated with aluminum hydroxide (500 μg·mL−1) and a 1 : 1 mixture of cell lysates from E. coli cultures overexpressing non‐His‐tagged OMP26 and His‐tagged PD. Lanes 1–6 contain initial flow‐through off the columns (1–3) or flow‐through off the column after washing with equilibration buffer (wash, 4–6). Fractions eluted from the Talon beads with 150 mm imidazole buffer (Eluted protein) were run in lanes 7–9. OMP26 was not present in the eluted fractions following incubation with the 1 : 1 mixture of non‐His‐tagged OMP26 and His‐tagged Protein D. Molecular weights of ladder (L) markers are in kDa.
Fig. 4
Fig. 4
Nano‐electrospray ionization MS and Ion Mobility plots of Protein D and OMP26. (Left, top to bottom) Nano‐electrospray ionization mass spectra of OMP26 alone, Protein D (PD) alone, and a 1 : 1 mixture of PD and OMP26. All proteins were buffer exchanged into 200 mm ammonium acetate, pH 6.8, and diluted to 5 μm in concentration. The predicted charge states and oligomeric states are labeled. (Right, top to bottom) Ion mobility plots of drift time versus m/z of OMP26 alone, PD alone, and a 1 : 1 mixture of PD and OMP26. The ion species of the predicted protein complexes were circled and labeled accordingly. None of the data were indicative of a PD‐OMP26 complex.
Fig. 5
Fig. 5
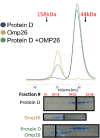
SEC characterization of Protein D (PD), OMP26, and the PD‐OMP26 mixture. Individual PD and OMP26 proteins were purified on Talon beads and then diluted in half with phosphate‐buffered saline (PBS). The PD‐OMP26 1 : 1 mixture was incubated at 4 °C for 1 h. All proteins were separated on a GE Life Sciences HiLoad 16/600 Superdex 200 pg size exclusion column (SEC), pre‐equilibrated with PBS, and then separated at a flow rate of 0.5 mL·min−1. SEC chromatogram traces and corresponding SDS/PAGE Coomassie Brilliant Blue stained gels are shown. Gel lanes are positioned under the SEC fractions from which they derive; equal volumes of SEC fractions were loaded into gel lanes, as labeled. Black boxes denote that images were derived from separate gels that were all separated, stained, and destained similarly. Gels were placed on plastic sleeves with white paper inside as a background, and images were captured on a benchtop with an iPhone camera. Approximate peak locations using a molecular size standard are indicated with arrows.
Fig. 6
Fig. 6
Protein D (PD) antibody levels in response to pre‐mixed vaccines with different PD:Omp26:P6 ratios. All vaccine formulations contain aluminum hydroxide (Alum). The vaccine formulations contain Protein D (PD), OMP26, and/or P6, each at 10 μg per dose or in some formulations 1 μg per dose, as indicated (1 = 1 μg of antigen; 10 = 10 μg of antigen). Results shown follow three vaccinations to 6‐ to 8‐week‐old C57BL mice with dose 1 at day 0, dose 2 7 days later, and dose 3 14 days after dose 2. Serum was collected 2 weeks after dose 3 and quantitated for antibody to PD. All vaccine groups contained five mice, except PD + OMP26 + P6 (10 : 1 : 1) (four mice), OMP26 + P6 (10 : 10) (four mice), PD (10) (three mice), and Alum (four mice). Endpoint levels of antibody in log base 10 are displayed on the vertical axis and vaccine formulations on the horizontal axis. Differences between groups were determined by unpaired parametric t‐test. Not all significantly different pairs were shown for better clarity of the figure. Mean and standard error values are displayed. P values from the unpaired parametric t‐test are labeled. *P ≤ 0.05; ****P ≤ 0.0001; ns, not significant.
Fig. 7
Fig. 7
Intramuscular vs. intraperitoneal injections. All vaccine formulations contain aluminum hydroxide (Alum). Vaccine formulations contain Protein D (PD) alone (10 μg per dose) or a mixture of PD, OMP26, and P6, each at 10 μg per dose. Results shown follow three vaccinations to 6‐ to 8‐week‐old C57BL mice with dose 1 at day 0, dose 2 7 days later, and dose 3 14 days after dose 2. Serum was collected 2 weeks after dose 3 and quantitated for antibody to PD. Both trivalent vaccine groups contained five mice, while the i.m. PD group contained six mice and i.p. PD group contained nine mice. Endpoint levels of antibody in log base 10 are displayed on the vertical axis and vaccine formulations on the horizontal axis. Differences between groups were determined by unpaired parametric t‐test. Not all significantly different pairs were shown for better clarity of the figure. Mean and standard error values are displayed. P values from the unpaired parametric t‐test are labeled. *P ≤ 0.05, ****P ≤ 0.0001.
Fig. 8
Fig. 8
Protein D (PD) antibody levels in response to vaccines given in the same or separate leg injections. All vaccine formulations contain aluminum hydroxide (Alum). Protein vaccines contained one or more of the three antigens (PD, OMP26, P6), each at 5 μg per dose. For PD + OMP26 mix and PD + OMP26 + P6 mix, all listed antigens were mixed into a single formulation and injected into the same leg. For PD + OMP26 separate, PD and OMP26 were injected into separate legs. For PD + OMP26 + P6 separate, PD was mixed with P6 and injected into one leg and OMP26 was injected into the other leg. All vaccines were given to 6‐ to 8‐week‐old C57BL mice with dose 1 at day 0, dose 2 7 days later, and dose 3 14 days after dose 2. Serum was collected 2 weeks after dose 2, prior to dose 3 injections (black), and 2 weeks after dose 3 (red), and quantitated for antibody to PD. All groups contained five mice except PD + OMP26 separate after three doses (four mice). Endpoint levels of antibody in log base 10 are displayed on the vertical axis and vaccine formulations on the horizontal axis. Differences between groups were determined by unpaired parametric t‐test. Not all significantly different pairs were shown for better clarity of the figure. Mean and standard error values are displayed. P values from the unpaired parametric t‐test are labeled. **P ≤ 0.01; ***P ≤ 0.001; ****P ≤ 0.0001; ns (not significant).

References

    1. Casey JR, Adlowitz DG, Pichichero ME. New patterns in the otopathogens causing acute otitis media six to eight years after introduction of pneumococcal conjugate vaccine. Pediatr Infect Dis J. 2010;29:304–9. - PMC - PubMed
    1. Kaur R, Casey JR, Pichichero ME. Relationship with original pathogen in recurrence of acute otitis media after completion of amoxicillin/clavulanate: bacterial relapse or new pathogen. Pediatr Infect Dis J. 2013;32:1159–62. - PMC - PubMed
    1. Barkai G, Leibovitz E, Givon‐Lavi N, Dagan R. Potential contribution by nontypable Haemophilus influenzae in protracted and recurrent acute otitis media. Pediatr Infect Dis J. 2009;28:466–71. - PubMed
    1. Pichichero ME. Vaccine‐induced immunologic memory and pace of pathogenesis: predicting the need for boosters. Expert Rev Vaccines. 2008;7:1299–303. - PubMed
    1. Leibovitz E, Asher E, Piglansky L, Givon‐Lavi N, Satran R, Raiz S, et al. Is bilateral acute otitis media clinically different than unilateral acute otitis media? Pediatr Infect Dis J. 2007;26:589–92. - PubMed

Publication types