

Accessing the Variability of Multicopy Genes in Complex Genomes using Unassembled Next-Generation Sequencing Reads: The Case of Trypanosoma cruzi Multigene Families
- PMID: 36264102
- PMCID: PMC9765020
- DOI: 10.1128/mbio.02319-22
Accessing the Variability of Multicopy Genes in Complex Genomes using Unassembled Next-Generation Sequencing Reads: The Case of Trypanosoma cruzi Multigene Families
Abstract
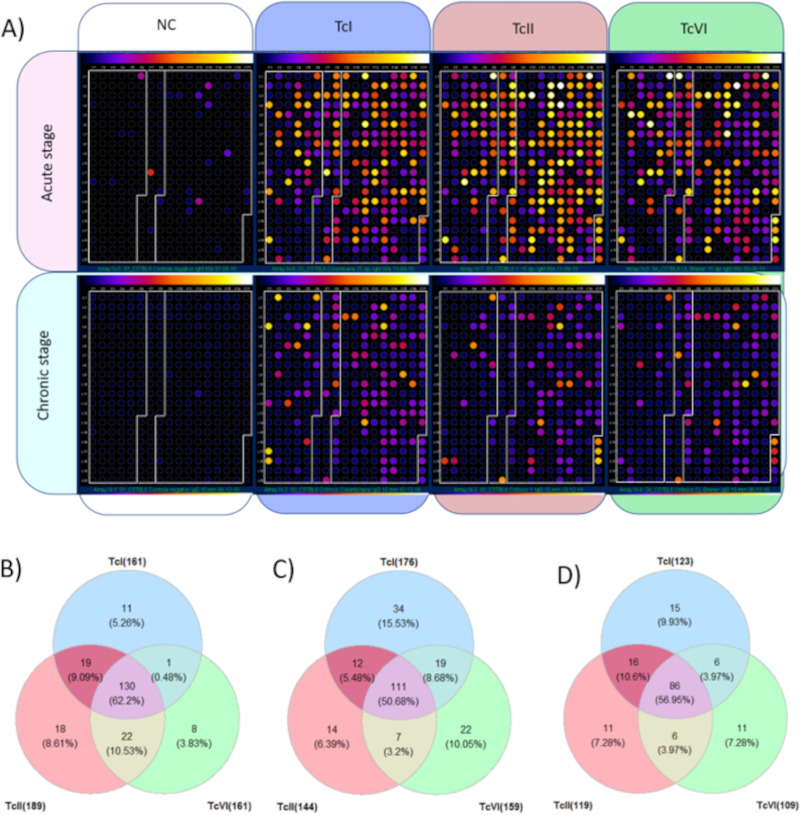
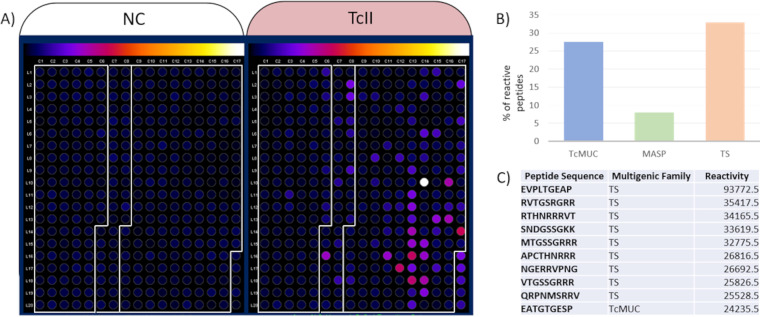
Repetitive elements cause assembly fragmentation in complex eukaryotic genomes, limiting the study of their variability. The genome of Trypanosoma cruzi, the parasite that causes Chagas disease, has a high repetitive content, including multigene families. Although many T. cruzi multigene families encode surface proteins that play pivotal roles in host-parasite interactions, their variability is currently underestimated, as their high repetitive content results in collapsed gene variants. To estimate sequence variability and copy number variation of multigene families, we developed a read-based approach that is independent of gene-specific read mapping and de novo assembly. This methodology was used to estimate the copy number and variability of MASP, TcMUC, and Trans-Sialidase (TS), the three largest T. cruzi multigene families, in 36 strains, including members of all six parasite discrete typing units (DTUs). We found that these three families present a specific pattern of variability and copy number among the distinct parasite DTUs. Inter-DTU hybrid strains presented a higher variability of these families, suggesting that maintaining a larger content of their members could be advantageous. In addition, in a chronic murine model and chronic Chagasic human patients, the immune response was focused on TS antigens, suggesting that targeting TS conserved sequences could be a potential avenue to improve diagnosis and vaccine design against Chagas disease. Finally, the proposed approach can be applied to study multicopy genes in any organism, opening new avenues to access sequence variability in complex genomes. IMPORTANCE Sequences that have several copies in a genome, such as multicopy-gene families, mobile elements, and microsatellites, are among the most challenging genomic segments to study. They are frequently underestimated in genome assemblies, hampering the correct assessment of these important players in genome evolution and adaptation. Here, we developed a new methodology to estimate variability and copy numbers of repetitive genomic regions and employed it to characterize the T. cruzi multigene families MASP, TcMUC, and transsialidase (TS), which are important virulence factors in this parasite. We showed that multigene families vary in sequence and content among the parasite's lineages, whereas hybrid strains have a higher sequence variability that could be advantageous to the parasite's survivability. By identifying conserved sequences within multigene families, we showed that the mammalian host immune response toward these multigene families is usually focused on the TS multigene family. These TS conserved and immunogenic peptides can be explored in future works as diagnostic targets or vaccine candidates for Chagas disease. Finally, this methodology can be easily applied to any organism of interest, which will aid in our understanding of complex genomic regions.
Keywords: MASP; T. cruzi; antigenicity; complex genomes; copy number variation; mucins; multicopy genes; transsialidases; variability.
Conflict of interest statement
The authors declare no conflict of interest.
Figures
Similar articles
-
An algorithm for annotation and classification of T. cruzi MASP sequences: towards a better understanding of the parasite genetic variability.BMC Genomics. 2025 Feb 24;26(1):194. doi: 10.1186/s12864-025-11384-5. BMC Genomics. 2025. PMID: 39994548 Free PMC article.
-
Assembly of highly repetitive genomes using short reads: the genome of discrete typing unit III Trypanosoma cruzi strain 231.Microb Genom. 2018 Apr;4(4):e000156. doi: 10.1099/mgen.0.000156. Epub 2018 Feb 14. Microb Genom. 2018. PMID: 29442617 Free PMC article.
-
Expanding an expanded genome: long-read sequencing of Trypanosoma cruzi.Microb Genom. 2018 May;4(5):e000177. doi: 10.1099/mgen.0.000177. Epub 2018 Apr 30. Microb Genom. 2018. PMID: 29708484 Free PMC article.
-
Trypanosoma cruzi Genome Assemblies: Challenges and Milestones of Assembling a Highly Repetitive and Complex Genome.Methods Mol Biol. 2019;1955:1-22. doi: 10.1007/978-1-4939-9148-8_1. Methods Mol Biol. 2019. PMID: 30868515 Review.
-
Trypanosoma cruzi: Genomic Diversity and Structure.Pathogens. 2025 Jan 12;14(1):61. doi: 10.3390/pathogens14010061. Pathogens. 2025. PMID: 39861022 Free PMC article. Review.
Cited by
-
Clinical Trypanosoma cruzi isolates share a common antigen repertoire that is absent from culture adapted strains.bioRxiv [Preprint]. 2025 Jun 4:2025.06.04.657671. doi: 10.1101/2025.06.04.657671. bioRxiv. 2025. PMID: 40501824 Free PMC article. Preprint.
-
The time has come for a vaccine against Chagas disease.Lancet Reg Health Am. 2025 Mar 21;45:101059. doi: 10.1016/j.lana.2025.101059. eCollection 2025 May. Lancet Reg Health Am. 2025. PMID: 40206818 Free PMC article. Review.
-
An algorithm for annotation and classification of T. cruzi MASP sequences: towards a better understanding of the parasite genetic variability.BMC Genomics. 2025 Feb 24;26(1):194. doi: 10.1186/s12864-025-11384-5. BMC Genomics. 2025. PMID: 39994548 Free PMC article.
-
Gut membrane proteins as candidate antigens for immunization of mice against the tick Amblyomma sculptum.Vaccine. 2024 Aug 30;42(21):126141. doi: 10.1016/j.vaccine.2024.07.042. Epub 2024 Jul 20. Vaccine. 2024. PMID: 39033080
-
Validation of the NAT Chagas IVD Kit for the Detection and Quantification of Trypanosoma cruzi in Blood Samples of Patients with Chagas Disease.Life (Basel). 2023 May 24;13(6):1236. doi: 10.3390/life13061236. Life (Basel). 2023. PMID: 37374019 Free PMC article.
References
-
- El-Sayed NM, Myler PJ, Blandin G, Berriman M, Crabtree J, Aggarwal G, Caler E, Renauld H, Worthey EA, Hertz-Fowler C, Ghedin E, Peacock C, Bartholomeu DC, Haas BJ, Tran A-N, Wortman JR, Alsmark UCM, Angiuoli S, Anupama A, Badger J, Bringaud F, Cadag E, Carlton JM, Cerqueira GC, Creasy T, Delcher AL, Djikeng A, Embley TM, Hauser C, Ivens AC, Kummerfeld SK, Pereira-Leal JB, Nilsson D, Peterson J, Salzberg SL, Shallom J, Silva JC, Sundaram J, Westenberger S, White O, Melville SE, Donelson JE, Andersson B, Stuart KD, Hall N. 2005. Comparative genomics of trypanosomatid parasitic protozoa. Science 309:404–409. doi:10.1126/science.1112181. - DOI - PubMed
Publication types
MeSH terms
Substances
LinkOut - more resources
Full Text Sources
Medical
