. 2023 Feb 12;191(2):1199-1213.
doi: 10.1093/plphys/kiac487.

Specialized metabolism by trichome-enriched Rubisco and fatty acid synthase components

Affiliations

Specialized metabolism by trichome-enriched Rubisco and fatty acid synthase components

Wangming Ji et al. Plant Physiol. .

Abstract

Acylsugars, specialized metabolites with defense activities, are secreted by trichomes of many solanaceous plants. Several acylsugar metabolic genes (AMGs) remain unknown. We previously reported multiple candidate AMGs. Here, using multiple approaches, we characterized additional AMGs. First, we identified differentially expressed genes between high- and low-acylsugar-producing F2 plants derived from a cross between cultivated tomato (Solanum lycopersicum) and a wild relative (Solanum pennellii), which produce acylsugars that are ∼1% and ∼20% of leaf dry weight, respectively. Expression levels of many known and candidate AMGs positively correlated with acylsugar amounts in F2 individuals. Next, we identified lycopersicum-pennellii putative orthologs with higher nonsynonymous to synonymous substitutions. These analyses identified four candidate genes, three of which showed enriched expression in stem trichomes compared to underlying tissues (shaved stems). Virus-induced gene silencing confirmed two candidates, Sopen05g009610 [beta-ketoacyl-(acyl-carrier-protein) reductase; fatty acid synthase component] and Sopen07g006810 (Rubisco small subunit), as AMGs. Phylogenetic analysis indicated that Sopen05g009610 is distinct from specialized metabolic cytosolic reductases but closely related to two capsaicinoid biosynthetic reductases, suggesting evolutionary relationship between acylsugar and capsaicinoid biosynthesis. Analysis of publicly available datasets revealed enriched expression of Sopen05g009610 orthologs in trichomes of several acylsugar-producing species. Similarly, orthologs of Sopen07g006810 were identified as solanaceous trichome-enriched members, which form a phylogenetic clade distinct from those of mesophyll-expressed "regular" Rubisco small subunits. Furthermore, δ13C analyses indicated recycling of metabolic CO2 into acylsugars by Sopen07g006810 and showed how trichomes support high levels of specialized metabolite production. These findings have implications for genetic manipulation of trichome-specialized metabolism in solanaceous crops.


Conflict of interest statement

Conflict of interest statement. None declared.

Figures
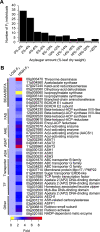
Figure 1
Figure 1
Acylsugar accumulation and expression of known and candidate AMGs in a S. lycopersicum VF36 × S. pennellii LA0716 F2 population. A, Histogram showing acylsugar amount distribution among 114 F2 plants. For each plant, three replicates were used to measure acylsugar amount. B, Heatmap showing relative expression levels (set to one-fold in the LOW-F2 group) of genes with known and putative roles in acylsugar metabolism. Solanum pennellii gene identifier numbers (Sopen IDs) are given with annotations. BCAA, branched-chain amino acid; BCFA, branched-chain fatty acid; FAS, fatty acid synthase component; AAE, acyl-activating enzyme; ASAT, acylsugar acyltransferase; ASH, acylsugar acylhydrolase; TF, transcription factor; BCKDH, branched-chain keto acid dehydrogenase; AACS1, acylsugar acyl-CoA synthetase 1; AECH1, acylsugar enoyl-CoA hydratase 1; ASFF1, acylsucrose fructofuranosidase 1.
Figure 2
Figure 2
Selection of candidate AMGs. A, Distribution of nonsynonymous to synonymous substitution rate ratios (dN/dS ratios) of putative ortholog pairs from S. pennellii and S. lycopersicum. B, Venn diagram showing the intersections of three sets of candidate AMGs: (1) DEGs between high- and low-acylsugar-producing S. pennellii accessions (Mandal et al., 2020); (2) DEGs between high- and low-acylsugar-producing F2 plants (HIGH-F2 and LOW-F2, respectively); and (3) genes with dN/dS > 1 between S. pennellii and S. lycopersicum putative orthologs. Four genes were identified at the intersections of these three sets. C, Relative expression levels of the four candidate AMGs [SpRBCS1 (Sopen07g006810), SpKAR1 (Sopen05g009610), SpSTPL (Sopen05g032580), and Sopen05g034770] in isolated stem trichomes and underlying tissues of shaved stems (normalized to one-fold) in S. pennellii LA0716. SpASAT1 (Sopen12g002290), the ortholog of S. lycopersicum trichome tip-cell-expressed ASAT1 (Fan et al., 2016), was included for comparison. Error bars indicate Se (n = 5 individual plants).
Figure 3
Figure 3
VIGS of three trichome-enriched candidate AMGs in S. pennellii LA0716. For (A), (C), and (D), error bars indicate Se (n = 10, 12, 11, and 12 individual plants for control, VIGS-KAR1, VIGS-RBCS1, and VIGS-STPL groups, respectively; *P < 0.05, **P < 0.01, ***P < 0.001, ****P < 0.0001; Dunnett’s test). A, Acylsugar quantification by LC–MS. To quantify acylsugar amounts, chromatogram peak areas were normalized by internal standard (IS) area and leaf dry weight (LDW). B, Representative chromatograms (normalized by IS area and LDW) showing metabolite peaks in control and VIGS-RBCS1 plants. Metabolite peaks are listed in Supplemental Data Set 4. C, Quantification of a likely flavonoid peak in LC–MS analysis. D, Acylsugar acyl chain composition analysis by GC–MS. Predominant acyl chains are shown. Me, methyl; C3-C12 indicate acyl chain length (e.g. 2-MeC3 and n-C10 indicate 2-methylpropanoate and n-decanoate, respectively).
Figure 4
Figure 4
Phylogenetic analyses of SpKAR1. A, Maximum-likelihood tree (topology) of SpKAR1 (Sopen05g009610; highlighted) and related SDRs. Red circles indicate plant-specialized metabolic SDRs. Blue squares indicate bacterial sequences. “Sopen” numbers indicate sequences from S. pennellii. Sequences from other species are given with GenBank accession numbers. Black diamonds indicate more than one “Sopen” sequences, which were clustered to save space; complete tree is given in Supplemental Figure S4. Two sequences related to capsaicinoid biosynthesis are indicated by arrows. Bootstrap values from 1,000 replicates are shown on the nodes. B, Similarity between capsaicinoid and acylsugar biosynthetic pathways. Metabolism of leucine, isoleucine, and SCFAs in acylsugar pathway are not shown here. Single arrows do not necessarily indicate single enzymatic steps. Enzymes are in red font. BCAT, branched-chain aminotransferase; BCKDH, branched-chain keto acid dehydrogenase; FAS, fatty acid synthase; PUN1, pungent gene 1; ASAT1, acylsugar acyltransferase 1. C, Neighbor-joining tree of SpKAR1 (highlighted) and its homologs in the Solanaceae. Sequences from four nonsolanaceous plant species [Ipomoea triloba and I. nil (Convolvulaceae); A. thaliana and Brassica napus (Brassicaceae)] and two bacteria (Synechocystis and Escherichia) are also included. Bootstrap values from 1,000 replicates are shown. Tree is drawn to scale, with branch lengths measured in the number of substitutions per site. Tri110x indicates 110-fold higher expression in isolated trichomes compared to underlying tissues (NF, not found in HN_c64839g1). RT–qPCR was used for “Sopen” sequences. Trichome-enriched expression data (based on RNA-seq) for sequences in five other species were obtained from Ning et al. (2015) (Solyc, S. lycopersicum) and Moghe et al. (2017) (SN, S. nigrum; SQ, S. quitoense; HN. H. niger; SS, S. sinuata). Peaxi. P. axillaris. Sopen03g030230 (138 aa) and its putative orthologs were not included because they have long deletions and insertions. Maximum-likelihood tree is given in Supplemental Figure S5.
Figure 5
Figure 5
Phylogenetic analysis of SpRBCS1 (Sopen07g006810; highlighted). Bootstrap values from 1,000 replicates are shown on the nodes. Trees are drawn to scale, with branch lengths measured in the number of substitutions per site. A, Maximum-likelihood tree of Rubisco small subunits. Solanaceous sequences were combined into two clusters (indicated by a red circle and a blue square) to save space. Neighbor-joining tree is given in Supplemental Figure S8. Os, O. sativa; AT, A. thaliana. GenBank accession numbers are indicated for I. triloba and Microcystis aeruginosa. B and C, Expanded Solanaceae “trichome” cluster (B) and expanded Solanaceae “regular” cluster (C). Tri220x indicates 220-fold higher expression in isolated trichomes compared to underlying tissues (NF, not found). RT-qPCR was used for S. pennellii (Sopen) sequences. Trichome-enriched expression data (based on RNA-seq) for sequences in five other species were obtained from Ning et al. (2015) (Solyc, S. lycopersicum) and Moghe et al. (2017) (SN, S. nigrum; SQ, S. quitoense; HN, H. niger; SS, S. sinuata). Peaxi, P. axillaris; CA, C. annuum; Nt, N. tabacum.
Figure 6
Figure 6
δ13C analyses. A, Difference in δ13C values between shaved stems and secreted acylsugars. Error bars indicate Se (n = 10 individual plants; ****P < 0.0001; Welch t test). B, VIGS of SpRBCS1 reduces the difference in δ13C values between shaved stems and acylsugars. Error bars indicate Se (n = 5 and 10 individual plants for control and VIGS-RBCS1 groups, respectively; ***P < 0.001; Welch t test).

References

    1. Alba JM, Montserrat M, Fernandez-Munoz R (2009) Resistance to the two-spotted spider mite (Tetranychus urticae) by acylsucroses of wild tomato (Solanum pimpinellifolium) trichomes studied in a recombinant inbred line population. Exp Appl Acarol 47: 35–47 - PubMed
    1. Anders S, Pyl PT, Huber W (2015) HTSeq-a Python framework to work with high-throughput sequencing data. Bioinformatics 31: 166–169 - PMC - PubMed
    1. Asai T, Hara N, Fujimoto Y (2010) Fatty acid derivatives and dammarane triterpenes from the glandular trichome exudates of Ibicella lutea and Proboscidea louisiana. Phytochemistry 71: 877–894 - PubMed
    1. Asai T, Nakamura Y, Hirayama Y, Ohyama K, Fujimoto Y (2012) Cyclic glycolipids from glandular trichome exudates of Cerastium glomeratum. Phytochemistry 82: 149–157 - PubMed
    1. Balcke GU, Bennewitz S, Bergau N, Athmer B, Henning A, Majovsky P, Jiménez-Gómez JM, Hoehenwarter W, Tissier A (2017) Multi-omics of tomato glandular trichomes reveals distinct features of central carbon metabolism supporting high productivity of specialized metabolites. Plant Cell 29: 960–983 - PMC - PubMed

Publication types

Substances