. 2023 Jan 9;13(1):146-169.
doi: 10.1158/2159-8290.CD-22-0416.

A Molecular Switch between Mammalian MLL Complexes Dictates Response to Menin-MLL Inhibition

Affiliations

A Molecular Switch between Mammalian MLL Complexes Dictates Response to Menin-MLL Inhibition

Yadira M Soto-Feliciano et al. Cancer Discov. .

Abstract

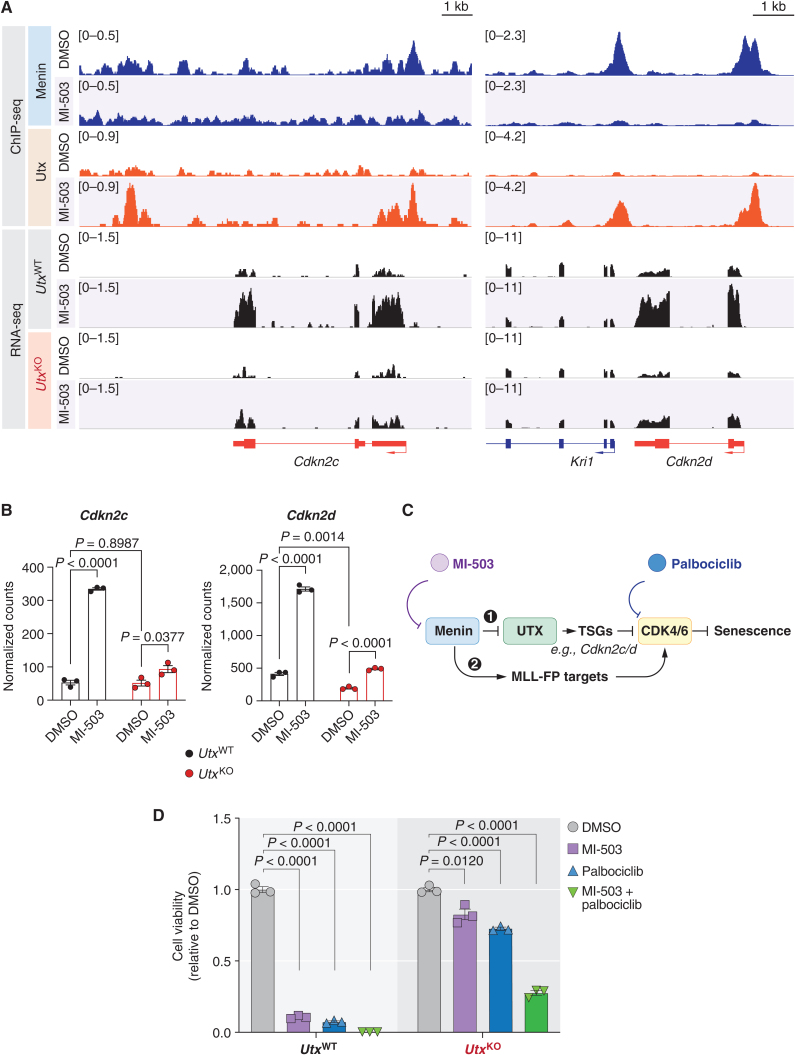
Menin interacts with oncogenic MLL1-fusion proteins, and small molecules that disrupt these associations are in clinical trials for leukemia treatment. By integrating chromatin-focused and genome-wide CRISPR screens with genetic, pharmacologic, and biochemical approaches, we discovered a conserved molecular switch between the MLL1-Menin and MLL3/4-UTX chromatin-modifying complexes that dictates response to Menin-MLL inhibitors. MLL1-Menin safeguards leukemia survival by impeding the binding of the MLL3/4-UTX complex at a subset of target gene promoters. Disrupting the Menin-MLL1 interaction triggers UTX-dependent transcriptional activation of a tumor-suppressive program that dictates therapeutic responses in murine and human leukemia. Therapeutic reactivation of this program using CDK4/6 inhibitors mitigates treatment resistance in leukemia cells that are insensitive to Menin inhibitors. These findings shed light on novel functions of evolutionarily conserved epigenetic mediators like MLL1-Menin and MLL3/4-UTX and are relevant to understand and target molecular pathways determining therapeutic responses in ongoing clinical trials.

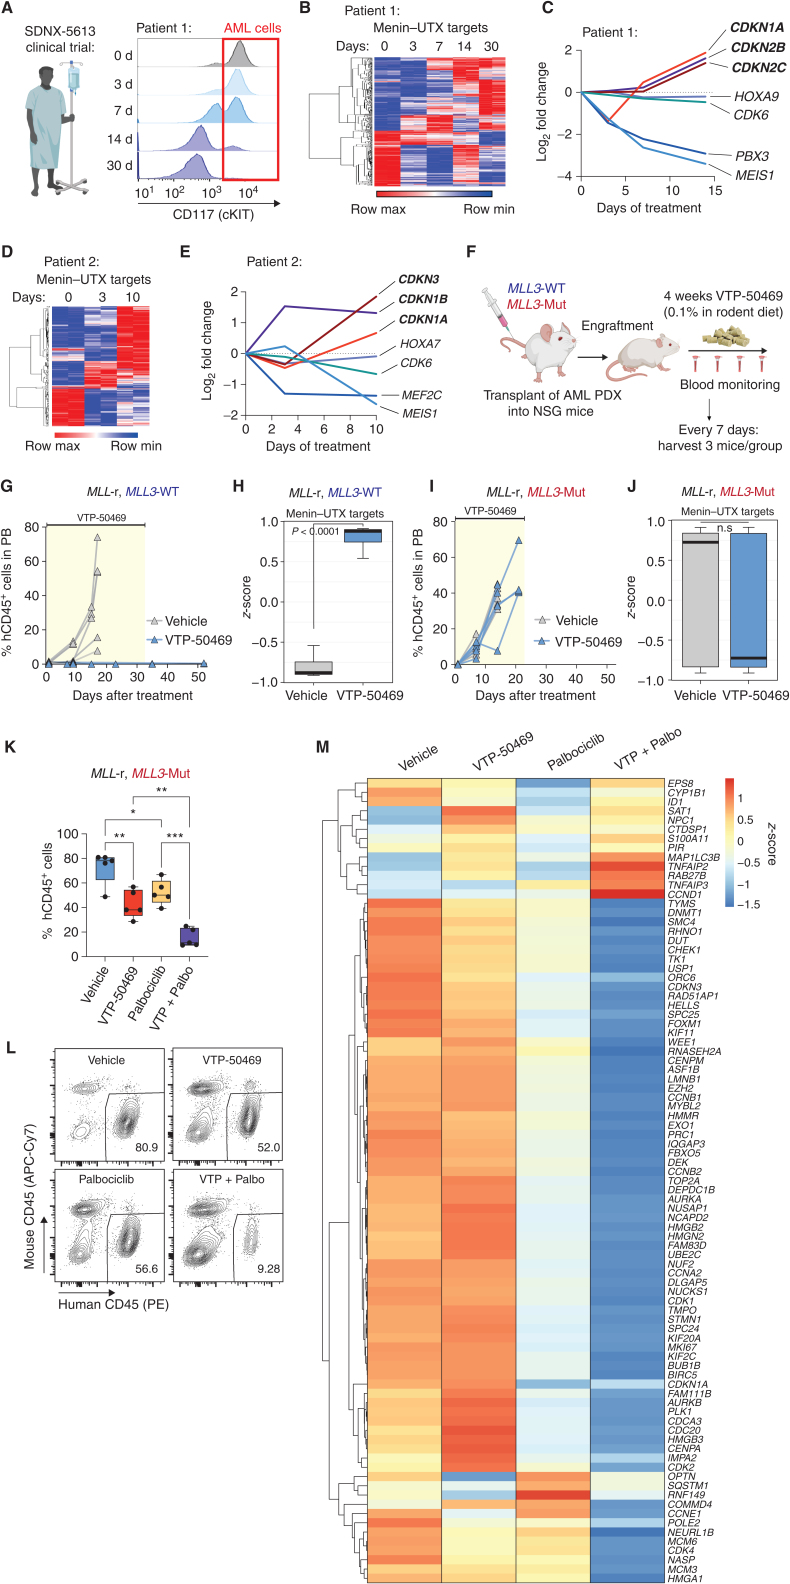
Significance: Menin-MLL inhibitors silence a canonical HOX- and MEIS1-dependent oncogenic gene expression program in leukemia. We discovered a parallel, noncanonical transcriptional program involving tumor suppressor genes that are repressed in Menin-MLL inhibitor-resistant leukemia cells but that can be reactivated upon combinatorial treatment with CDK4/6 inhibitors to augment therapy responses. This article is highlighted in the In This Issue feature, p. 1.


Figures

Figure 1. CRISPR screens uncover the functional interplay between the mammalian MLL1 and MLL3/4 chromatin-modifying complexes. A, CRISPR-Cas9–based screening strategy to identify regulators of response to Menin-MLL inhibition. CPD, cell population doublings; sgRNA, single guide RNA; Tf, final time point; T0, initial time point. B, Chromatin-focused CRISPR screening data showing the top 20 most significantly enriched (red) and depleted (blue) genes in the Menin-MLL inhibitor (MI-503) treatment relative to vehicle (DMSO). Gene scores are shown as the mean log2 fold change in abundance of the 6 sgRNAs targeting each gene in each condition. C, Genome-wide CRISPR screening data showing gene-level ranking based on differential enrichment of sgRNAs in the Menin-MLL inhibitor treatment (VTP-50469) relative to vehicle (DMSO). Differential (Δ) beta-score between VTP-50469 and DMSO conditions was calculated using MaGeCK. A positive Δ beta-score denotes enrichment of specific gene-targeting sgRNAs. A negative Δ beta-score denotes depletion of specific gene-targeting sgRNAs. Red circles denote MLL3/4-UTX complex subunits. Yellow circles denote PRC1.1 complex subunits. D, Schematic representation of the top-scoring chromatin regulators in the chromatin-focused MI-503 screen and their corresponding protein complexes. Red denotes enriched subunits. Blue denotes depleted subunits. Color scale represents the log2 fold change in abundance of the 6 sgRNAs targeting each subunit in the Menin-MLL inhibitor (MI-503) treatment relative to vehicle (DMSO). E, Viability assay from cells treated with vehicle (DMSO, black) or Menin-MLL inhibitor (MI-503, red) for 96 hours (mean ± SEM, n = 3 infection replicates, P value calculated by Student t test). sgCtrl, control sgRNA targeting a nongenic region on chromosome 8. F, Relative cell proliferation is shown as the proliferation of double-positive cells (sgMen1-RFP + sgUtx-BFP or sgMen1-RFP + sgCtrl-BFP) relative to single-positive cells (sgMen1-RFP) 16 days after infection measured by flow cytometry (mean ± SEM, n = 3 infection replicates, P value calculated by Student t test). Representative FACS plots are shown for sgControl- and sgUtx-targeted cells.
Figure 1.
CRISPR screens uncover the functional interplay between the mammalian MLL1 and MLL3/4 chromatin-modifying complexes. A, CRISPR–Cas9-based screening strategy to identify regulators of response to Menin–MLL inhibition. CPD, cell population doublings; sgRNA, single-guide RNA; Tf, final time point; T0, initial time point. B, Chromatin-focused CRISPR screening data showing the top 20 most significantly enriched (red) and depleted (blue) genes in the Menin–MLL inhibitor (MI-503) treatment relative to vehicle (DMSO). Gene scores are shown as the mean log2 fold change in abundance of the 6 sgRNAs targeting each gene in each condition. C, Genome-wide CRISPR screening data showing gene-level ranking based on differential enrichment of sgRNAs in the Menin–MLL inhibitor treatment (VTP-50469) relative to vehicle (DMSO). Differential (Δ) beta-score between VTP-50469 and DMSO conditions was calculated using MaGeCK. A positive Δ beta-score denotes enrichment of specific gene-targeting sgRNAs. A negative Δ beta-score denotes depletion of specific gene-targeting sgRNAs. Red circles denote MLL3/4–UTX complex subunits. Yellow circles denote PRC1.1 complex subunits. D, Schematic representation of the top-scoring chromatin regulators in the chromatin-focused MI-503 screen and their corresponding protein complexes. Red denotes enriched subunits. Blue denotes depleted subunits. Color scale represents the log2 fold change in abundance of the 6 sgRNAs targeting each subunit in the Menin–MLL inhibitor (MI-503) treatment relative to vehicle (DMSO).E, Viability assay from cells treated with vehicle (DMSO, black) or Menin–MLL inhibitor (MI-503, red) for 96 hours (mean ± SEM, n = 3 infection replicates, P values calculated by Student t test). sgCtrl, control sgRNA targeting a nongenic region on chromosome 8. F, Relative cell proliferation is shown as the proliferation of double-positive cells (sgMen1-RFP + sgUtx-BFP or sgMen1-RFP + sgCtrl-BFP) relative to single-positive cells (sgMen1-RFP) 16 days after infection measured by flow cytometry (mean ± SEM, n = 3 infection replicates, P values calculated by Student t test). Representative FACS plots are shown for sgControl- and sgUtx-targeted cells.
Figure 2. MLL1-Menin complex restricts chromatin occupancy of MLL3/4-UTX at promoters of target genes. A, Metagene analysis showing the average chromatin occupancy of Menin at TSS, and a region 2000 bp downstream and upstream of the TSS. Signals corresponding to cells treated with Menin-MLL inhibitor (MI-503, solid) compared with cells treated with vehicle (DMSO, dotted) for 96 hours are shown. RPM, reads per million. B, Metagene analysis showing the average chromatin occupancy of UTX at TSS, and a region 2,000 bp downstream and upstream of the TSS. Signals corresponding to cells treated with Menin-MLL inhibitor (MI-503, solid) compared with cells treated with vehicle (DMSO, dotted) for 96 hours are shown. RPM, reads per million. C, Relative Utx mRNA levels determined by qPCR in mouse MLL-AF9 leukemia cells treated with Menin-MLL inhibitor (MI-503, red) compared with vehicle (DMSO, black) for 96 hours (mean ± SEM, n = 3 replicates, P value calculated by Student t test). D, Immunoblot analysis of Menin, UTX, and HSP90 proteins (loading control) upon Menin-MLL inhibitor (MI-503) treatment of mouse MLL-AF9 leukemia cells for 96 hours. E, Heat maps displaying Menin (black) and UTX (purple) ChIP-seq signals mapping to a 4-kb window around TSS. Data are shown for DMSO and MI-503–treated cells for 96 hours. Metagene plot shows the average ChIP-seq signal for Menin or UTX at promoters that are UTX+ (green) or UTX− (black) post MI-503 treatment. F, Genome browser representation of ChIP-seq normalized reads for Menin (black) and UTX (purple) in mouse MLL-AF9 leukemia cells treated with either vehicle (DMSO) or Menin-MLL inhibitor (MI-503) for 96 hours.
Figure 2.
MLL1–Menin complex restricts chromatin occupancy of MLL3/4–UTX at promoters of target genes. A, Metagene analysis showing the average chromatin occupancy of Menin at the TSS, and a region 2,000 bp downstream and upstream of the TSS. Signals corresponding to cells treated with a Menin–MLL inhibitor (MI-503, solid) compared with cells treated with vehicle (DMSO, dotted) for 96 hours are shown. RPM, reads per million. B, Metagene analysis showing the average chromatin occupancy of UTX at the TSS, and a region 2,000 bp downstream and upstream of the TSS. Signals corresponding to cells treated with a Menin–MLL inhibitor (MI-503, solid) compared with cells treated with vehicle (DMSO, dotted) for 96 hours are shown. C, Relative Utx mRNA levels determined by qPCR in mouse MLL-AF9 leukemia cells treated with a Menin–MLL inhibitor (MI-503, red) compared with vehicle (DMSO, black) for 96 hours (mean ± SEM, n = 3 replicates, P value calculated by Student t test). D, Immunoblot analysis of Menin, UTX, and HSP90 proteins (loading control) upon Menin–MLL inhibitor (MI-503) treatment of mouse MLL-AF9 leukemia cells for 96 hours. E, Heat maps displaying Menin (black) and UTX (purple) ChIP-seq signals mapping to a 4-kb window around the TSS. Data are shown for DMSO and MI-503–treated cells for 96 hours. Metagene plot shows the average ChIP-seq signal for Menin or UTX at promoters that are UTX+ (green) or UTX (black) after MI-503 treatment. F, Genome browser representation of ChIP-seq normalized reads for Menin (black) and UTX (purple) in mouse MLL-AF9 leukemia cells treated with either vehicle (DMSO) or a Menin–MLL inhibitor (MI-503) for 96 hours.
Figure 3. NF-YA contributes to genomic specificity of the Menin-UTX molecular switch on chromatin. A, HOMER de novo motif analysis of overlapping ChIP-seq peaks between Menin (in DMSO) and UTX (in MI-503) in mouse MLL-AF9 leukemia cells. B, Genome browser representation of ChIP-seq–normalized reads (average RPKM) for representative loci bound by Menin (black), UTX (purple), and NF-YA (red) in cells treated with vehicle (DMSO) or Menin-MLL inhibitor (MI-503) for 96 hours. C, Immunoblot analysis of NF-YA and HSP90 proteins (loading control) upon Menin-MLL inhibitor (MI-503) treatment of mouse MLL-AF9 leukemia cells for 96 hours. D, Viability assay from cells treated with vehicle (DMSO, black) or Menin-MLL inhibitor (MI-503, red) for 96 hours (mean ± SEM, n = 3 infection replicates, P value calculated by Student t test). sgCtrl, control sgRNA targeting a nongenic region on chromosome 8. E, Heat maps displaying UTX ChIP-seq signal mapping to a 4-kb window around TSS in NfyaWT (red) or NfyaKO (black) mouse MLL-AF9 leukemia cells treated with vehicle (DMSO) or Menin-MLL inhibitor (MI-503) for 96 hours. Metaplot represents the average UTX ChIP-seq signal at promoters.
Figure 3.
NF-YA contributes to genomic specificity of the Menin–UTX molecular switch on chromatin. A, HOMER de novo motif analysis of overlapping ChIP-seq peaks between Menin (in DMSO) and UTX (in MI-503) in mouse MLL-AF9 leukemia cells. B, Genome browser representation of ChIP-seq normalized reads [average reads per kilobase per million mapped reads (RPKM)] for representative loci bound by Menin (black), UTX (purple), and NF-YA (red) in cells treated with vehicle (DMSO) or a Menin–MLL inhibitor (MI-503) for 96 hours. C, Immunoblot analysis of NF-YA and HSP90 proteins (loading control) upon Menin–MLL inhibitor (MI-503) treatment of mouse MLL-AF9 leukemia cells for 96 hours. D, Viability assay from cells treated with vehicle (DMSO, black) or a Menin–MLL inhibitor (MI-503, red) for 96 hours (mean ± SEM, n = 3 infection replicates, P values calculated by Student t test). sgCtrl, control sgRNA targeting a nongenic region on chromosome 8. E, Heat maps displaying UTX ChIP-seq signal mapping to a 4-kb window around the TSS in NfyaWT (red) or NfyaKO (black) mouse MLL-AF9 leukemia cells treated with vehicle (DMSO) or a Menin–MLL inhibitor (MI-503) for 96 hours. Metaplot represents the average UTX ChIP-seq signal at promoters.
Figure 4. Transcriptional coregulation of tumor-suppressive pathways by the Menin–UTX switch. A, Volcano plot of differentially expressed genes in mouse MLL-AF9 leukemia cells treated with Menin inhibitor (MI-503) or vehicle (DMSO) for 96 hours. Significantly (P < 0.05) downregulated (DN) genes are shown on the left (n = 921 genes). Significantly (P < 0.05) upregulated (UP) genes are shown on the right (n = 1,030). B, Upset plot showing significant overlap (red) between genes that undergo replacement of Menin by UTX at their promoters and MI-503–induced genes. P value for overlap is shown. C, Boxplot showing expression levels of genes that are induced by Menin-MLL inhibitor (MI-503) treatment and are bound by UTX at their promoters in this condition and by Menin at steady state. Expression levels are shown for UtxWT and UtxKO leukemia cells. The midline in boxplots represents median. P value for MI-503 comparison is shown. D, GSEA showing that Menin–UTX targets induced by Menin-MLL inhibitor (MI-503) are significantly enriched for genes regulating cellular senescence. FDR, false discovery rate; NES, normalized enrichment score. E, Heat map showing relative gene-expression levels of senescence-associated cell-cycle and SASP genes in mouse UtxWT and UtxKO MLL-AF9 leukemia cells treated with Menin-MLL inhibitor (MI-503) or vehicle (DMSO) for 96 hours. F and G, Secreted levels of IL6 and IFNβ-1 in conditioned media derived from mouse UtxWT (black) and UtxKO (red) MLL-AF9 leukemia cells treated with Menin-MLL inhibitor (MI-503) or vehicle (DMSO) for 4 or 6 days. Data are quantified as pg/mL of secreted cytokine per million cells. Data are quantified as pg/mL of secreted cytokine per million cells (mean ± SEM, n = 3 replicates, P value calculated by Student t test).
Figure 4.
Transcriptional coregulation of tumor-suppressive pathways by the Menin–UTX switch. A, Volcano plot of differentially expressed genes in mouse MLL-AF9 leukemia cells treated with a Menin–MLL inhibitor (MI-503) or vehicle (DMSO) for 96 hours. Significantly (P < 0.05) downregulated (DN) genes are shown on the left (n = 921 genes). Significantly (P < 0.05) upregulated (UP) genes are shown on the right (n = 1,030). B, Upset plot showing significant overlap (red) between genes that undergo replacement of Menin by UTX at their promoters and MI-503–induced genes. P value for overlap is shown. C, Box plot showing expression levels of genes that are induced by Menin–MLL inhibitor (MI-503) treatment and are bound by UTX at their promoters in this condition and by Menin at steady state. Expression levels are shown for UtxWT and UtxKO leukemia cells. The midline in box plots represents median. P value for MI-503 comparison is shown. D, GSEA showing that a Menin–UTX targets induced by a Menin–MLL inhibitor (MI-503) are significantly enriched for genes regulating cellular senescence. FDR, false discovery rate; NES, normalized enrichment score.E, Heat map showing relative gene expression levels of senescence-associated cell-cycle and senescence-associated secretory phenotype (SASP) genes in mouse UtxWT and UtxKO MLL-AF9 leukemia cells treated with a Menin–MLL inhibitor (MI-503) or vehicle (DMSO) for 96 hours. F and G, Secreted levels of IL6 and IFNβ-1 in conditioned media derived from mouse UtxWT (black) and UtxKO (red) MLL-AF9 leukemia cells treated with a Menin–MLL inhibitor (MI-503) or vehicle (DMSO) for 4 or 6 days. Data are quantified as pg/mL of secreted cytokine per million cells (mean ± SEM, n = 3 replicates, P values calculated by Student t test).
Figure 5. Enzymatic domain of UTX is dispensable for its tumor-suppressive functions in response to Menin-MLL inhibition. A, Schematic of UTX protein. Highlighted are the 8 tetratricopeptide repeats (TPR; 93–385 aa) and the histone demethylase (JmjC) domain (1,095–1,258aa). Three ∼500 amino acid long truncations are also represented. B, Growth competition assay in mouse UtxKO MLL-AF9 leukemia cells expressing different RFP-tagged Utx cDNAs and treated with Menin-MLL inhibitor (MI-503) for 2 or 6 days. The graph shows the relative growth of leukemia cells infected with RFP-tagged Utx cDNAs measured by flow cytometry (mean ± SEM, n = 3 infection replicates, P value calculated by Student t test). C, Principal component analysis (PCA) of gene-expression data from UtxKO MLL-AF9 leukemia cells expressing different RFP-tagged Utx cDNAs and treated with vehicle (DMSO) or Menin-MLL inhibitor (MI-503) for 96 hours. D, Cdkn2c expression (mean normalized read counts) from different Utx truncations in mouse MLL-AF9 leukemia and treated with vehicle (DMSO) or Menin-MLL (MI-503) for 96 hours (mean ± SEM, n = 3 replicates, P value calculated by Student t test).
Figure 5.
Enzymatic domain of UTX is dispensable for its tumor-suppressive functions in response to Menin–MLL inhibition. A, Schematic of UTX protein. Highlighted are the 8 tetratricopeptide repeats (TPR; 93–385 aa) and the histone demethylase (JmjC) domain (1,095–1,258aa). Three ∼500 amino-acid-long truncations are also represented. B, Growth competition assay in mouse UtxKO MLL-AF9 leukemia cells expressing different RFP-tagged Utx cDNAs and treated with Menin–MLL inhibitor (MI-503) for 2 or 6 days. The graph shows the relative growth of leukemia cells infected with RFP-tagged Utx cDNAs measured by flow cytometry (mean ± SEM, n = 3 infection replicates, P values calculated by Student t test). C, Principal component analysis (PCA) of gene expression data from UtxKO MLL-AF9 leukemia cells expressing different RFP-tagged Utx cDNAs and treated with vehicle (DMSO) or Menin–MLL inhibitor (MI-503) for 96 hours. D,Cdkn2c expression (mean normalized read counts) from different Utx truncations in mouse MLL-AF9 leukemia cells treated with vehicle (DMSO) or a Menin–MLL inhibitor (MI-503) for 96 hours (mean ± SEM, n = 3 replicates, P values calculated by Student t test).
Figure 6. Combinatorial targeting of Menin and CDK4/6 overcomes resistance associated with MLL3/4 dysfunction. A, Genome browser representation of ChIP-seq (top) and RNA-seq (bottom) normalized reads (average RPKM) for Cdkn2c and Cdkn2d loci from mouse UtxWT or UtxKO MLL-AF9 leukemia cells treated with vehicle (DMSO) or Menin-MLL inhibitor (MI-503) for 96 hours. B, Cdkn2c and Cdkn2d expression (mean normalized read counts) from mouse UtxWT (black) and UtxKO (red) MLL-AF9 leukemia cells treated with vehicle (DMSO) or Menin-MLL inhibitor (MI-503) for 96 hours (mean ± SEM, n = 3 replicates, P value calculated by Student t test). C, Proposed model and rationale for combination therapies based on Menin-MLL and CDK4/6 inhibitors. Our data support a model whereby (1) Menin restricts UTX-mediated transcriptional activation of tumor suppressor genes, including Cdkn2c and Cdkn2d, which are natural inhibitors of the CDK4 and CDK6 kinases, which in turn inhibit cell-cycle arrest and senescence. Our model predicts that CDK4/6 inhibition using palbociclib should boost the anticancer activity of Menin-MLL inhibitors, which we show induces an MLL3/4-UTX tumor-suppressive axis, by more potently inhibiting these downstream kinases. On the other hand, Menin is known to be required for the activation of MLL-FP targets like Meis1 and Cdk6 itself to sustain leukemia (2). Our model predicts that combination therapies based on Menin-MLL and CDK4/6 inhibitors should act synergistically to suppress leukemia proliferation by potently engaging two parallel pathways that converge on regulation of cell-cycle progression. D, Relative viability of UtxWT and UtxKO MLL-AF9 leukemia cells treated with either vehicle (DMSO), Menin-MLL inhibitor (MI-503), CDK4/6 inhibitor (palbociclib), or a combination of both inhibitors for 6 days (mean ± SEM, n = 3 replicates, P value calculated by Student t test).
Figure 6.
Combinatorial targeting of Menin and CDK4/6 overcomes resistance associated with MLL3/4 dysfunction. A, Genome browser representation of ChIP-seq (top) and RNA-seq (bottom) normalized reads [average reads per kilobase per million mapped reads (RPKM)] for Cdkn2c and Cdkn2d loci from mouse UtxWT or UtxKO MLL-AF9 leukemia cells treated with vehicle (DMSO) or a Menin–MLL inhibitor (MI-503) for 96 hours. B,Cdkn2c and Cdkn2d expression (mean normalized read counts) from mouse UtxWT (black) and UtxKO (red) MLL-AF9 leukemia cells treated with vehicle (DMSO) or a Menin–MLL inhibitor (MI-503) for 96 hours (mean ± SEM, n = 3 replicates, P values calculated by Student t test). C, Proposed model and rationale for combination therapies based on Menin–MLL and CDK4/6 inhibitors. Our data support a model whereby (1) Menin restricts UTX-mediated transcriptional activation of tumor suppressor genes (TSG), including Cdkn2c and Cdkn2d, which are natural inhibitors of the CDK4 and CDK6 kinases, which in turn inhibit cell-cycle arrest and senescence. Our model predicts that CDK4/6 inhibition using palbociclib should boost the anticancer activity of Menin–MLL inhibitors, which we show induces an MLL3/4–UTX tumor-suppressive axis, by more potently inhibiting these downstream kinases. On the other hand, Menin is known to be required for the activation of MLL-FP targets like Meis1 and Cdk6 itself to sustain leukemia (2). Our model predicts that combination therapies based on Menin–MLL and CDK4/6 inhibitors should act synergistically to suppress leukemia proliferation by potently engaging two parallel pathways that converge on regulation of cell-cycle progression. D, Relative viability of UtxWT and UtxKO MLL-AF9 leukemia cells treated with either vehicle (DMSO), a Menin–MLL inhibitor (MI-503), a CDK4/6 inhibitor (palbociclib), or a combination of both inhibitors for 6 days (mean ± SEM, n = 3 replicates, P values calculated by Student t test).
Figure 7. In vivo response to Menin-MLL inhibition is accompanied by induction of MLL3/4-UTX-dependent tumor-suppressive programs. A, Longitudinal flow cytometry analysis showing the fraction of CD45lo, cKIT+ leukemia cells in the peripheral blood of an NPM1c-mutant patient (patient 1) during cycle 1 of Menin-MLL inhibitor (SDNX-5613) treatment as part of the AUGMENT-101 clinical trial (NCT04065399). B, Temporal gene-expression changes for Menin-UTX targets in FACS-sorted leukemia blast cells isolated from patient 1 as part of the AUGMENT-101 clinical trial (NCT04065399). Heat map shows all Menin-UTX targets that are differentially expressed at day 14 vs. day 0 of treatment cycle 1. C, Temporal expression levels of genes involved in cell-cycle arrest and senescence (CDKN1A, CDKN2B, and CDKN2C) and Menin-UTX targets (HOXA9, CDK6, PBX3, and MEIS1) in leukemia blasts cells isolated from patient 1 treated with SDNX-5613. D, Temporal gene-expression changes for Menin-UTX targets in FACS-sorted leukemia blasts cells isolated from patient 2 treated with SDNX-5613 as part of the AUGMENT-101 clinical trial (NCT04065399). Heat map shows all Menin-UTX targets that are differentially expressed at day 10 vs. day 0 of treatment cycle 1. E, Temporal expression levels of genes involved in cell-cycle arrest and senescence (CDKN1A, CDKN1B, and CDKN3) and MLL-FP targets (HOXA7, CDK6, MEF2C, and MEIS1) in leukemia blast cells isolated from patient 2 treated with SDNX-5613. F, Schematic of in vivo treatment experiments using genetically defined acute myeloid leukemia (AML) PDXs. NSG mice were transplanted with either MLL3-WT or MLL3-mutant AML PDXs and, upon disease engraftment, were randomized into Menin-MLL inhibitor (VTP-50469) or normal chow for a duration of four weeks. Disease progression was monitored weekly by bleeding, and AML cells were sorted at 7 days after initiation of treatment using magnetic mouse cell depletion from the bone marrow of animals to perform RNA-seq. G, Disease progression as measured by the percentage of human CD45+ cells in the peripheral blood (PB) of mice harboring MLL3-WT leukemia treated with vehicle (gray) or Menin-MLL inhibitor (VTP-50469, blue). H, Boxplot denoting gene-expression changes of Menin-UTX targets in AML cells isolated from mice harboring MLL3-WT leukemia treated with vehicle (gray) or Menin-MLL inhibitor (VTP-50469, blue). I, Disease progression as measured by the percentage of human CD45+ cells in the PB of mice harboring MLL3-mutant leukemia treated with vehicle (gray) or Menin-MLL inhibitor (VTP-50469, blue). J, Boxplot denoting gene-expression changes of Menin-UTX targets in AML cells isolated from mice harboring MLL3-mutant leukemia treated with vehicle (gray) or Menin-MLL inhibitor (VTP-50469, blue). K, Leukemia burden in the bone marrow of recipient mice transplanted with the MLL3-mutant AML PDX and treated with Menin-MLL inhibitor (VTP-50469), CDK4/6 inhibitor (palbociclib), or the combination of these two inhibitors (measured by % of human CD45+ cells). VTP-50469 was administered via drug-supplemented rodent chow (0.1%) for 10 days, palbociclib was given once daily via intraperitoneal injections (35 mg/kg) for 7 days. L, Representative FACS plots showing the abundance of human leukemia cells in recipient mice from each treatment group. M, Heat map denoting changes in cell-cycle–associated gene-expression signatures in FACS-sorted human leukemia cells isolated from recipient mice transplanted with the MLL3-mutant PDX and treated with VTP-50469, palbociclib, or the combination of these two inhibitors.
Figure 7.
In vivo response to Menin–MLL inhibition is accompanied by induction of MLL3/4–UTX-dependent tumor-suppressive programs. A, Longitudinal flow cytometry analysis showing the fraction of CD45lo, cKIT+ leukemia cells in the peripheral blood of an NPM1c-mutant patient (patient 1) during cycle 1 of Menin–MLL inhibitor (SDNX-5613) treatment as part of the AUGMENT-101 clinical trial (NCT04065399). B, Temporal gene expression changes for Menin–UTX targets in FACS-sorted leukemia blast cells isolated from patient 1 as part of the AUGMENT-101 clinical trial (NCT04065399). Heat map shows all Menin–UTX targets that are differentially expressed at day 14 versus day 0 of treatment cycle 1. C, Temporal expression levels of genes involved in cell-cycle arrest and senescence (CDKN1A, CDKN2B, and CDKN2C) and Menin–UTX targets (HOXA9, CDK6, PBX3, and MEIS1) in leukemia blast cells isolated from patient 1 treated with SDNX-5613. D, Temporal gene expression changes for Menin–UTX targets in FACS-sorted leukemia blast cells isolated from patient 2 treated with SDNX-5613 as part of the AUGMENT-101 clinical trial (NCT04065399). Heat map shows all Menin–UTX targets that are differentially expressed at day 10 versus day 0 of treatment cycle 1. E, Temporal expression levels of genes involved in cell-cycle arrest and senescence (CDKN1A, CDKN1B, and CDKN3) and MLL-FP targets (HOXA7, CDK6, MEF2C, and MEIS1) in leukemia blast cells isolated from patient 2 treated with SDNX-5613. F, Schematic of in vivo treatment experiments using genetically defined AML PDXs. NSG mice were transplanted with either MLL3 wild-type (MLL3-WT) or MLL3-mutant (MLL3-Mut) AML PDXs and, upon disease engraftment, were randomized into Menin–MLL inhibitor (VTP-50469) or normal chow for a duration of 4 weeks. Disease progression was monitored weekly by bleeding, and AML cells were sorted 7 days after initiation of treatment using magnetic mouse cell depletion from the bone marrow of animals to perform RNA-seq. G, Disease progression as measured by the percentage of human CD45+ cells in the peripheral blood (PB) of mice harboring MLL3-WT leukemia treated with vehicle (gray) or a Menin–MLL inhibitor (VTP-50469, blue). H, Box plot denoting gene expression changes of Menin–UTX targets in AML cells isolated from mice harboring MLL3-WT leukemia treated with vehicle (gray) or a Menin–MLL inhibitor (VTP-50469, blue). I, Disease progression as measured by the percentage of human CD45+ cells in the peripheral blood of mice harboring MLL3-mutant leukemia treated with vehicle (gray) or a Menin–MLL inhibitor (VTP-50469, blue). J, Box plot denoting gene expression changes of Menin–UTX targets in AML cells isolated from mice harboring MLL3-mutant leukemia treated with vehicle (gray) or a Menin–MLL inhibitor (VTP-50469, blue). K, Leukemia burden in the bone marrow of recipient mice transplanted with the MLL3-mutant AML PDX and treated with a Menin–MLL inhibitor (VTP-50469), a CDK4/6 inhibitor (palbociclib), or the combination (VTP + Palbo) of these two inhibitors (measured by % of human CD45+ cells). VTP-50469 was administered via drug-supplemented rodent chow (0.1%) for 10 days; palbociclib was given once daily via intraperitoneal injections (35 mg/kg) for 7 days. Vehicle versus VTP-50469, P = 0.002; vehicle versus palbociclib, P = 0.04; VTP-50469 versus combo, P = 0.006; palbociclib versus combo, P = 0.00034. L, Representative FACS plots showing the abundance of human leukemia cells in recipient mice from each treatment group. M, Heat map denoting changes in cell-cycle–associated gene expression signatures in FACS-sorted human leukemia cells isolated from recipient mice transplanted with the MLL3-mutant PDX and treated with VTP-50469, palbociclib, or the combination of these two inhibitors.

Comment in

  • doi: 10.1158/2159-8290.CD-13-1-ITI

References

    1. Guru SC, Goldsmith PK, Burns AL, Marx SJ, Spiegel AM, Collins FS, et al. Menin, the product of the MEN1 gene, is a nuclear protein. Proc Natl Acad Sci U S A 1998;95:1630–4. - PMC - PubMed
    1. Hughes CM, Rozenblatt-Rosen O, Milne TA, Copeland TD, Levine SS, Lee JC, et al. Menin associates with a trithorax family histone methyltransferase complex and with the hoxc8 locus. Mol Cell 2004;13:587–97. - PubMed
    1. Milne TA, Hughes CM, Lloyd R, Yang Z, Rozenblatt-Rosen O, Dou Y, et al. Menin and MLL cooperatively regulate expression of cyclin-dependent kinase inhibitors. Proc Natl Acad Sci U S A 2005;102:749–54. - PMC - PubMed
    1. Yokoyama A, Somervaille TCP, Smith KS, Rozenblatt-Rosen O, Meyerson M, Cleary ML. The menin tumor suppressor protein is an essential oncogenic cofactor for MLL-associated leukemogenesis. Cell 2005;123:207–18. - PubMed
    1. Brès V, Yoshida T, Pickle L, Jones KA. SKIP interacts with c-Myc and Menin to promote HIV-1 Tat transactivation. Mol Cell 2009;36:75–87. - PMC - PubMed

Publication types

Substances