Editorial
. 2023 Jan 9;13(1):216-243.
doi: 10.1158/2159-8290.CD-22-0561.

An Aged/Autoimmune B-cell Program Defines the Early Transformation of Extranodal Lymphomas

Affiliations
Editorial

An Aged/Autoimmune B-cell Program Defines the Early Transformation of Extranodal Lymphomas

Leandro Venturutti et al. Cancer Discov. .

Abstract

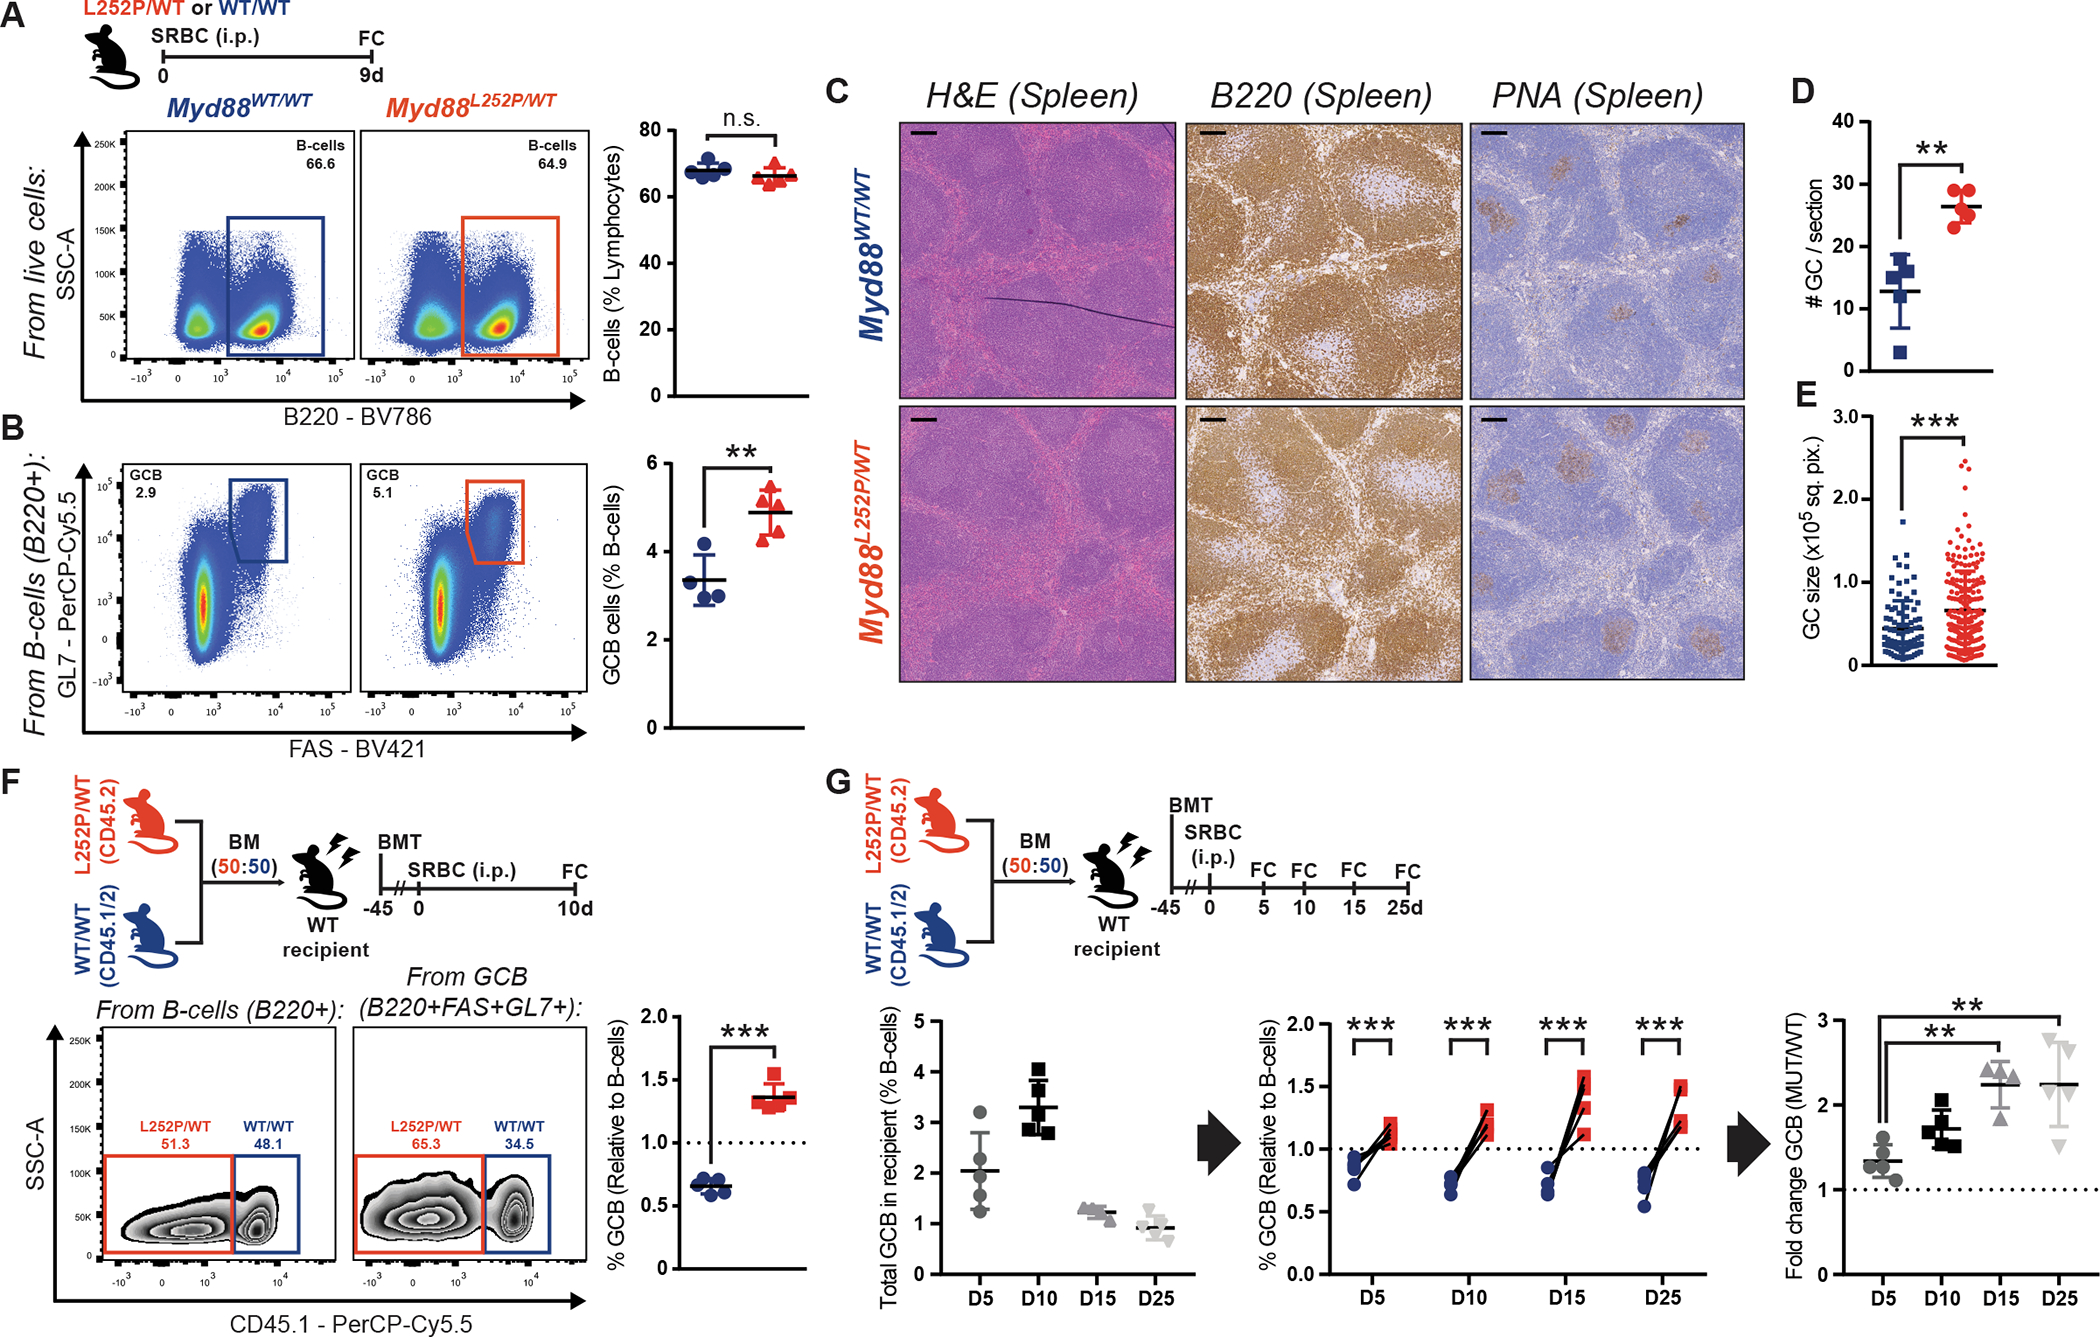
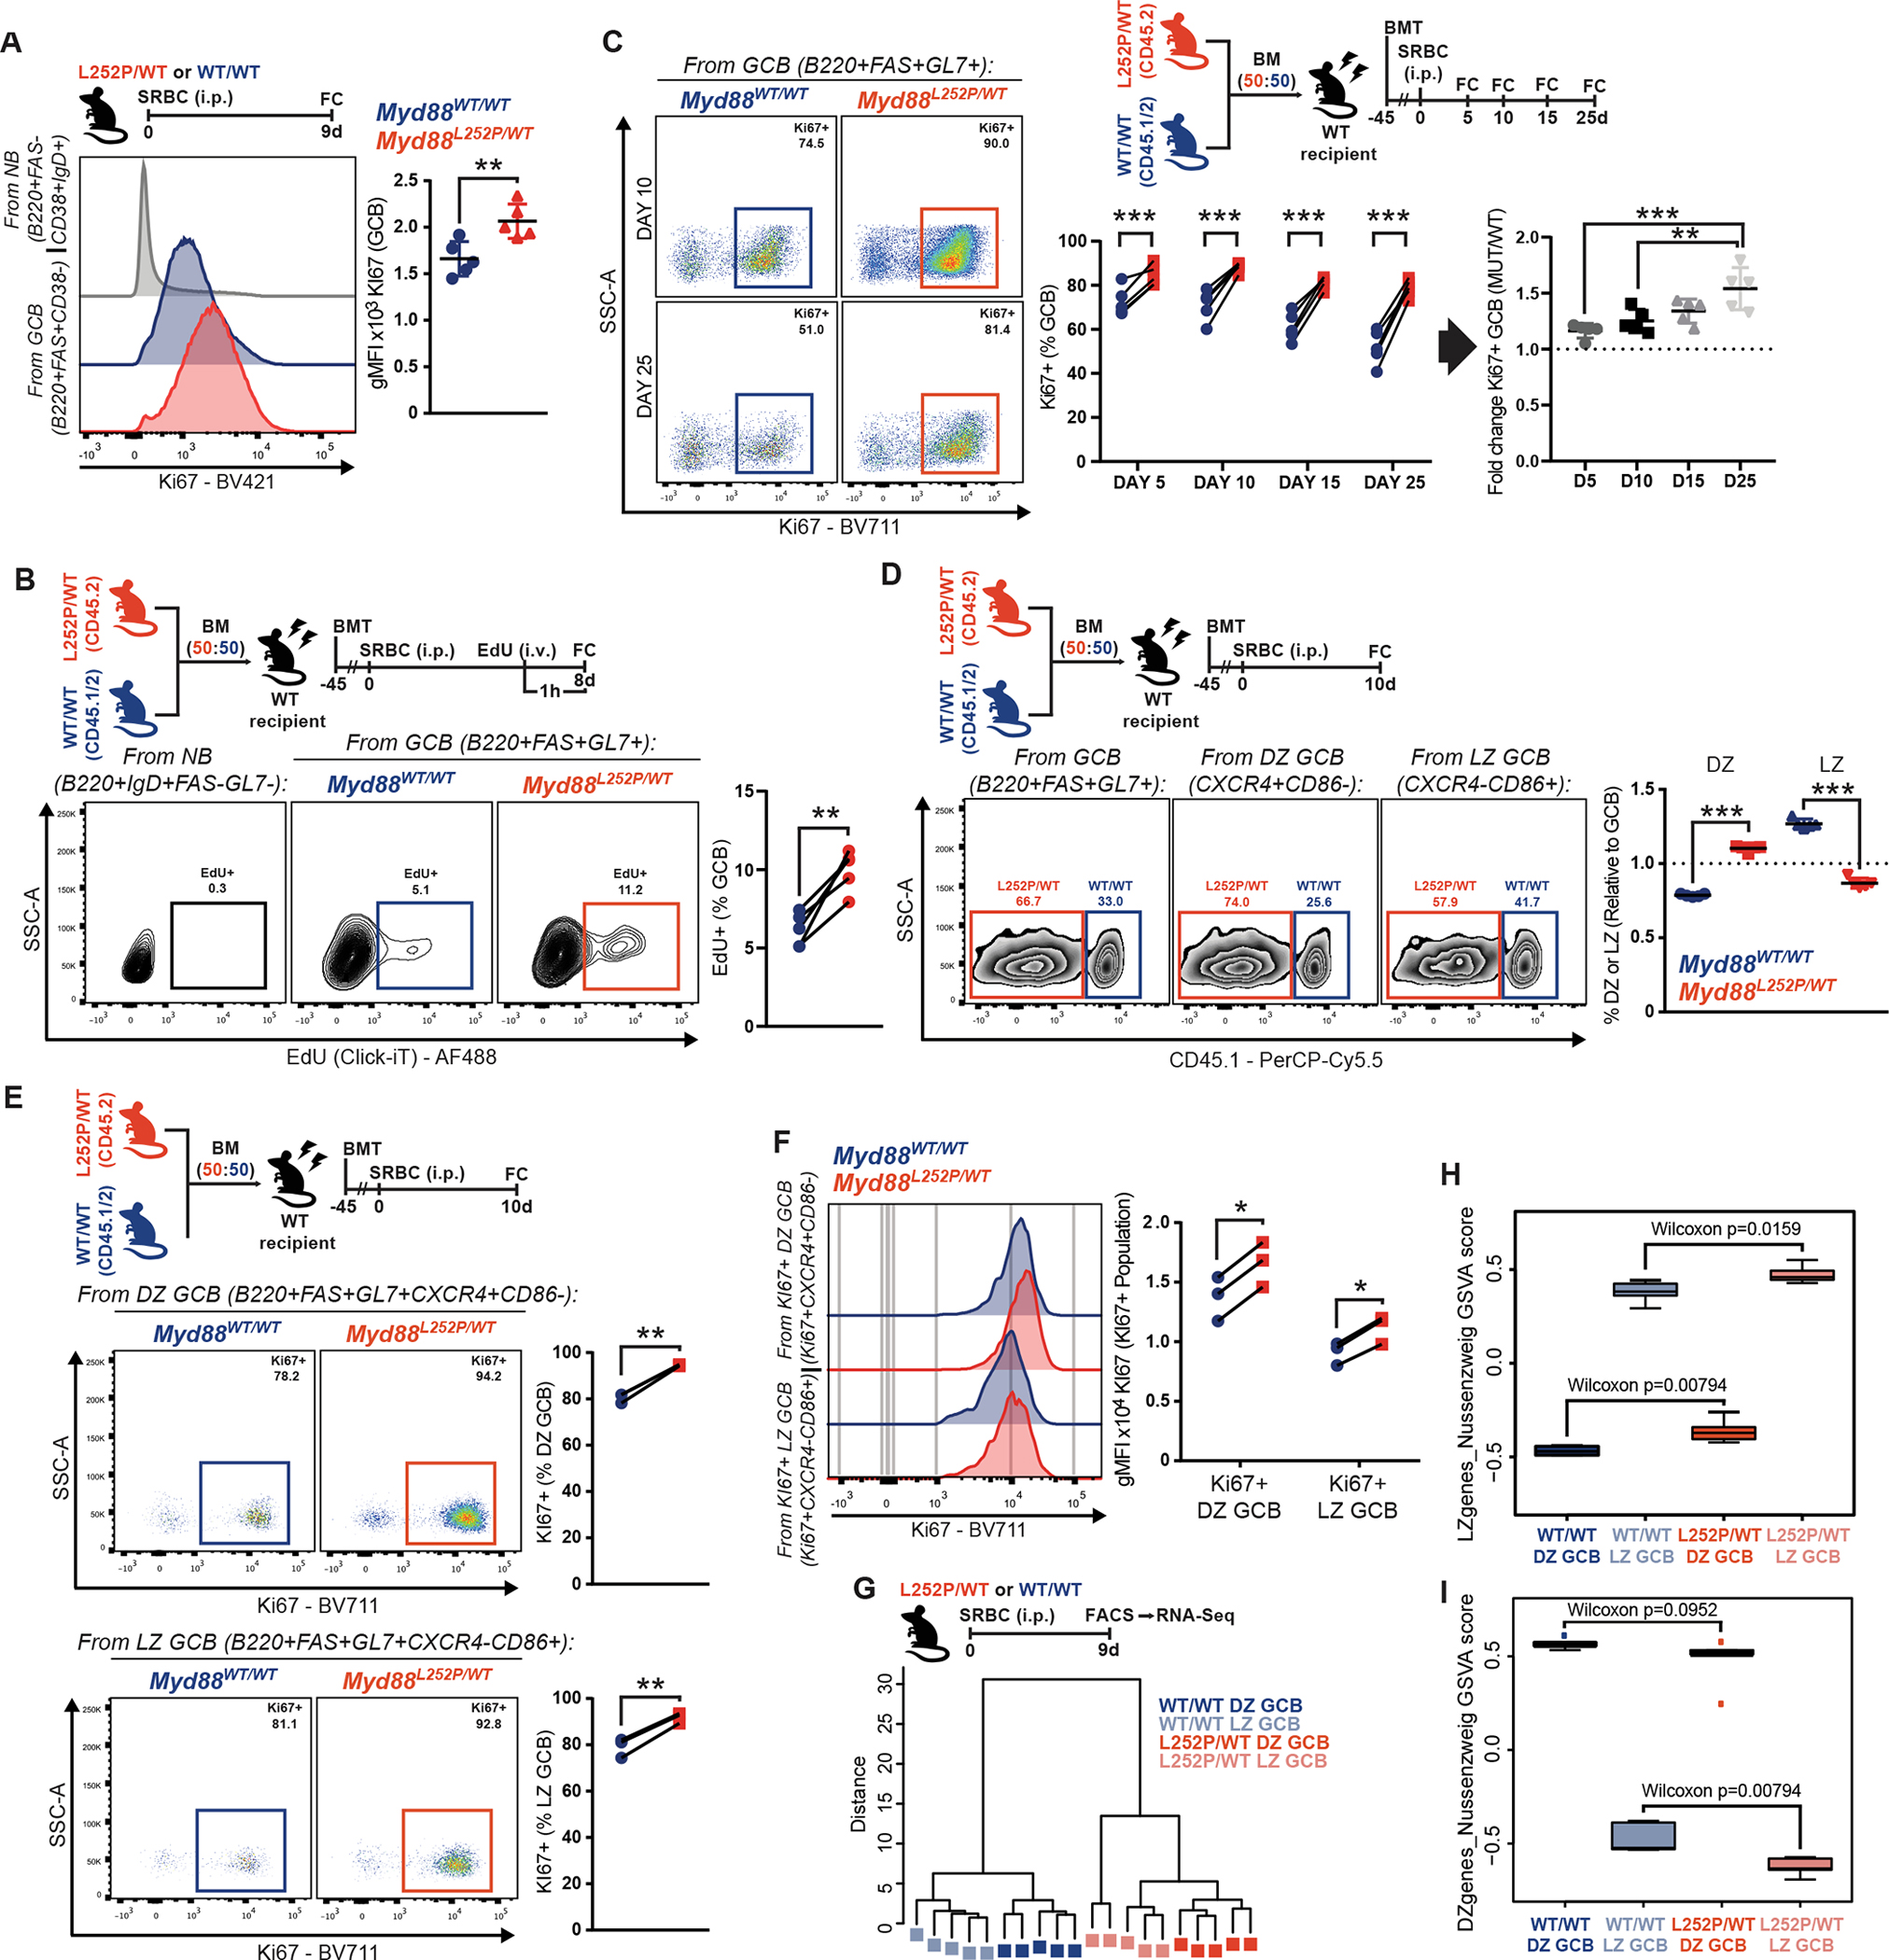
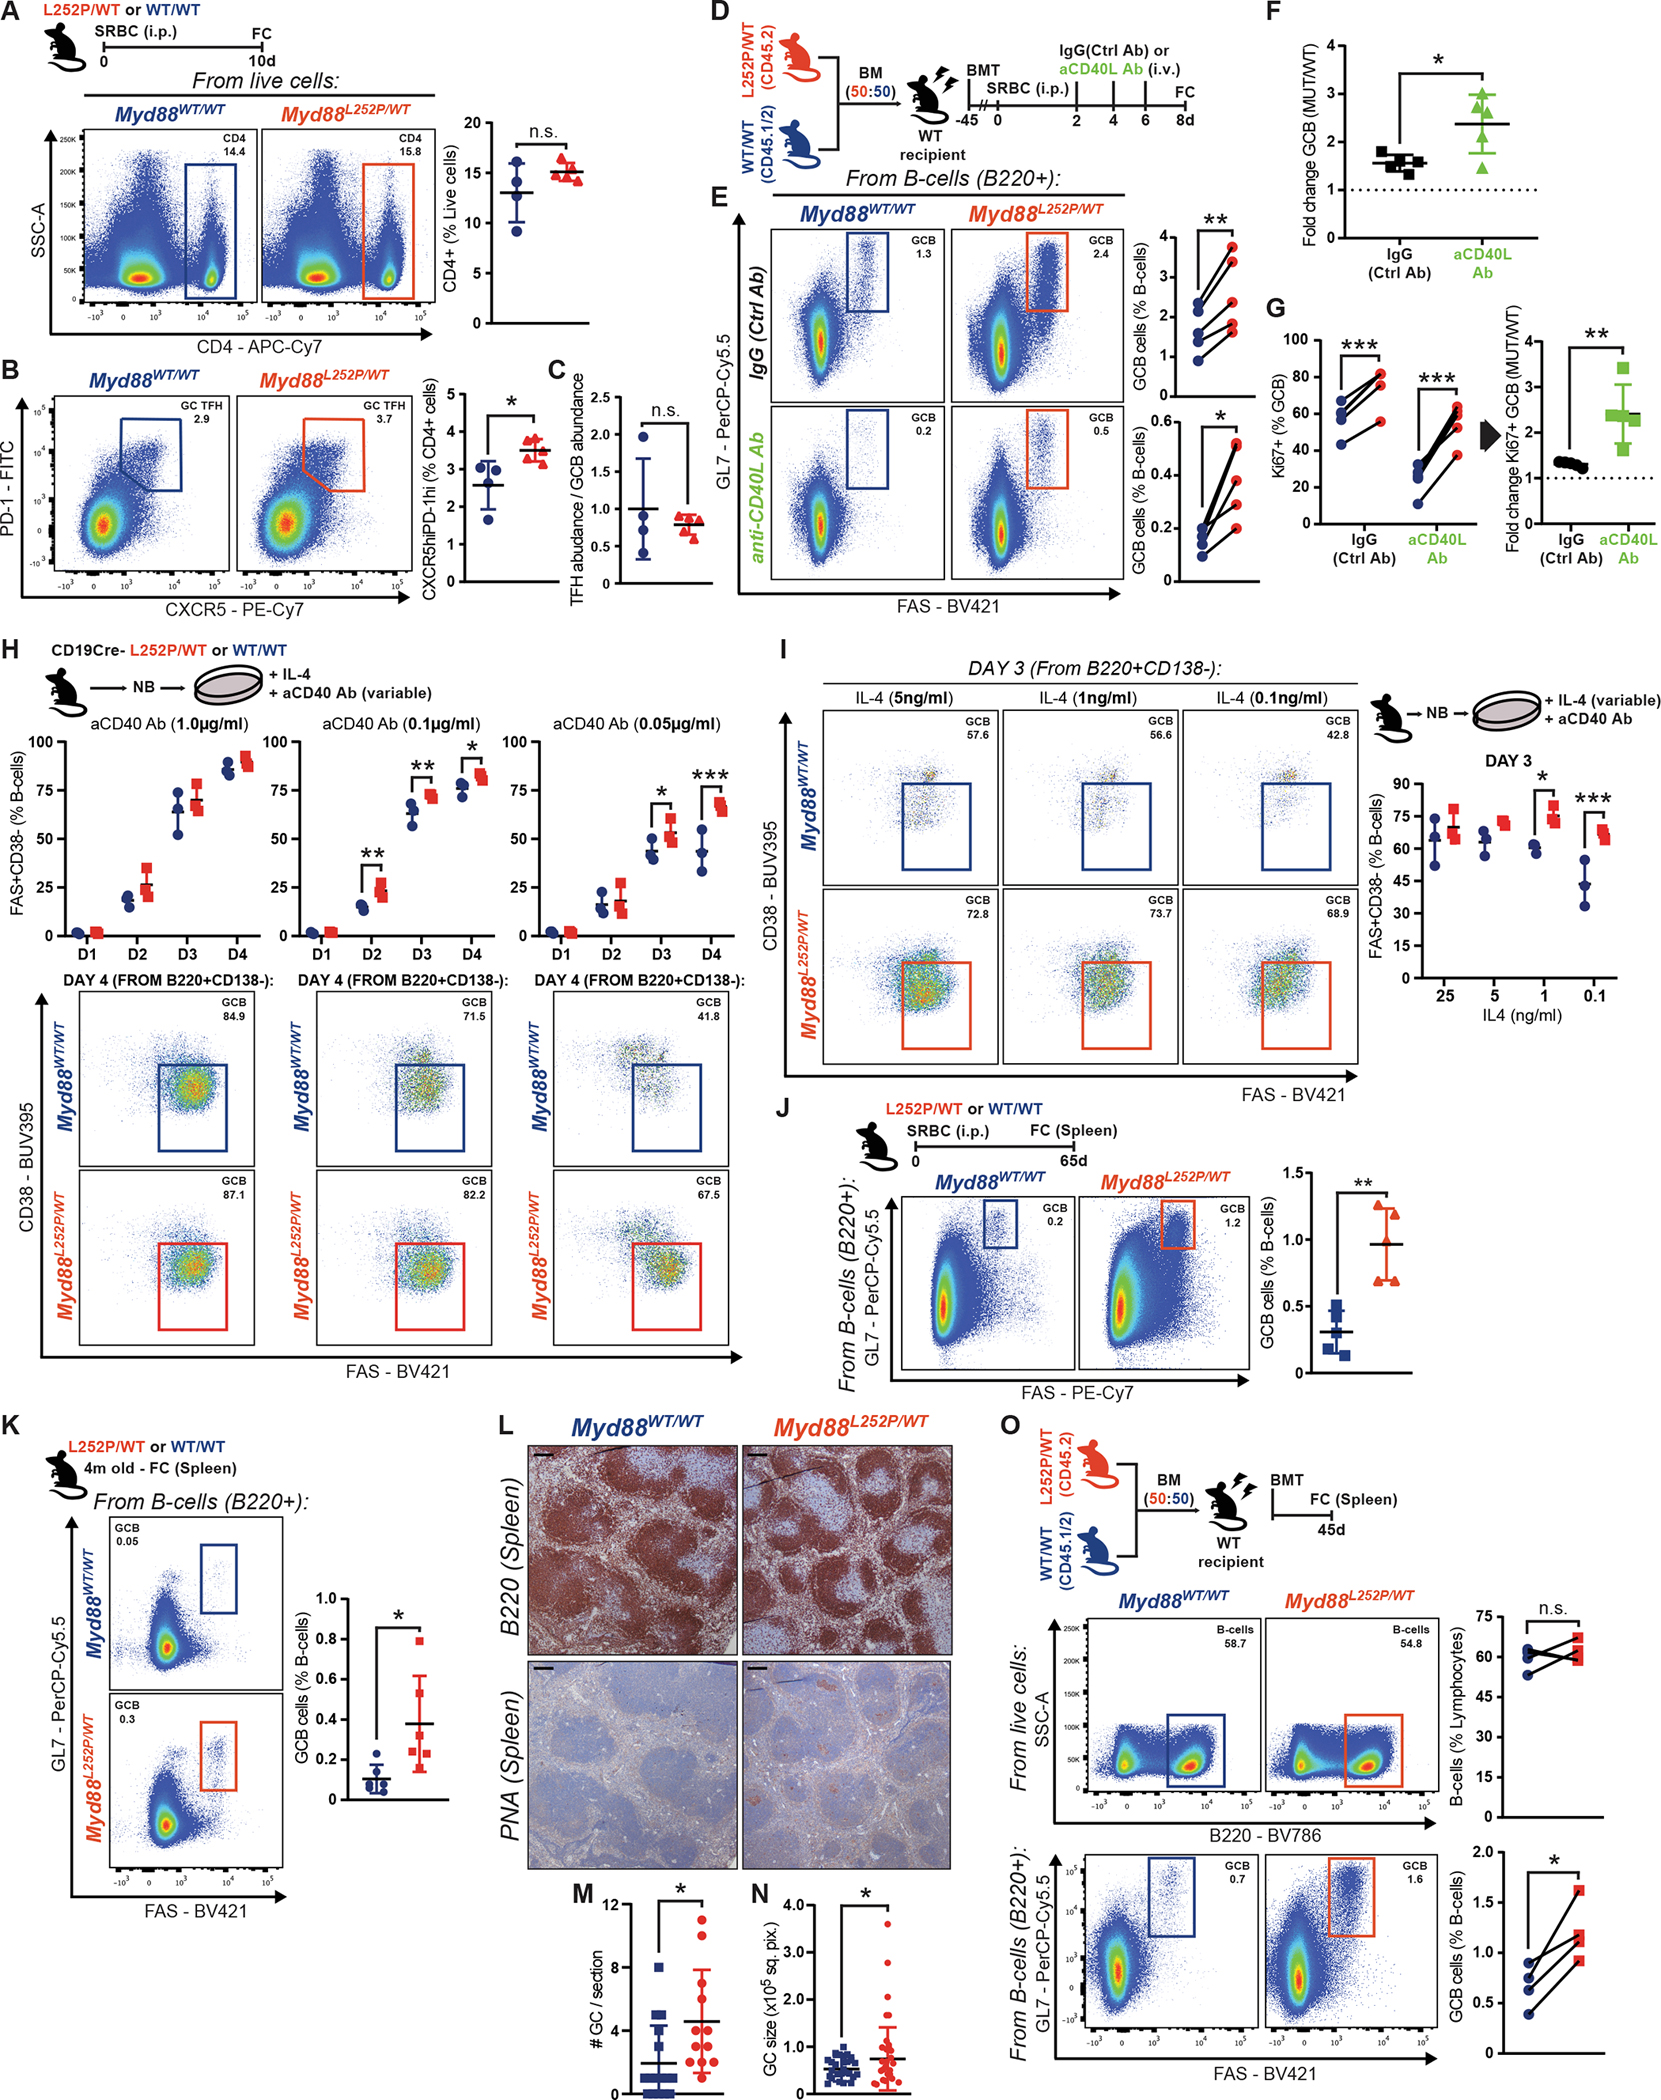
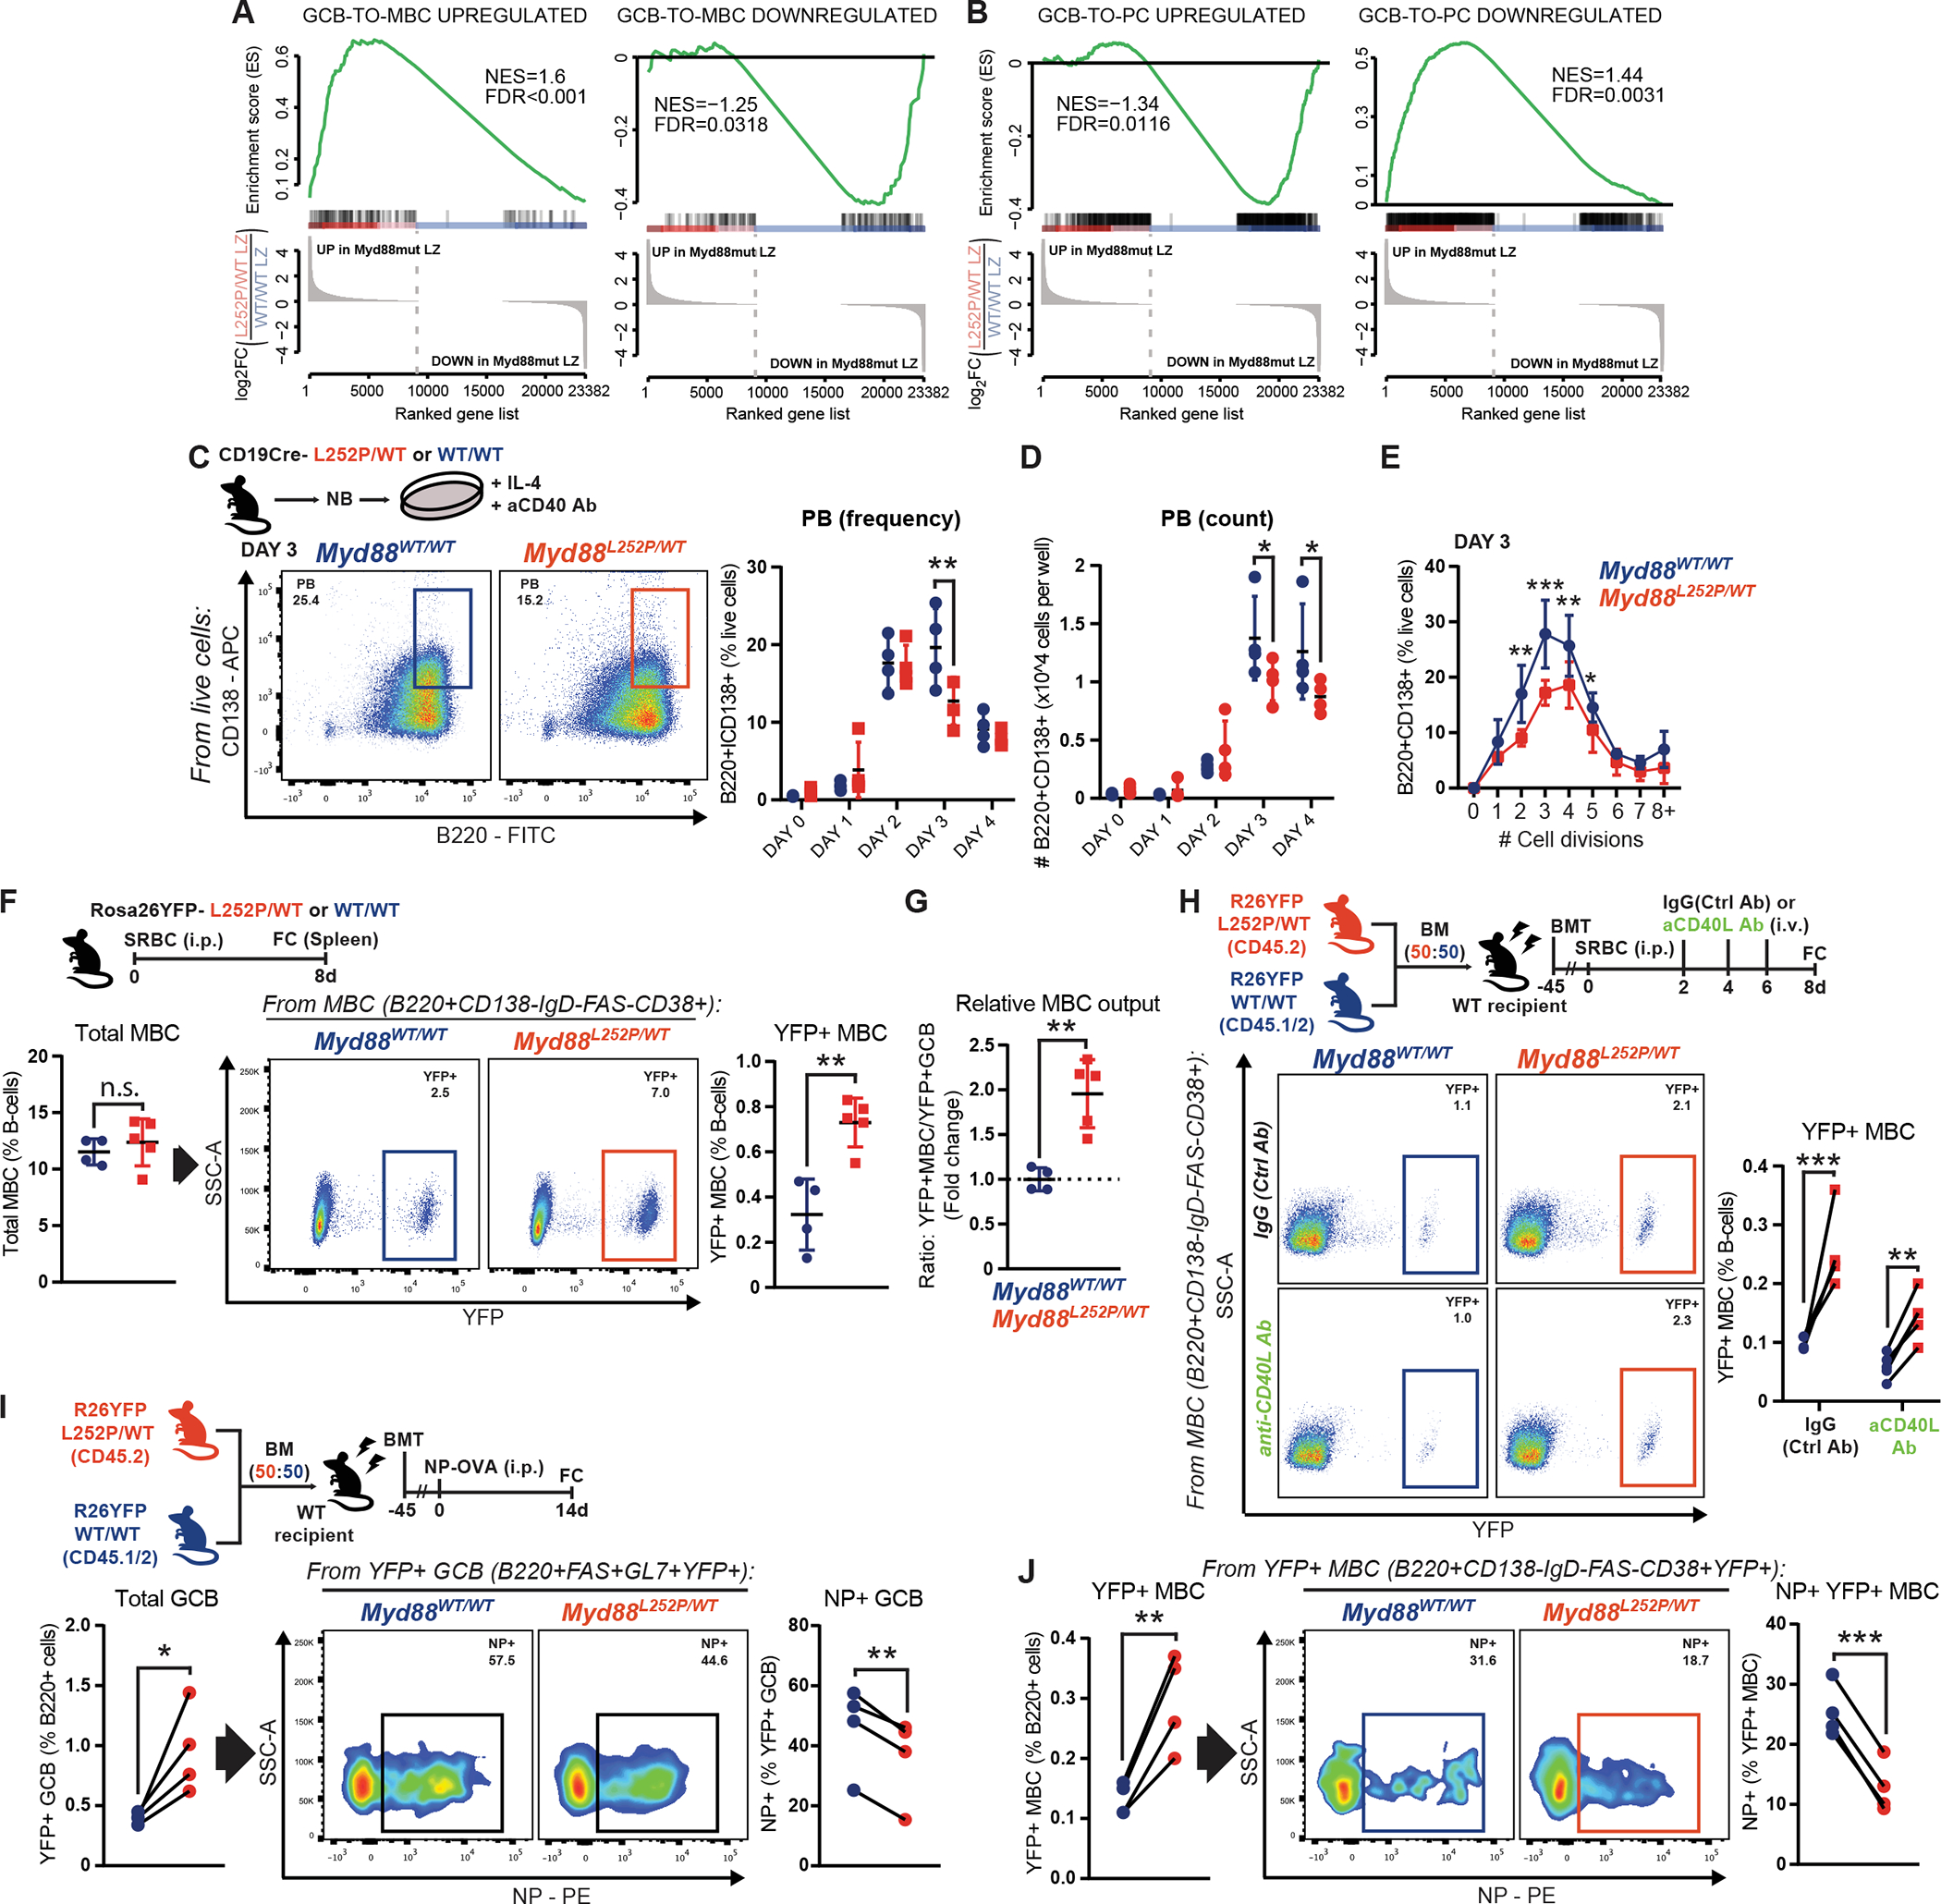
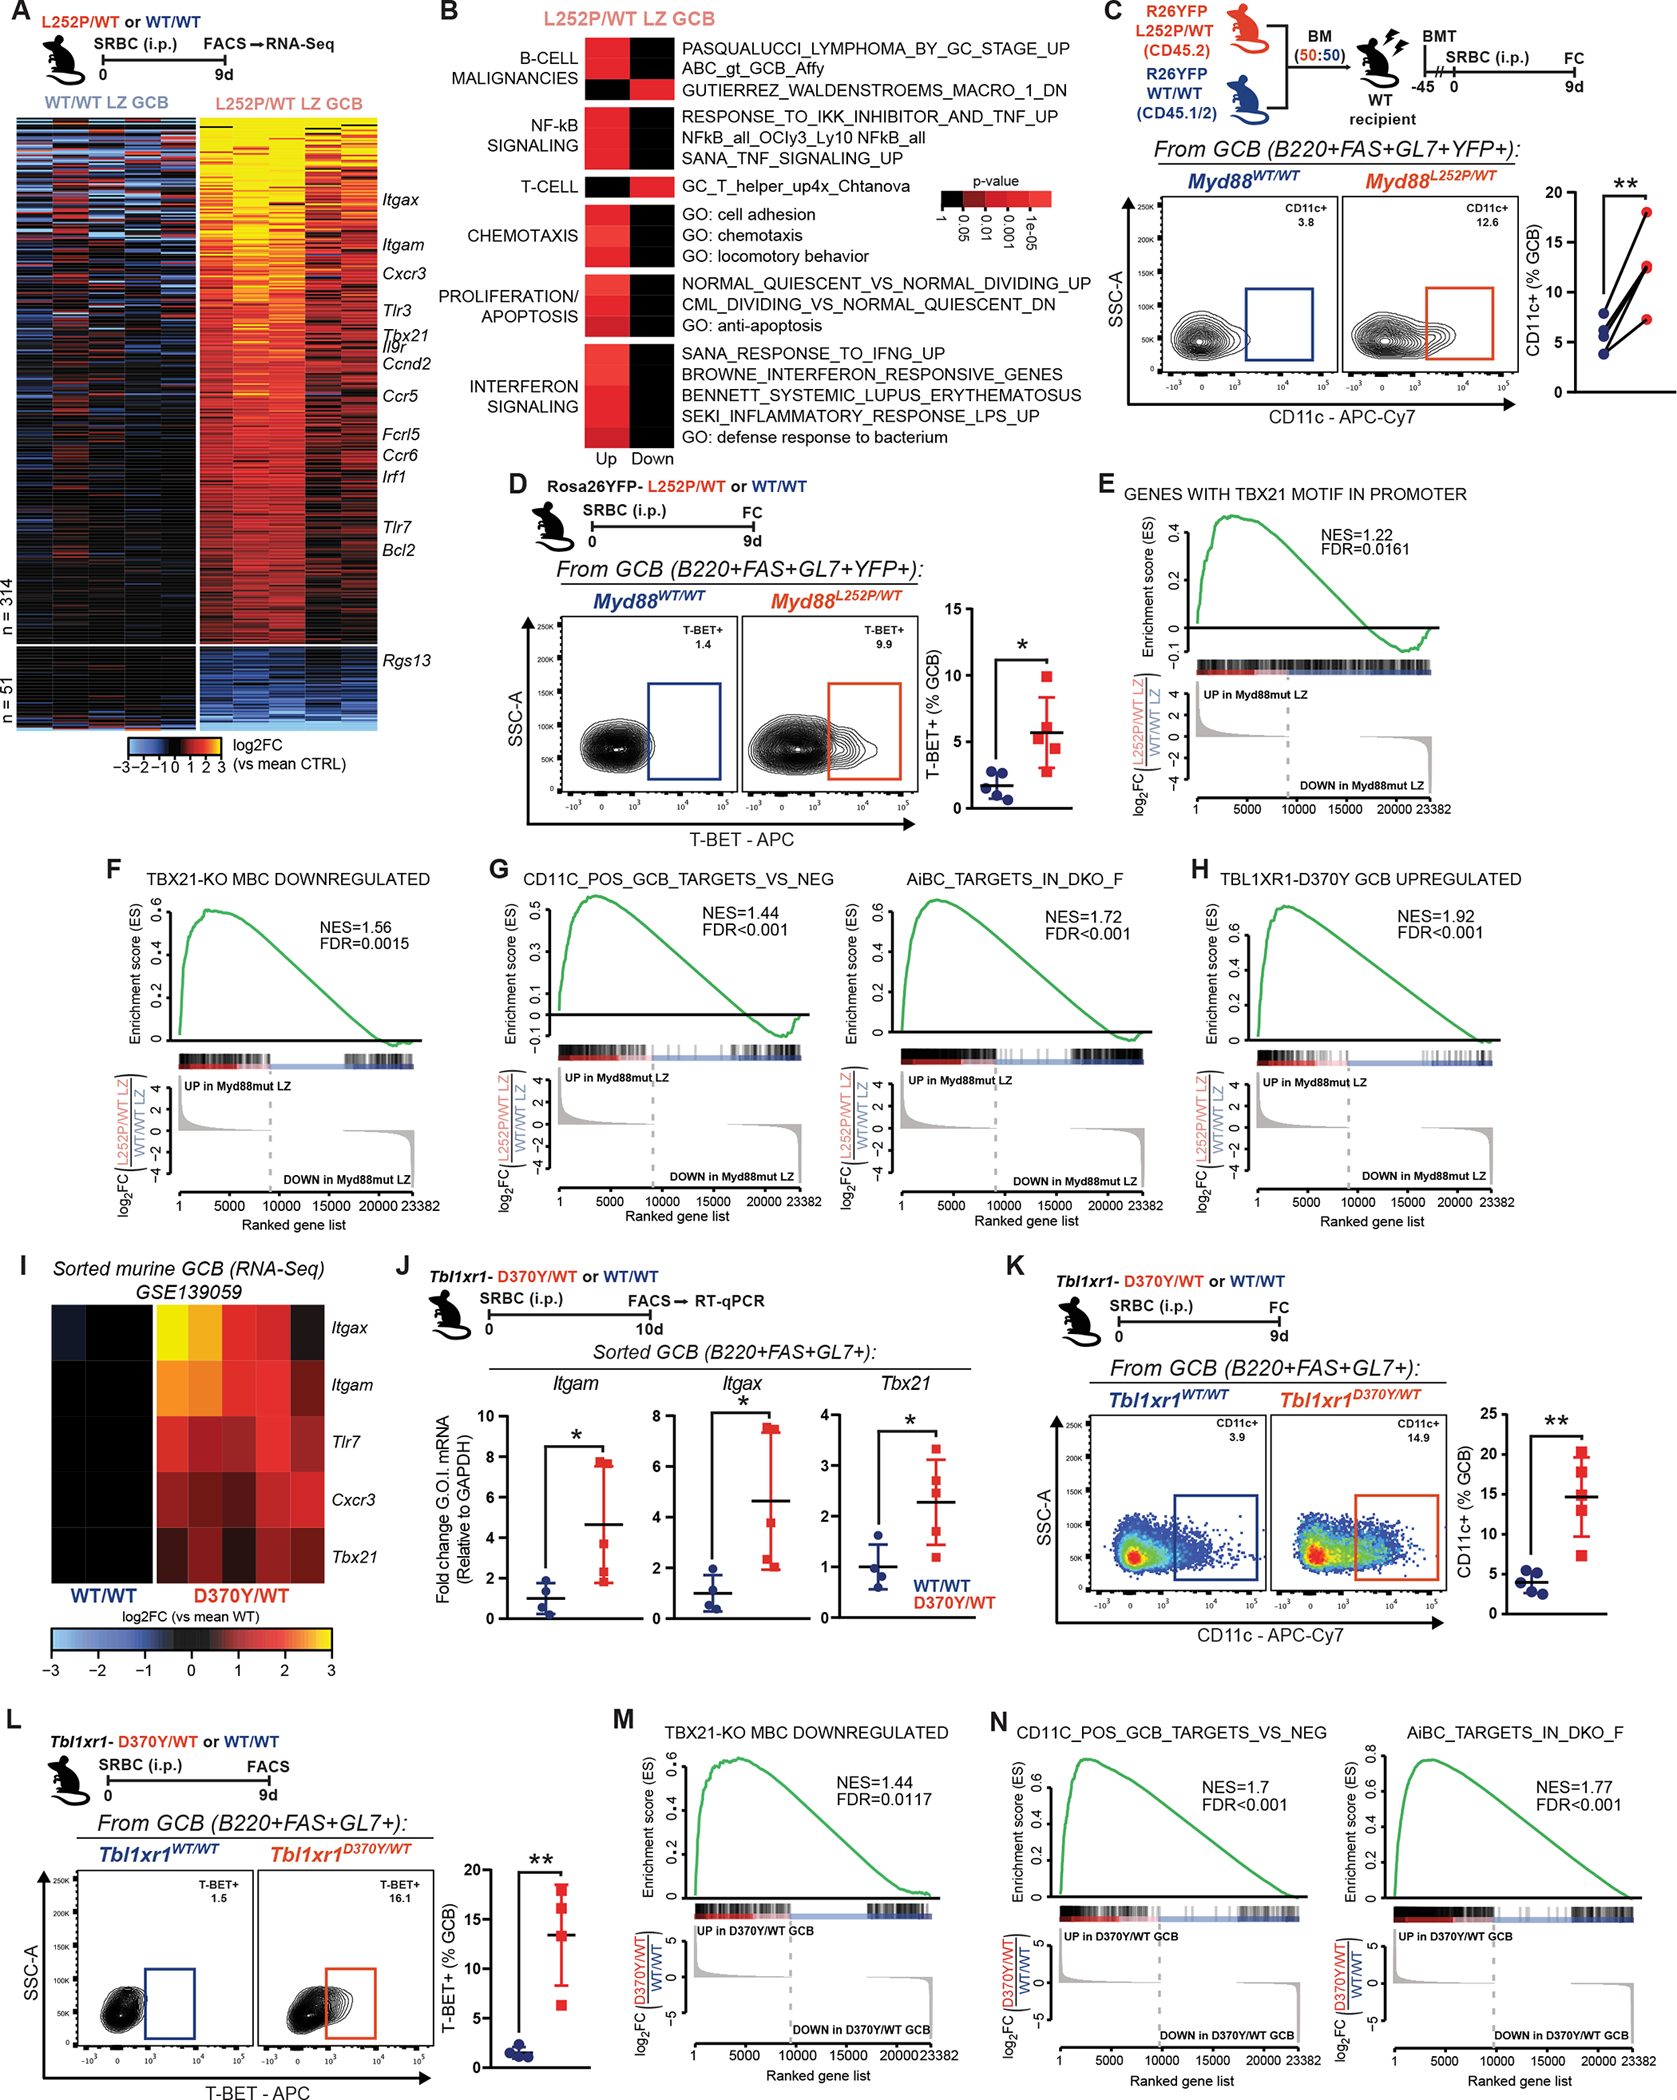
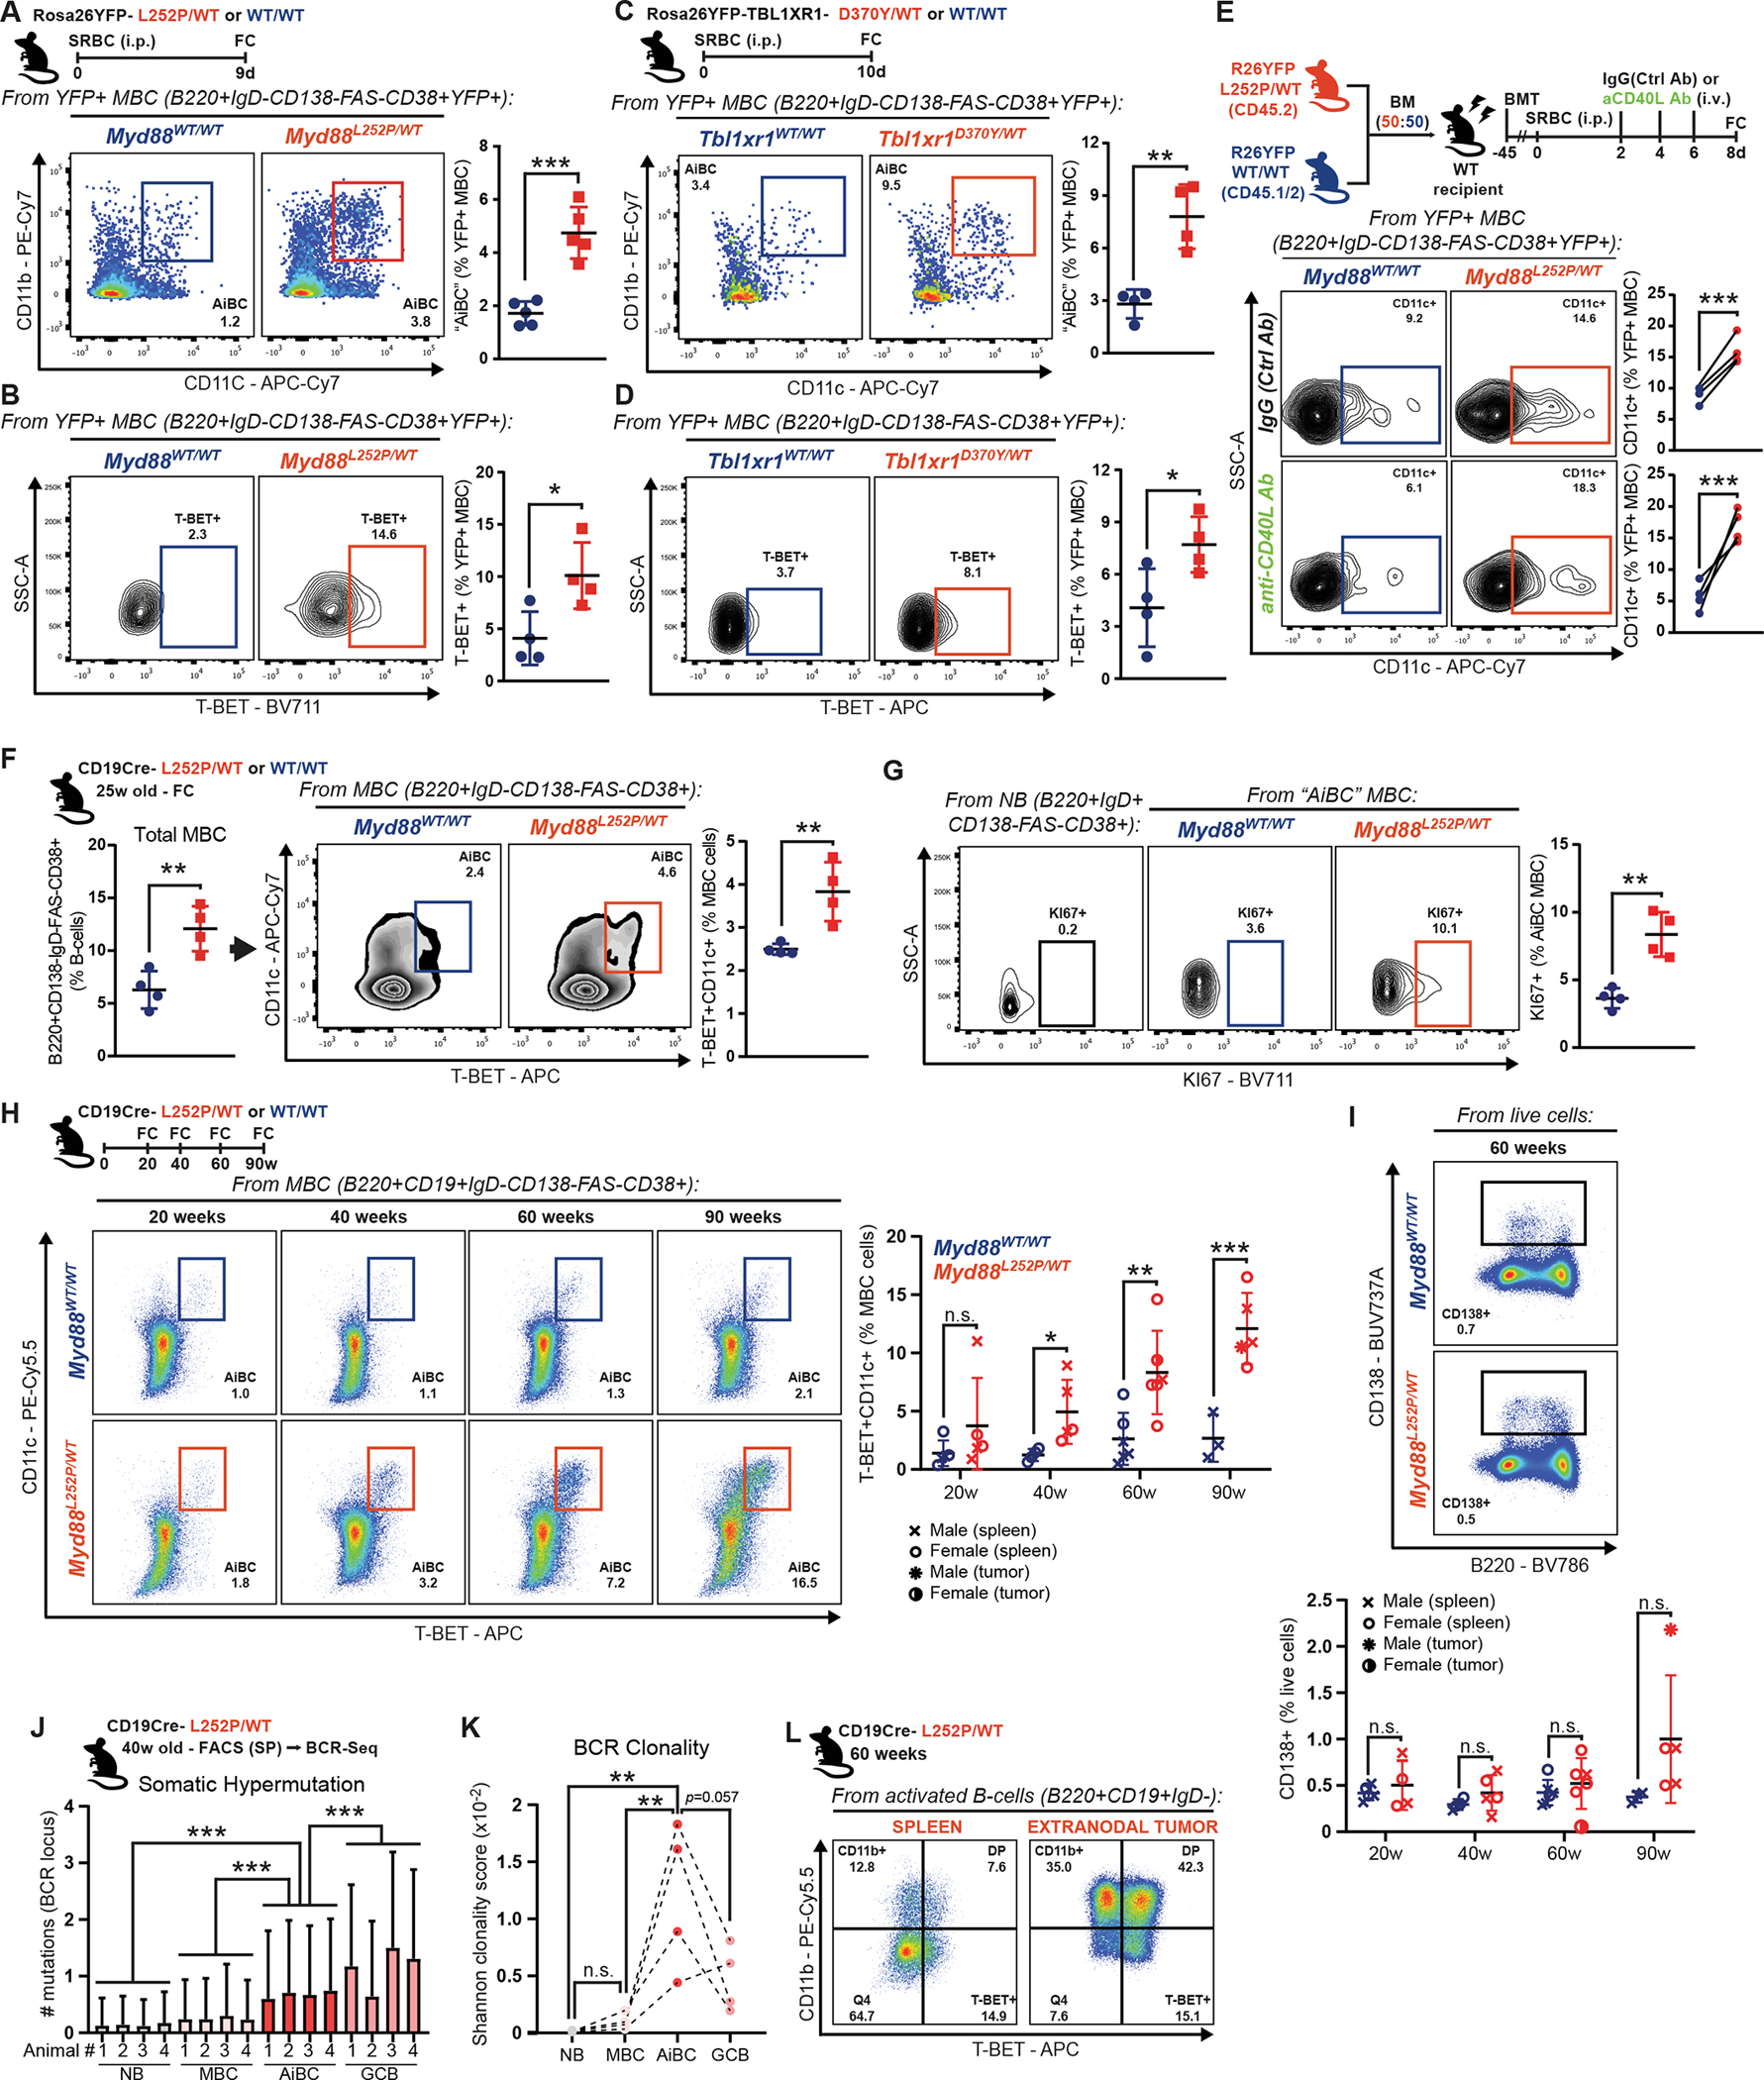
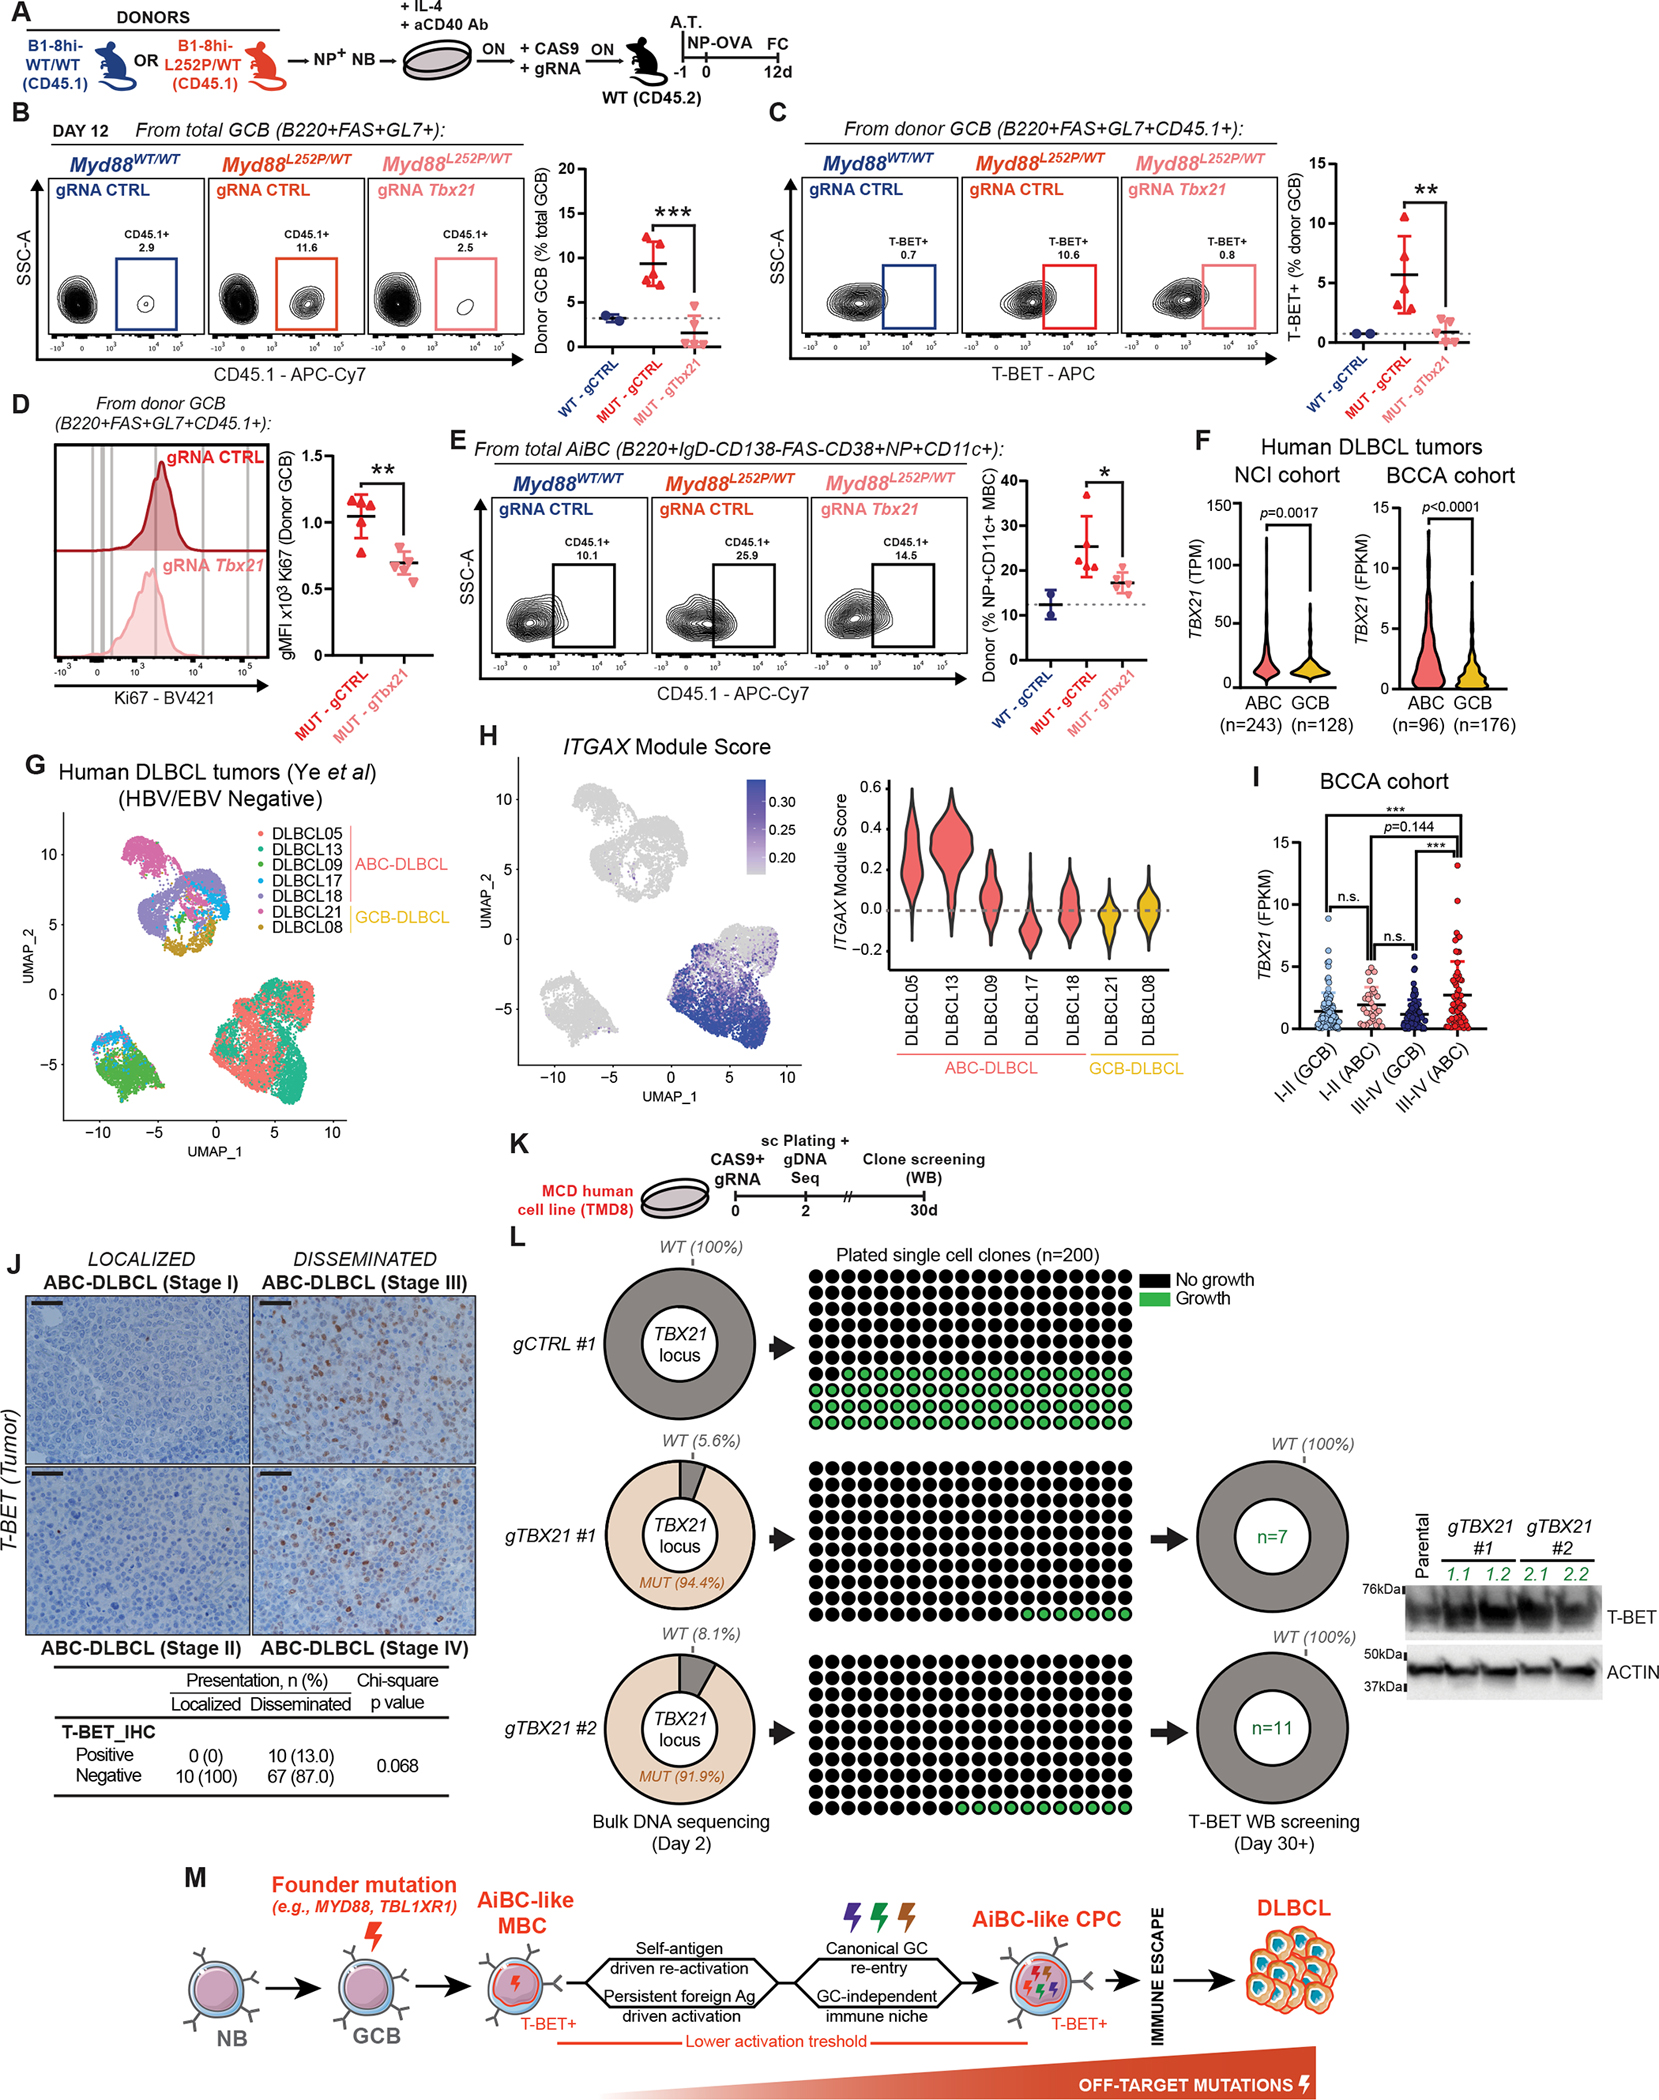
A third of patients with diffuse large B-cell lymphoma (DLBCL) present with extranodal dissemination, which is associated with inferior clinical outcomes. MYD88L265P is a hallmark extranodal DLBCL mutation that supports lymphoma proliferation. Yet extranodal lymphomagenesis and the role of MYD88L265P in transformation remain mostly unknown. Here, we show that B cells expressing Myd88L252P (MYD88L265P murine equivalent) activate, proliferate, and differentiate with minimal T-cell costimulation. Additionally, Myd88L252P skewed B cells toward memory fate. Unexpectedly, the transcriptional and phenotypic profiles of B cells expressing Myd88L252P, or other extranodal lymphoma founder mutations, resembled those of CD11c+T-BET+ aged/autoimmune memory B cells (AiBC). AiBC-like cells progressively accumulated in animals prone to develop lymphomas, and ablation of T-BET, the AiBC master regulator, stripped mouse and human mutant B cells of their competitive fitness. By identifying a phenotypically defined prospective lymphoma precursor population and its dependencies, our findings pave the way for the early detection of premalignant states and targeted prophylactic interventions in high-risk patients.

Significance: Extranodal lymphomas feature a very poor prognosis. The identification of phenotypically distinguishable prospective precursor cells represents a milestone in the pursuit of earlier diagnosis, patient stratification, and prophylactic interventions. Conceptually, we found that extranodal lymphomas and autoimmune disorders harness overlapping pathogenic trajectories, suggesting these B-cell disorders develop and evolve within a spectrum. See related commentary by Leveille et al. (Blood Cancer Discov 2023;4:8-11). This article is highlighted in the In This Issue feature, p. 1.


Conflict of interest statement

COI statement: A.M.M. reports grants from Janssen, Epizyme, and Daiichi Sankyo and consulting fees from Janssen, Epizyme, AstraZeneca, Daiichi Sankyo, Treeline Biosciences and Exo Therapeutics outside the submitted work. H.C.R. received consulting and lecture fees from Abbvie, AstraZeneca, Novartis, Vertex, BMS and Merck. H.C.R. received research funding from Gilead Pharmaceuticals and AstraZeneca. H.C.R. is a co-founder of CDL Therapeutics GmbH. C.E.M. is a co-founder of Onegevity. No COI were reported by the other authors.

Figures

Figure 1.
Figure 1.. Myd88 mutations increase the competitive fitness of GCB.
A-B, Flow cytometry (FC) analysis of splenic (A) B-cells or (B) GCB. C, H&E, B220 IHC and PNA IHC in consecutive splenic sections from animals treated as in (A). Scale = 100μm. D-E, GC (D) numbers or (E) individual area, based on PNA staining. Dots represent individual (D) animals or (E) GCs. Results for 5 animals per genotype. F, FC analysis of Myd88L252P/WT and Myd88WT/WT relative contribution to B-cells and GCB, based on CD45 allele frequencies. G, FC analysis of splenic GCB. Values represent mean ± SEM. Data reproducible with two repeats. NS, not significant; *P < 0.05; **P < 0.01; ***P < 0.001, using unpaired (A,B) or paired (F,G) two-tailed Student’s t-test with the two-stage step-up method of Benjamini, Krieger and Yekutieli where applicable; or Mann-Whitney U-test (D,E).
Figure 2.
Figure 2.. Myd88 mutations confer a proliferative advantage to GCB.
A, Geometric mean fluorescence intensity (gMFI) of Ki67 in splenic GCB. B, FC analysis of EdU incorporation by GCB. NB illustrate non-proliferating cells. C, FC analysis of Ki67+ GCB. D, FC analysis of Myd88L252P/WT and Myd88WT/WT relative contribution to total, DZ or LZ GCB. E, FC analysis of Ki67+ DZ and LZ GCB from (D). F, FC analysis of Ki67 expression in Ki67+ DZ and LZ GCB from (E). G, Hierarchical clustering, based on Euclidean distance, for RNA-Seq samples from sorted GCB. H-I, GSVA analysis for samples in (G), relative to canonical (H) LZ or (I) DZ GCB signatures (GSE38696). Values represent mean ± SEM. P-values calculated using unpaired (A,D) or paired (B,C,E,F) two-tailed Student’s t-test with the two-stage step-up method of Benjamini, Krieger and Yekutieli where applicable.
Figure 3.
Figure 3.. Myd88 mutations lower the requirement for T-cell-derived co-stimulatory signals.
A-C, FC analysis of (A) CD4+ or (B) GC TFH cells. (C) GC TFH abundance relative to GCB in the same animals. D, Experimental scheme for E-G. E-F, FC analysis of GCB as (E) percentage of B-cells or (F) change between conditions. G, FC analysis of Ki67 expression in GCB from (E). H-I, FC analysis of iGCB with variable (H) CD40 or (I) IL-4 stimulation. J, FC analysis of splenic GCB. K, FC analysis of GCB in non-immunized mice. L, B220 and PNA IHC in consecutive sections from animals treated as in K. Scale = 100μm. M-N, GC (M) numbers or (N) individual area in naive mice. Dots represent individual (M) animals or (N) GCs. Results for 12–18 animals per genotype, from 2 experiments. O, FC analysis of Myd88L252P/WT and Myd88WT/WT relative contribution to B-cells and GCB. Values represent mean ± SEM. P-values calculated using unpaired (A-C,F,G,J,K) or paired (E,G,O) two-tailed Student’s t-test; or Mann-Whitney U-test (M,N); or two-way ANOVA with Tukey’s post-test (H,I).
Figure 4.
Figure 4.. Myd88 mutations enable an aberrantly increased and pervasive GC output.
A-B, GSEA of (A) MBC or (B) PC signatures (GSE4142), against Myd88L252P/WT LZ GCB. C-D, FC analysis of CD138+ cells (C) relative or (D) absolute abundance. E, FC analysis of the relative fraction of CD138+ cells per cell division, determined by proliferation dye dilution, in cells from (C). Results for 3 animals per genotype. F, FC analysis of (left) total or (right) YFP+ MBC. G, YFP+ MBC abundance relative to YFP+ GCB in the same animals. H, FC analysis of YFP+ MBC. I-J, FC analysis of (left) total or (right) NP-specific (I) YFP+ GCB or (J) YFP+ MBC. Values represent mean ± SEM. P-values calculated using unpaired (F,G) or paired (H-J) two-tailed Student’s t-test; or two-way ANOVA with Tukey’s post-test (C-E).
Figure 5.
Figure 5.. MCD mutations trigger an aged/autoimmune-like program in GCBs.
A, Differentially expressed genes in Myd88L252P/WT LZ GCB. B, Pathway analysis for genes in (A). C-D, FC analysis of (C) CD11c+ or (D) T-BET+ GCB. E, GSEA of genes with a T-BET binding motif in their promoter (HOCOMOCO v11; >90% match within −5kb:TSS:+2kb), against Myd88L252P/WT LZ GCB. F, GSEA of T-BET-KO MBC (GSE81189), against Myd88L252P/WT LZ GCB. G, GSEA of canonical murine AiBC signatures (GSE175365), against Myd88L252P/WT LZ GCB. H, GSEA of Tbl1xr1 mutant GCB (GSE139059), against Myd88L252P/WT LZ GCB. I, RNA-Seq-based expression of genes of interest (G.O.I.) in Tbl1xr1 mutant (D370Y/WT) or WT GCB (GSE139059). J, RT-qPCR validation of selected genes from (I), on independent animals. K-L, FC analysis of (K) CD11c+ or (L) T-BET+ GCB in Tbl1xr1MUT mice. M, GSEA of T-BET-KO MBC (GSE81189), against Tbl1xr1MUT GCB. N, GSEA of canonical murine AiBC signatures, against Tbl1xr1MUT GCB. Values represent mean ± SEM. P-values calculated using unpaired (D,J-L) or paired (C) two-tailed Student’s t-test.
Figure 6.
Figure 6.. MCD mutations cause a cumulative expansion of AiBC-like MBCs.
A-D, FC analysis of (A, C) CD11b+CD11c+ or (B, D) T-BET+ YFP+ MBC. E, FC analysis of CD11c+ YFP+ MBC. F, FC analysis of (left) total or (right) T-BET+CD11c+ MBC in non-immunized young animals. G, FC analysis of Ki67+ AiBC-like MBC in mice from (F). NB illustrate non-proliferating cells. H, FC analysis of splenic T-BET+CD11c+ MBC in non-immunized mice. Tumor samples are plotted but not considered for statistical analysis. I, FC analysis of CD138+ cells in animals from (H). J, BCR mutation burden in splenic B-cells. Values = mean ± SD. K, Clonality based on productive VDJ combinations. Datasets were down-sampled to a common minimum, to prevent size-based bias. L, FC analysis of T-BET and CD11b expression in activated B-cells from the spleen or extranodal tumor from an animal in (H). Values represent mean ± SEM. P-values calculated using unpaired (A-D,F,G-J) or paired (E) two-tailed Student’s t-test with the two-stage step-up method of Benjamini, Krieger and Yekutieli where applicable; or a Kruskal-Wallis test (J,K).
Figure 7.
Figure 7.. T-BET supports the fitness of MYD88-mutant B-cells.
A, Experimental scheme for B-D. ON = Overnight; A.T. = Adoptive transfer. B, FC profiling of donor B-cell contribution to total GCB. C, FC analysis of T-BET+ donor-derived GCB. D, FC analysis of KI67 expression in donor-derived GCB. E, FC analysis of donor B-cell contribution to AiBC-like MBC. F, RNA-Seq-based TBX21 expression in primary specimens from (left) NCI (47) or (right) BCCA (48,49) cohorts. G, uMAP depiction of single-cell RNA-Seq data from EBV/HBV-negative DLBCL tumors (50). H, Relative expression of the ITGAX module among specimens in (G). I, RNA-Seq-based TBX21 expression in primary human DLBCL specimens. J, Representative images and quantification of T-BET IHC in specimens from the BCCA cohort (52). Scale = 20μm. K, Experimental scheme for (L). L, (Left) Penetrance of targeted genomic alterations, at time of cell plating. (Center) Number of detectable clonal outgrows 30 days after plating. (Right) WB-based T-BET expression in clonal outgrows. Representative blots for 2 clones per gRNA. M, Schematic representation of the proposed transformation model. Values represent mean ± SEM. P-values calculated using unpaired two-tailed Student’s t-test (B-F), or one-way ANOVA with Tukey’s post-test (I).

Comment in

References

    1. Sehn LH, Salles G. Diffuse Large B-Cell Lymphoma. N Engl J Med 2021;384(9):842–58 doi 10.1056/NEJMra2027612. - DOI - PMC - PubMed
    1. Brink R, Phan TG. Self-Reactive B Cells in the Germinal Center Reaction. Annu Rev Immunol 2018;36:339–57 doi 10.1146/annurev-immunol-051116-052510. - DOI - PubMed
    1. Victora GD, Nussenzweig MC. Germinal Centers. Annu Rev Immunol 2022;40:413–42 doi 10.1146/annurev-immunol-120419-022408. - DOI - PubMed
    1. Venturutti L, Melnick AM. The Role of Epigenetic Mechanisms in B Cell Lymphoma Pathogenesis. Annu Rev Cancer Biology 2021;5(1):311–30 doi 10.1146/annurev-cancerbio-060820-125304. - DOI
    1. Bobillo S, Joffe E, Lavery JA, Sermer D, Ghione P, Noy A, et al. Clinical characteristics and outcomes of extranodal stage I diffuse large B-cell lymphoma in the rituximab era. Blood 2021;137(1):39–48 doi 10.1182/blood.2020005112. - DOI - PMC - PubMed

Publication types