. 2022 Nov 1;149(21):dev200940.
doi: 10.1242/dev.200940. Epub 2022 Nov 1.

Shadow enhancers modulate distinct transcriptional parameters that differentially effect downstream patterning events

Affiliations

Shadow enhancers modulate distinct transcriptional parameters that differentially effect downstream patterning events

Peter H Whitney et al. Development. .

Abstract

Transcription in the early Drosophila blastoderm is coordinated by the collective action of hundreds of enhancers. Many genes are controlled by so-called 'shadow enhancers', which provide resilience to environment or genetic insult, allowing the embryo to robustly generate a precise transcriptional pattern. Emerging evidence suggests that many shadow enhancer pairs do not drive identical expression patterns, but the biological significance of this remains unclear. In this study, we characterize the shadow enhancer pair controlling the gene short gastrulation (sog). We removed either the intronic proximal enhancer or the upstream distal enhancer and monitored sog transcriptional kinetics. Notably, each enhancer differs in sog spatial expression, timing of activation and RNA Polymerase II loading rates. In addition, modeling of individual enhancer activities demonstrates that these enhancers integrate activation and repression signals differently. Whereas activation is due to the sum of the two enhancer activities, repression appears to depend on synergistic effects between enhancers. Finally, we examined the downstream signaling consequences resulting from the loss of either enhancer, and found changes in tissue patterning that can be explained by the differences in transcriptional kinetics measured.

Keywords: Drosophila; MS2 live imaging; Morphogen gradient; Shadow enhancers; Transcriptional kinetics.


Conflict of interest statement

Competing interests The authors declare no competing or financial interests.

Figures

Fig. 1.
Fig. 1.
Early activation of sog is driven by two shadow enhancers. (A) Schematic of the sog locus. Previous studies have identified two enhancers that drive sog transcription (Dunipace et al., 2019). The proximal (green) enhancer located in the first intron of sog ∼1.5 kb downstream of the promoter and the distal enhancer (blue) located 20 kb upstream of the promoter. (B) Transcription factor binding sites relevant to the expression of sog. Both enhancers contain binding sites for Zld (gold), Dl (dark green) and Sna (plum). All sites are present in roughly equal number, but vary in their position within each enhancer. (C) All enhancer lines created for this study. Each line contains a 1.2 kb insertion of 24× MS2 loops located immediately downstream of the proximal enhancer. ΔPsogMS2 and ΔPΔDsogMS2 replace the proximal enhancer with spacer DNA computationally depleted for early blastoderm transcription factor binding sites (Scholes et al., 2019) to maintain the spacing between the promoter and the MS2 loops. ΔDsogMS2 and ΔPΔDsogMS2 replace the distal enhancer with a 3×P3 reporter construct for the purpose of screening mutant alleles. For each line, representative colorimetric in situ stainings for sog transcripts are shown in ventral lateral views. Lethal counts performed on all lines are listed to the right of each image. ΔPΔDsogMS2 produced no viable homozygous females or hemizygous males, and are therefore assumed to have a fully penetrant lethal phenotype. Scale bars: 50 μm.
Fig. 2.
Fig. 2.
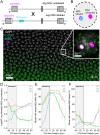
Internally controlled smFISH assay identifies spatial preference of each enhancer. (A) Crossing scheme used for all MS2 labeled lines. The location of exonic smFISH probe set (magenta) targets the first exon of sog, labeling both alleles, whereas the intronic smFISH probe set (cyan) targets only the MS2 sequence found in our engineered lines. (B) Schematic view of a single nucleus showing the expected allele labeling using the two probe sets. (C) Maximum intensity projection of z-stack images showing the region of the Dl gradient imaged. DAPI (white) labels nuclei, anti-Dl antibody (green) shows the Dl morphogenic gradient, MS2 probe (cyan) shows our MS2 tagged allele and sog probe (magenta) shows all active sog transcription. Inset shows a single nucleus, matching the expectation of labeling in B. (D) Log fold change calculated in each nucleus by taking the log ratio of the wild-type allele sog nascent transcript staining intensity over the MS2 allele sog nascent transcript staining intensity. Measurements were performed across the Dl gradient for WTsogMS2 (orange, n=5, 3241 nuclei), ΔPsogMS2 (blue, n=6, 4886 nuclei) and ΔDsogMS2 (green, n=4, 2362 nuclei). Shaded region with dashed line shows the location of the presumptive mesoderm. (E) Quantification of the percentage of all active MS2 alleles regardless of the state of the wild-type allele. (F) Quantification of the percentage of all active MS2 alleles in nuclei with no detectable wild-type allele transcription. Data are mean±s.e.m.
Fig. 3.
Fig. 3.
MS2 live imaging reveals differences in activation from NC12 to NC14. (A) Schematic of intronic MS2 loops reporting on live transcription. MS2 loops (blue hairpins) are transcribed and serve as binding sites for MCP-GFP (pink dots). Loops are spliced co-transcriptionally and are degraded by RNA-exonucleases (black circular sector). (B) Region of the embryo imaged during live imaging. Imaging volume of 135 μm×135 μm×15 μm was positioned ventral/laterally to capture ventral repression as seen in late NC14 in order to orient nuclei across the D/V axis. Embryos were imaged for ∼1 h across NC12 to NC14. (C) Stills taken from live imaging movie of WTsogMS2. Active transcription was determined by the appearance of MCP-GFP foci (pink) in nuclei marked by H2aV-RFP (white). (D) Quantification of number of nuclei with active transcription for WTsogMS2 (orange, n=5), ΔPsogMS2 (blue, n=5) and ΔDsogMS2 (green, n=4). Percentage of active nuclei were measured in the ventral region (mesoderm), ventral/lateral region, dorsal/lateral region and dorsal region of the sog transcriptional domain. Data are mean±s.e.m.
Fig. 4.
Fig. 4.
Internal kinetic parameters are modified by individual enhancers. (A) Maximum intensity projections of a single nucleus tracked over time. ton is determined by the first appearance of an MCP-GFP focus (pink) inside an H2aV-RFP-labeled nucleus (white). The first five time points of a track focus (purple line) are used to determine the relative RNA Pol II loading rate. toff represents the time point at which a focus can no longer be detected. (B) Signal intensity over time of the MCP-GFP focus tracked in A. Loading rate is found by fitting a linear model (purple line) to the first five time points after ton. (C) ton times across the D/V axis at NC13 (left) and NC14 (right) for WTsogMS2 (orange, n=5, 620 NC13 foci, 1236 NC14 foci), ΔPsogMS2 (blue, n=5, 566 NC13 foci, 1280 NC14 foci) and ΔDsogMS2 (green, n=4, 538 NC13 foci, 1111 NC14 foci). Shaded region of the graph represents the mesoderm. (D) Relative loading rates measured across the D/V axis for all genotypes at NC13 (left) and NC14 (right). (E) Schematic demonstrating how total transcriptional output is calculated. (F) Total output measured across the D/V axis for all genotypes at NC13 (left) and NC14 (right). Data are mean±s.e.m.
Fig. 5.
Fig. 5.
Modeling the activities of individual enhancers reveals potential synergy of Sna-mediated repression. (A) Activation over time of all genotypes in the lateral region of the embryo at NC14. Model fits (solid lines) based on simulations of 10,000 nuclei generated by sampling ton and toff distributions superimposed over data (open circles). Histograms of ton (red) and toff (blue) values used to perform simulations shown to the left. (B) Schematic of modeling WTsogMS2 activation over time using ton and toff values from enhancer deletion distributions. Active transcription (purple foci) is maintained by the sequential and overlapping activity of individual enhancers. Enhancer activity (proximal in green, distal in blue) is defined by ton and toff values derived from the fit distributions of each enhancer. (C) Output of combined model of non-interacting enhancers (black line) compared with activation data from WTsogMS2 (orange line). Each graph contains data from different spatial bins across the D/V axis.
Fig. 6.
Fig. 6.
sog enhancer deletions show differential downstream effects on the pMAD gradient and pMAD target gene expression. (A) Schematic of the downstream signaling controlled by sog. Sog protein diffuses dorsally from the ventral-lateral sog domain (dark purple) where it encounters and sequesters ventrally diffusing Dpp emanating from the pMAD domain (green). Sog also localizes Dpp to the dorsal midline (Shimmi et al., 2005; Wang and Ferguson, 2005). Genetic interactions of the components of this pathway are shown to the right. pMAD acts as a transcription factor on target genes hnt and ush. (B) Dorsal views of mid- and late-NC14 homozygous WTsogMS2 embryos stained with anti-1/5 pMAD antibody (green) and DAPI (white). Late embryos are identified by irregular nuclei shape and the appearance of the ventral furrow. Scale bars: 20 μm. (C) pMAD staining intensity across the dorsal midline of the embryo for WTsogMS2 (orange, n=10), ΔPsogMS2 (blue, n=11), ΔDsogMS2 (green, n=10) and ΔPΔDsogMS2 (purple, n=11). Each embryo is centered based on the point of highest pMAD intensity. (D) Quantification of pMAD domain width for all genotypes in mid- and late-NC14 embryos. Domain width is determined by measuring the point at which pMAD staining intensity is above 50% of maximum intensity. (E) Evaluation of pMAD target genes on all genetic backgrounds. Conventional colorimetric in situ hybridizations were performed on NC14 embryos. ush and hnt were chosen as representative early and late genes, respectively (Hoppe et al., 2020). Data are mean±s.e.m. Scale bars: 50 μm.

Similar articles

Cited by

References

    1. Berghammer, A. J., Klingler, M. and Wimmer, E. A. (1999). A universal marker for transgenic insects. Nature 402, 370-371. 10.1038/46463 - DOI - PubMed
    1. Bothma, J., Maggliocco, J. and Levine, M. (2011). The snail repressor inhibits release, not elongation, of paused Pol II in the Drosophila embryo. Curr. Biol. 21, 1571-1577. 10.1016/j.cub.2011.08.019 - DOI - PMC - PubMed
    1. Dorfman, R. and Shilo, B. Z. (2001). Biphasic activation of the BMP pathway patterns the Drosophila embryonic dorsal region. Development 128, 965-972. 10.1242/dev.128.6.965 - DOI - PubMed
    1. Dunipace, L., Ákos, Z. and Stathopoulos, A. (2019). Coacting enhancers can have complementary functions within gene regulatory networks and promote canalization. PLoS Genet. 15, e1008525. 10.1371/journal.pgen.1008525 - DOI - PMC - PubMed
    1. El-Sherif, E. and Levine, M. (2016). Shadow enhancers mediate dynamic shifts of gap gene expression in the Drosophila embryo. Curr. Biol. 26, 1164-1169. 10.1016/j.cub.2016.02.054 - DOI - PMC - PubMed

Publication types

MeSH terms

Substances

LinkOut - more resources