. 2022 Oct 20;79(11):558.
doi: 10.1007/s00018-022-04593-8.

Functional interdependence of the actin regulators CAP1 and cofilin1 in control of dendritic spine morphology

Affiliations

Functional interdependence of the actin regulators CAP1 and cofilin1 in control of dendritic spine morphology

Anika Heinze et al. Cell Mol Life Sci. .

Erratum in

Abstract

The vast majority of excitatory synapses are formed on small dendritic protrusions termed dendritic spines. Dendritic spines vary in size and density that are crucial determinants of excitatory synaptic transmission. Aberrations in spine morphogenesis can compromise brain function and have been associated with neuropsychiatric disorders. Actin filaments (F-actin) are the major structural component of dendritic spines, and therefore, actin-binding proteins (ABP) that control F-actin dis-/assembly moved into the focus as critical regulators of brain function. Studies of the past decade identified the ABP cofilin1 as a key regulator of spine morphology, synaptic transmission, and behavior, and they emphasized the necessity for a tight control of cofilin1 to ensure proper brain function. Here, we report spine enrichment of cyclase-associated protein 1 (CAP1), a conserved multidomain protein with largely unknown physiological functions. Super-resolution microscopy and live cell imaging of CAP1-deficient hippocampal neurons revealed impaired synaptic F-actin organization and dynamics associated with alterations in spine morphology. Mechanistically, we found that CAP1 cooperates with cofilin1 in spines and that its helical folded domain is relevant for this interaction. Moreover, our data proved functional interdependence of CAP1 and cofilin1 in control of spine morphology. In summary, we identified CAP1 as a novel regulator of the postsynaptic actin cytoskeleton that is essential for synaptic cofilin1 activity.

Keywords: Actin dynamics; Actin turnover; Postsynaptic density; Synaptic actin; Synaptic plasticity.


Conflict of interest statement

The authors have no relevant financial or non-financial interests to disclose.

Figures
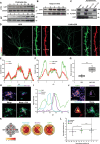
Fig. 1
Fig. 1
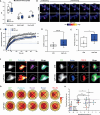
HYPERLINK "sps:id::fig1||locator::gr1||MediaObject::0" Enrichment of CAP1 in spine heads. A Immunoblots showing CAP1 expression throughout postnatal cerebral cortex (CTX) and hippocampal (HIP) development. GAPDH was used as loading control. B Immunoblots showing CAP1 expression in isolated cerebral cortex neurons. β-tubulin was used as loading control. C Immunoblots showing the presence of CAP1 in synaptosomes and in the soluble (Sol.), but not in the insoluble protein fraction (Insol.). PSD-95 and synaptophysin (Synapto.) proved separation of protein fractions. D DIV16 hippocampal neurons expressing the volume marker dsRed (red) together with either GFP or CAP1-GFP (green). Boxes indicate areas shown at higher magnification. E Fluorescence intensity profiles for GFP and dsRed along line E in D. F Fluorescence intensity profiles for GFP and dsRed along line F in D. G Box plots (incl. mean values (MV) ± standard error of the means (SEM)) of GFP ratio in spine heads vs. dendritic shafts in neurons expressing either GFP or CAP1-GFP. H STED images of an excitatory synapse from a neuron stained with antibodies against CAP1 (‘fire’ (single channel), green (merge)), the presynaptic marker Bassoon (cyan), and the PSD marker Shank3 (magenta). Areas framed by dotted lines in upper left image indicate distribution of Bassoon and Shank3. I Integrated fluorescence intensity profiles for CAP1, Bassoon, and Shank3 along transparent box shown in H, direction is indicated by dashed arrow. J STED images of a dendritic spine from a neuron stained with antibodies against CAP1 (‘fire’ (single channel), green (merge)) and Shank3 (magenta) as well as the F-actin marker phalloidin (‘red hot’ (single channel), cyan (merge)). Areas framed by dotted lines in upper left image indicate distribution of phalloidin and Shank3. K Graphs showing relative distribution of CAP1, Shank3, and phalloidin in spine heads. Scheme on the left shows the mask that was used for this analysis. L Graph showing center of mass for CAP1, Shank3, and phalloidin in spines. Coordinate system’s origin indicates spine center (see scheme in K). Scale bars (µm): 1 (H, J), 2 (D, high magnification), 20 (D, low magnification). *P < 0.05, ***P < 0.001
Fig. 2
Fig. 2
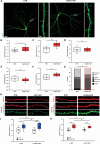
Reduced spine density and increased spine size in CAP1-KO neurons. A Micrographs of CTR and CAP1-KO neurons expressing GFP (green). Boxes indicate areas shown at higher magnification. Box plots (incl. MV ± SEM) of B total spine density, C spine volume, D spine length, E spine head length, and F spine head widths in CTR and CAP1-KO neurons. G Stacked column graph showing fractions of spine types in CTR and CAP1-KO neurons. Scale bar (µm): 2 (high magnification) 20 (low magnification). ns: P ≥ 0.05, **P < 0.01, ***P < 0.001
Fig. 3
Fig. 3
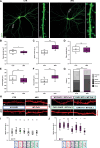
CAP1 controls actin turnover and F-actin distribution in spines. A Box plots (incl. MV ± SEM) showing morphometric analysis of mushroom-like spines in CTR and CAP1-KO neurons. B Image sequence of mushroom-like spines from CTR and CAP1-KO neurons expressing GFP-actin during fluorescence recovery after photobleaching (FRAP). C GFP-actin recovery curve in mushroom-like spines from CTR and CAP1-KO neurons. Normalized fluorescence recovery after 300 s (plateau, y-axis) as well as half-recovery time (x-axis) based on 50% of the plateau (y-axis) are indicated by gray lines for CTR and by blue lines for CAP1-KO neurons. Box plots (incl. MV ± SEM) showing D stable actin fraction and E half-recovery time of GFP-actin in CTR and CAP1-KO spines. F STED images showing mushroom-like spines of GFP-expressing CTR and CAP1-KO neurons. Neurons were stained with either an antibody against Shank3 (magenta) or phalloidin (‘red hot’ (single channel), cyan (merge)) or with antibodies against Homer (blue) and PSD-95 (red). GFP is shown in grayscale (single channel) or green (merge) as indicated. G Relative distribution of fluorescence intensities of phalloidin, Shank3, PSD-95, and Homer in CTR and CAP1-KO spines. GFP was used to determine spine morphology. Relative fluorescence intensities were plotted for each segment as shown in Fig. 1K. H Graph showing centers of mass for phalloidin, Shank3, PSD-95, and Homer in CTR and CAP1-KO spines. Centers of mass were normalized to GFP. Scale bars (µm): 1 (B, F). ns: P ≥ 0.05, *P < 0.05, **P < 0.01
Fig. 4
Fig. 4
Helical folded domain and CARP domain are relevant for CAP1 function in spines. A Schemes showing domain structure of myc-tagged CAP1 as well as the mutations introduced into CAP1-HFD, CAP1-CARP, and CAP1-P1. OD: oligomerization domain, HFD: helical folded domain, P1: proline-rich domain 1, WH2: Wiskott-Aldrich syndrome homology domain 2, P2: proline-rich domain 2, CARP: CAP and retinitis pigmentosa protein 2 domain. B Micrographs showing GFP and antibody staining against myc in CTR and CAP1-KO neurons expressing myc-tagged WT-CAP1 or mutant variants. Box plots (incl. MV ± SEM) showing spine density C in CTR or D in CAP1-KO neurons and spine volume E in CTR or F in CAP1-KO neurons upon expression of WT-CAP1 or mutant CAP1 variants. Asterisks and ns indicate significance of changes when compared to CTR neurons (C, E) or CAP1-KO neurons (D, F). Scale bar (µm): 2. ns: P ≥ 0.05, *P < 0.05, **P < 0.01
Fig. 5
Fig. 5
Physical interaction of CAP1 and cofilin1 in hippocampal neurons. A Dendritic shaft of a hippocampal neuron expressing cofilin1-GFP (green) and CAP1-mCherry (red). B Fluorescence intensity profiles for cofilin1-GFP and CAP1-mCherry along white line in A. Left-to-right direction in graph corresponds to top-to-bottom direction in micrograph. C Micrographs of hippocampal neurons used for proximity ligation assay (PLA) to show colocalization of endogenous CAP1 and cofilin1. Neurons expressed GFP (green) that served as a volume marker to outline dendritic compartment (line in black–white images). PLA signal (white dots in left images, black dots in right images) was present in neurons stained with antibodies against both ABP, but not in neurons stained with an antibody against CAP1 or cofilin1 alone, thereby confirming specificity of PLA signal. D Immunoblot analysis of proteins precipitated with either a mouse monoclonal CAP1 antibody or a mouse monoclonal antibody recognizing the β2-adaptin subunit of AP2 from hippocampal (HIP) homogenates. Cofilin1 coprecipitated with CAP1, but not with AP2—IgG: no IgG. E Immunoblots with antibodies against myc and GFP in lysates from HT-22 cells expressing either (i) myc-WT-CAP1 and GFP, (ii) myc-WT-CAP1 and GFP-WT-cofilin1 or (iii) myc-CAP1-HFD and GFP-WT-cofilin1. In the presence of GFP-WT-cofilin1, an antibody against GFP precipitated myc-WT-CAP1, but not myc-CAP1-HFD. Scale bars (µm): 2 (A), 5 (C)
Fig. 6
Fig. 6
Cofilin1-KO neurons display increases in spine size and fraction of large spines. A Micrographs of GFP-expressing CTR and cofilin1-KO neurons. Boxes indicate areas shown at higher magnification. Box plots (incl. MV ± SEM) showing B spine density, C spine volume, D spine length, E spine head length, and F spine head widths in CTR and cofilin1-KO neurons. G Stacked column graph showing fractions of spine types in CTR and cofilin1-KO neurons. H Micrographs of dendritic shafts from CTR and CAP1-KO neurons transfected with dsRed (red) together with either GFP (not shown) or cofilin1-GFP (green). I Micrographs of dendritic shafts from CTR and cofilin1-KO neurons transfected with dsRed (red) together with either GFP (not shown) or CAP1-GFP (green). J Box plots (incl. MV ± SEM) showing spine volume in CTR and CAP1-KO neurons either expressing GFP or cofilin1-GFP. K Box plots (incl. MV ± SEM) showing spine volume in CTR and cofilin1-KO neurons either expressing GFP or CAP1-GFP. Scale bar (µm): 2 (A, high magnification, H, I), 20 (A, low magnification). ns: P ≥ 0.05, *P < 0.05, **P < 0.01, ***P < 0.001
Fig. 7
Fig. 7
Cooperation of CAP1 and cofilin1 in spines. A Micrographs of GFP-expressing CTR and double-KO (dKO) neurons. Boxes indicate areas shown at higher magnification. Box plots (incl. MV ± SEM) showing B spine density, C spine volume, D spine length, E spine head length, and F spine head width in CTR and dKO neurons. G Stacked column graph showing fraction of spine types in CTR and dKO neurons. H Micrographs showing dsRed in CTR neurons as well as in dKO neurons upon transfection of CAP1 and/or cofilin1 constructs as indicated. Box plots (incl. MV ± SEM) showing spine volume I in CTR and J in dKO neurons upon expression of WT-cofilin1 and/or CAP1 constructs as indicated. Asterisks and ns indicate significance of changes when compared to CTR neurons (I) or dKO neurons (J). Scale bars (µm): 2 (A, high magnification, H), 20 (A, low magnification). ns: P ≥ 0.05, *P < 0.05, ***P < 0.001
Fig. 8
Fig. 8
Functional interdependence of CAP1 and cofilin1 in regulating dendritic spine size. A Scheme showing spine enlargement in neurons lacking CAP1, cofilin1, or both ABP as well as normalization of spine size in double KO neurons upon expression of WT-CAP1 and cofilin1, but not upon expression of CAP1-HFD and cofilin1. B The present study provides evidence for an interaction of the actin regulators CAP1 and cofilin1 in control of dendritic spine morphology. Our data and previous in vitro studies that unraveled a cooperation of CAP1 with cofilin1 in actin regulation [29, 30] let us hypothesize a cooperation of CAP1 and cofilin1 in postsynaptic actin regulation as well as functional interdependence of both ABP

References

    1. Ackermann M, Matus A. Activity-induced targeting of profilin and stabilization of dendritic spine morphology. Nat Neurosci. 2003;6:1194–1200. doi: 10.1038/nn1135. - DOI - PubMed
    1. Bellenchi GC, Gurniak CB, Perlas E, Middei S, Ammassari-Teule M, Witke W. N-cofilin is associated with neuronal migration disorders and cell cycle control in the cerebral cortex. Genes Dev. 2007;21:2347–2357. doi: 10.1101/gad.434307. - DOI - PMC - PubMed
    1. Ben Zablah Y, Merovitch N, Jia Z. The role of ADF/cofilin in synaptic physiology and Alzheimer's disease. Front Cell Dev Biol. 2020;8:594998. doi: 10.3389/fcell.2020.594998. - DOI - PMC - PubMed
    1. Bertling E, Hotulainen P, Mattila PK, Matilainen T, Salminen M, Lappalainen P. Cyclase-associated protein 1 (CAP1) promotes cofilin-induced actin dynamics in mammalian nonmuscle cells. Mol Biol Cell. 2004;15:2324–2334. doi: 10.1091/mbc.e04-01-0048. - DOI - PMC - PubMed
    1. Bertling E, Quintero-Monzon O, Mattila PK, Goode BL, Lappalainen P. Mechanism and biological role of profilin-Srv2/CAP interaction. J Cell Sci. 2007;120:1225–1234. doi: 10.1242/jcs.000158. - DOI - PubMed

MeSH terms