. 2022 Oct 21;378(6617):263-269.
doi: 10.1126/science.abn9884. Epub 2022 Oct 20.

Structure of the hepatitis C virus E1E2 glycoprotein complex

Affiliations

Structure of the hepatitis C virus E1E2 glycoprotein complex

Alba Torrents de la Peña et al. Science. .

Abstract

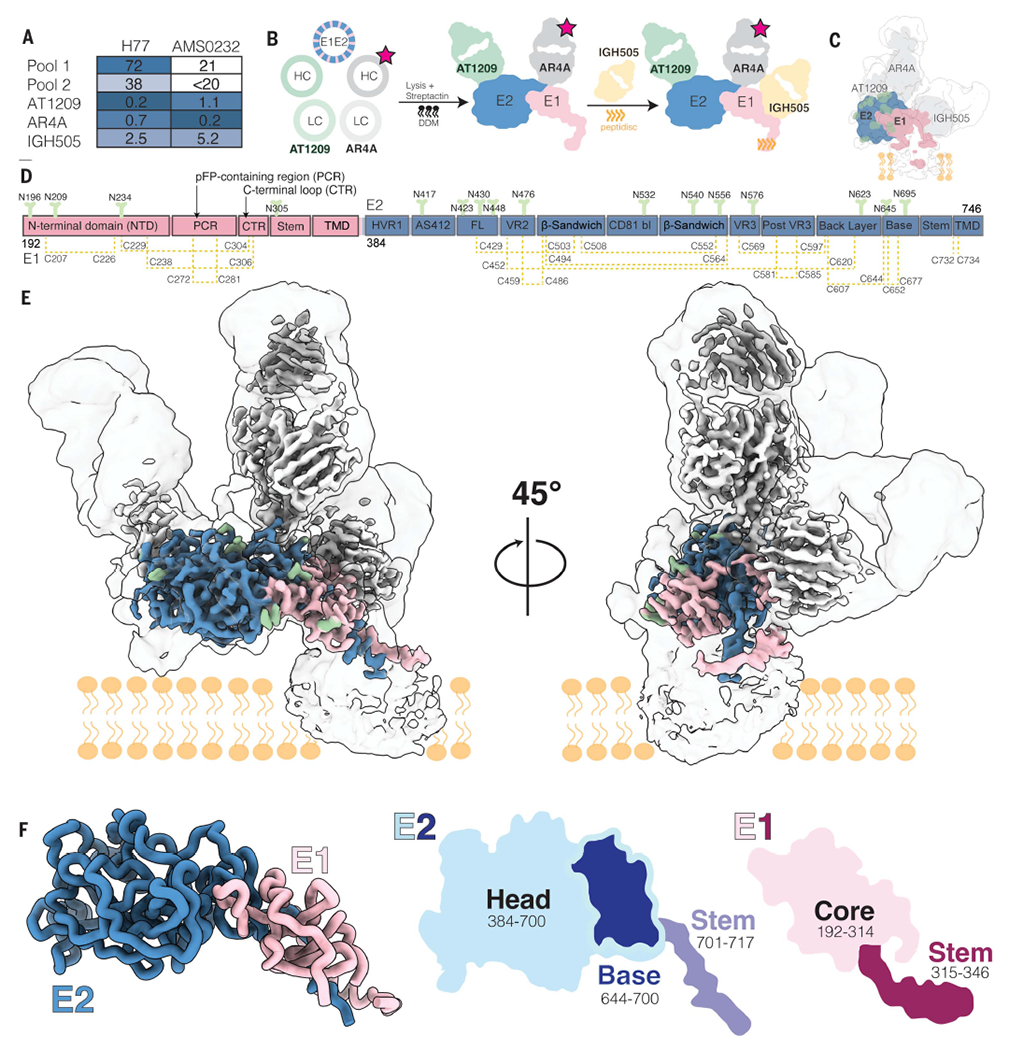
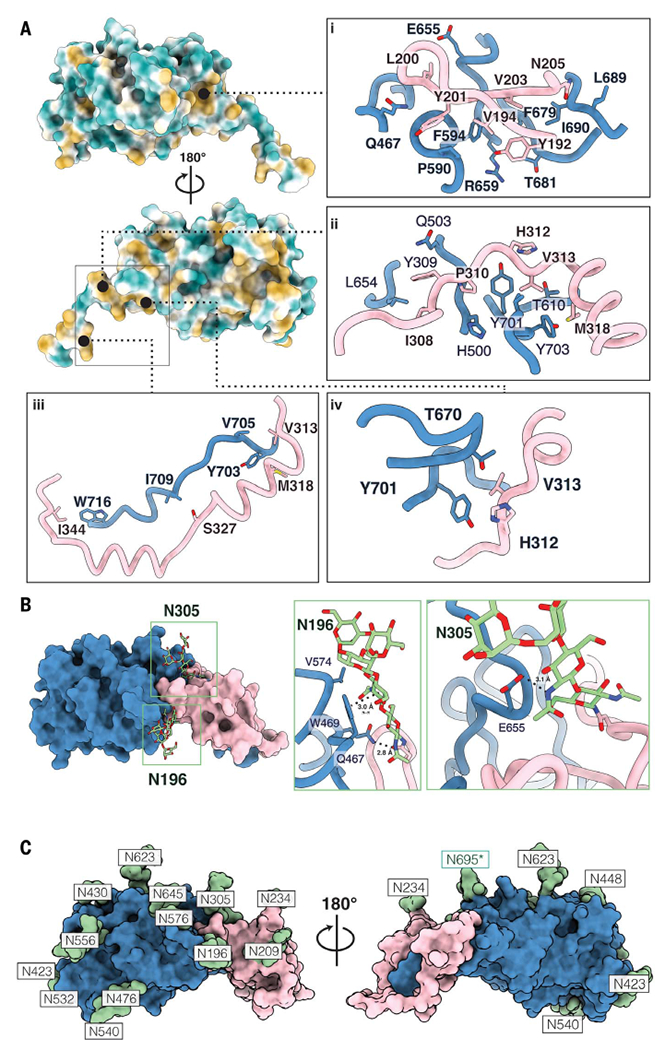
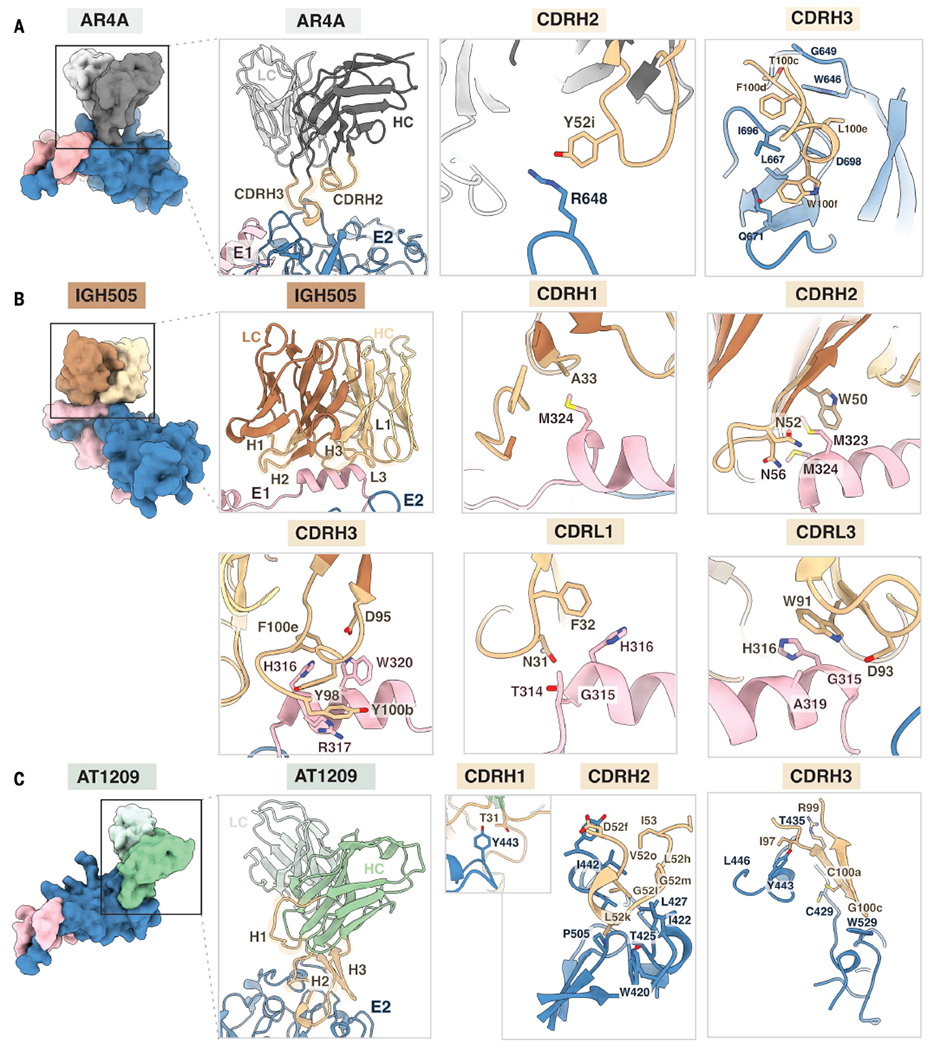
Hepatitis C virus (HCV) infection is a leading cause of chronic liver disease, cirrhosis, and hepatocellular carcinoma in humans and afflicts more than 58 million people worldwide. The HCV envelope E1 and E2 glycoproteins are essential for viral entry and comprise the primary antigenic target for neutralizing antibody responses. The molecular mechanisms of E1E2 assembly, as well as how the E1E2 heterodimer binds broadly neutralizing antibodies, remain elusive. Here, we present the cryo-electron microscopy structure of the membrane-extracted full-length E1E2 heterodimer in complex with three broadly neutralizing antibodies-AR4A, AT1209, and IGH505-at ~3.5-angstrom resolution. We resolve the interface between the E1 and E2 ectodomains and deliver a blueprint for the rational design of vaccine immunogens and antiviral drugs.


Conflict of interest statement

Competing interests: The authors declare that they have no competing interests.

Figures

Fig. 1.
Fig. 1.. Cryo-EM structure of the HCV E1E2 heterodimer in complex with bNAbs AT1209, IGH505, and AR4A.
(A) Sensitivity of AMS0232 and H77 pseudovirus to neutralization by polyclonal serum pools and bNAbs AT1209, IGH505, and AR4A. The serum dilutions and antibody concentrations (in μg/ml) at which HCV infectivity is inhibited by 50% (ID50 and IC50, respectively) are listed. Values are the mean of two or three independent experiments. Darker shading indicates increased sensitivity. (B) Schematic representation of the purification of full-length HCV E1E2. The stars indicate StrepII-tag. DDM, dodecyl-β-d-maltoside; HC, heavy chain; LC, light chain. (C) Cartoon representation of the cryo-EM map density of E1 and E2 in complex with AT1209, IGH505, and AR4A Fabs overlayed with the low-resolution cryo-EM map at a threshold of 0.1 in ChimeraX. (D) Schematic representation of the full-length E1E2 AMS0232 construct. The E1 and E2 subunits are shown in pink and blue, respectively, with the different subdomains indicated. N-linked glycans are shown in green and disulfide bonds in yellow. The same color coding is used in (E) and (F). (E) Cryo-EM map showing the density of the full-length E1E2 in complex with the three bNAbs. (F) View of E1E2 heterodimer. A cartoon representation of the head and stem regions of E2 with the newly resolved base region are highlighted.
Fig. 2.
Fig. 2.. Subdomain organization and disulfide bonds of E1 and E2.
(A to F) View of E1E2 subdomains. In (A), each domain in E2 is colored and represented as licorice and cartoon. The E2 stem and base are shown in tan, followed by the back layer in magenta, the β sandwich in green, the front layer in yellow, and the CD81 binding site in red; all variable regions (VR) are shown in white. In (B), the E1 NTD is shown in yellow, whereas the PCR is shown in orange, the CTR in shown in blue, and the stem region is colored white. Shown in (C) is a stem-in-hand model of E1 (hand) grasping the stem of E2. In (D), the location of each cysteine in E1E2 is highlighted in yellow and further outlined and numbered in (E). Shown in (F) are close-ups of the E1E2 C-terminal region to highlight the missing regions in this highly flexible region: the TMD in E2 and two helices in E1 that comprise the E1 pFP-containing region and contain a conserved disulfide bond as well as a TMD in E1 (indicated by the light pink cartoon line). The missing regions are depicted according to AlphaFold predictions.
Fig. 3.
Fig. 3.. The E1E2 interface and glycan shield.
(A) The newly characterized E1E2 interface is stabilized by hydrophobic interactions. E2 is colored by hydrophobicity, with green representing hydrophilic regions and yellow signifying hydrophobic patches. The first panel (i) showcases a deep hydrophobic cavity in the base of E2 against which E1 packs. The following panels (ii to iv) highlight additional hydrophobic interactions that we assert further stabilize the E1E2 interface. (B) Glycans buttress the E1E2 interface. Key interactions between glycans N196 and N305 are showcased. Glycan N196 is involved in hydrophobic interactions, including a π-π stacking interaction with W469, as well as a salt bridge with Q467. N305 forms a stabilizing salt bridge with E655. (C) Surface representation of the E1 and E2 model showing the glycan sites in green with their respective asparagine residues. The predominant glycoform identified by LC-MS at each PNGS was modeled using Coot (59). An asterisk indicates that the glycan at position N695 uses a noncanonical N-glycosylation motif, NXV. Single-letter abbreviations for the amino acid residues are as follows: A, Ala; C, Cys; D, Asp; E, Glu; F, Phe; G, Gly; H, His; I, Ile; K, Lys; L, Leu; M, Met; N, Asn; P, Pro; Q, Gln; R, Arg; S, Ser; T, Thr; V, Val; W, Trp; and Y, Tyr.
Fig. 4.
Fig. 4.. Structural definition of the AR4A, IGH505, and AT1209 epitopes.
(A) The AR4A Fab recognizes protein elements in E2 (blue) near the interface with the E1 subunit (pink). Heavy and light chains are shown in dark and light gray, respectively, and CDRH2 and CDRH3 are highlighted in tan. Whereas the CDRH2 only interacts with the stem region of E2, the CDRH3 loop targets both the back layer and stem of E2. (B) The IGH505 Fab interacts with the surface-exposed α helix in E1 (pink). Heavy and light chains are shown in brown and yellow, respectively, and CDRH1 to CDRH3 and CDRL1 and CDRL3 are highlighted in tan. IGH505 encases the conserved α helix in E1 (amino acids 310 to 328) using the CDRH1 to CDRH3 and CDRL1 and CDRL3 regions of the Fab. (C) The AT1209 Fab binds the front layer of E2 (blue). Heavy and light chains are represented in green and light green, respectively, and CDRH1 to CDRH3 are highlighted in tan. All of the CDRH loops interact with the front layer of E2, near the CD81 binding site. Epitopes on E1 and E2 were defined as residues containing an atom within 4 Å of the bound Fab, and the amino acids present in the epitope are shown as sticks representations.

References

    1. Fuerst TR, Pierce BG, Keck ZY, Foung SKH, Front. Microbiol 8, 2692 (2018). - PMC - PubMed
    1. Yost SA, Wang Y, Marcotrigiano J, Front. Immunol 9, 1917 (2018). - PMC - PubMed
    1. Kinchen VJ et al. Cell Host Microbe 24, 717–730.e5 (2018). - PMC - PubMed
    1. Pestka JM et al. Proc. Natl. Acad. Sci. U.S.A 104, 6025–6030 (2007). - PMC - PubMed
    1. Merat SJ et al. J. Hepatol 71, 14–24 (2019). - PubMed

Publication types

MeSH terms

Substances