. 2022 Dec 6;34(12):1977-1998.e9.
doi: 10.1016/j.cmet.2022.09.026. Epub 2022 Oct 19.

Comprehensive single-cell transcriptional profiling defines shared and unique epithelial injury responses during kidney fibrosis

Affiliations

Comprehensive single-cell transcriptional profiling defines shared and unique epithelial injury responses during kidney fibrosis

Haikuo Li et al. Cell Metab. .

Abstract

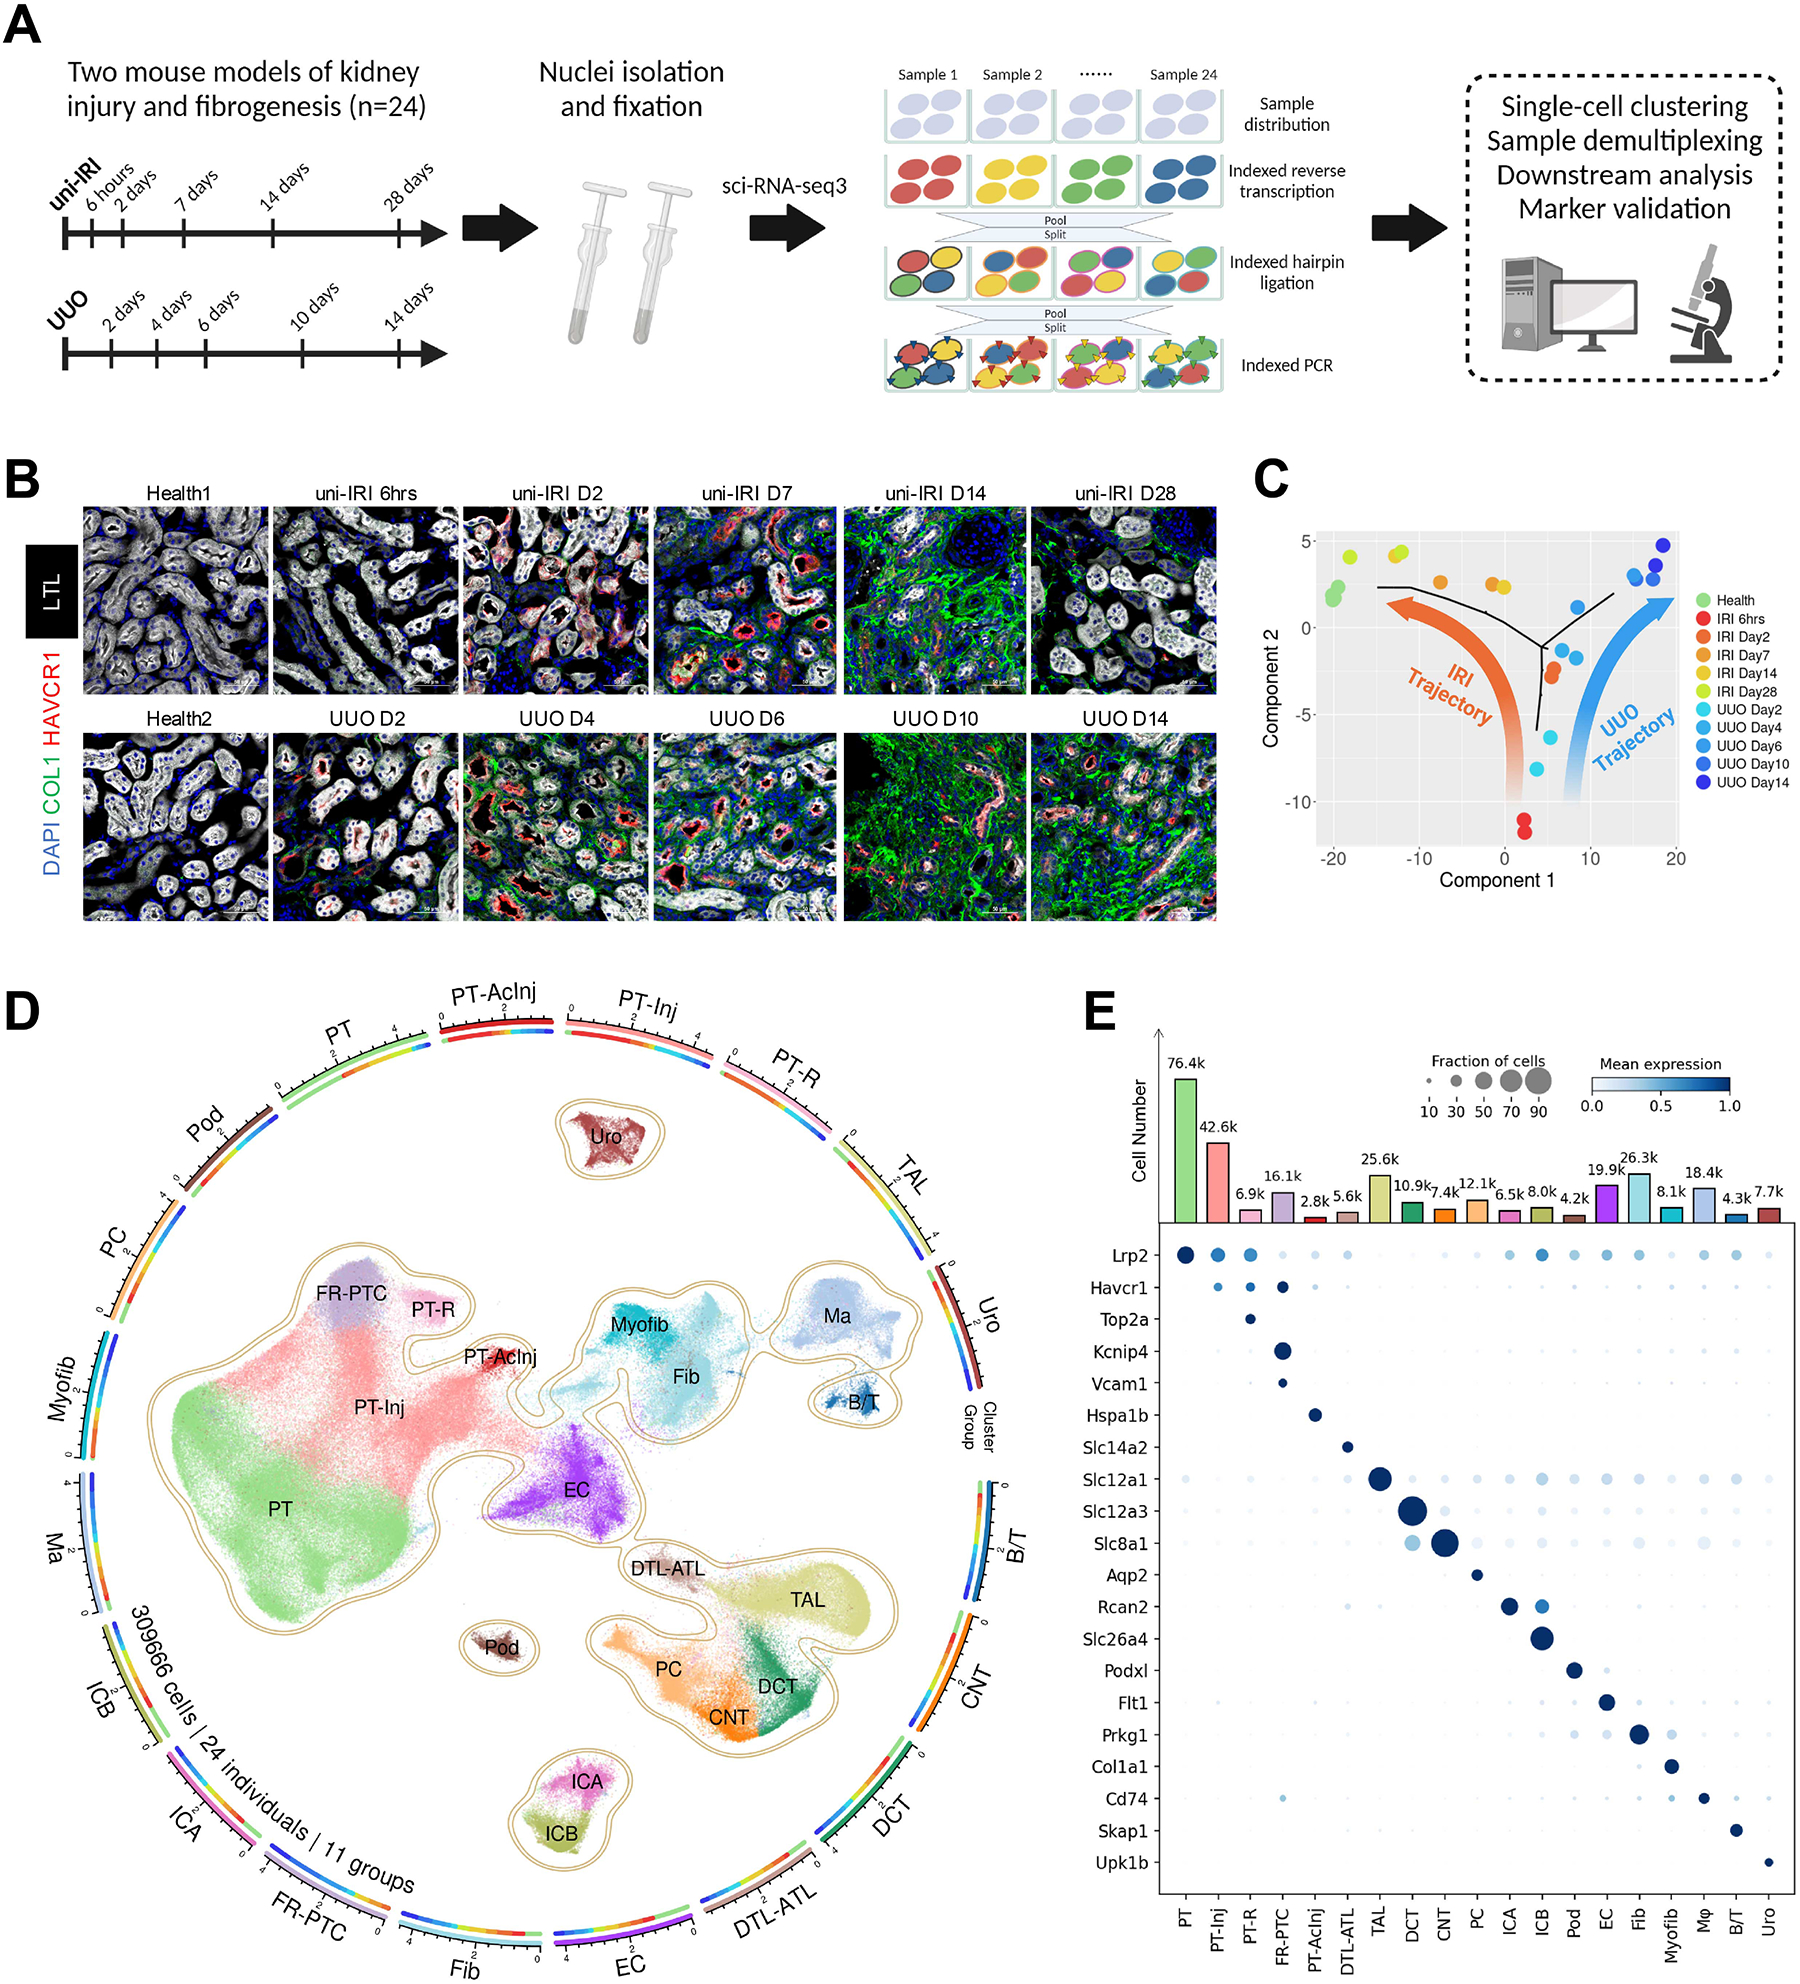
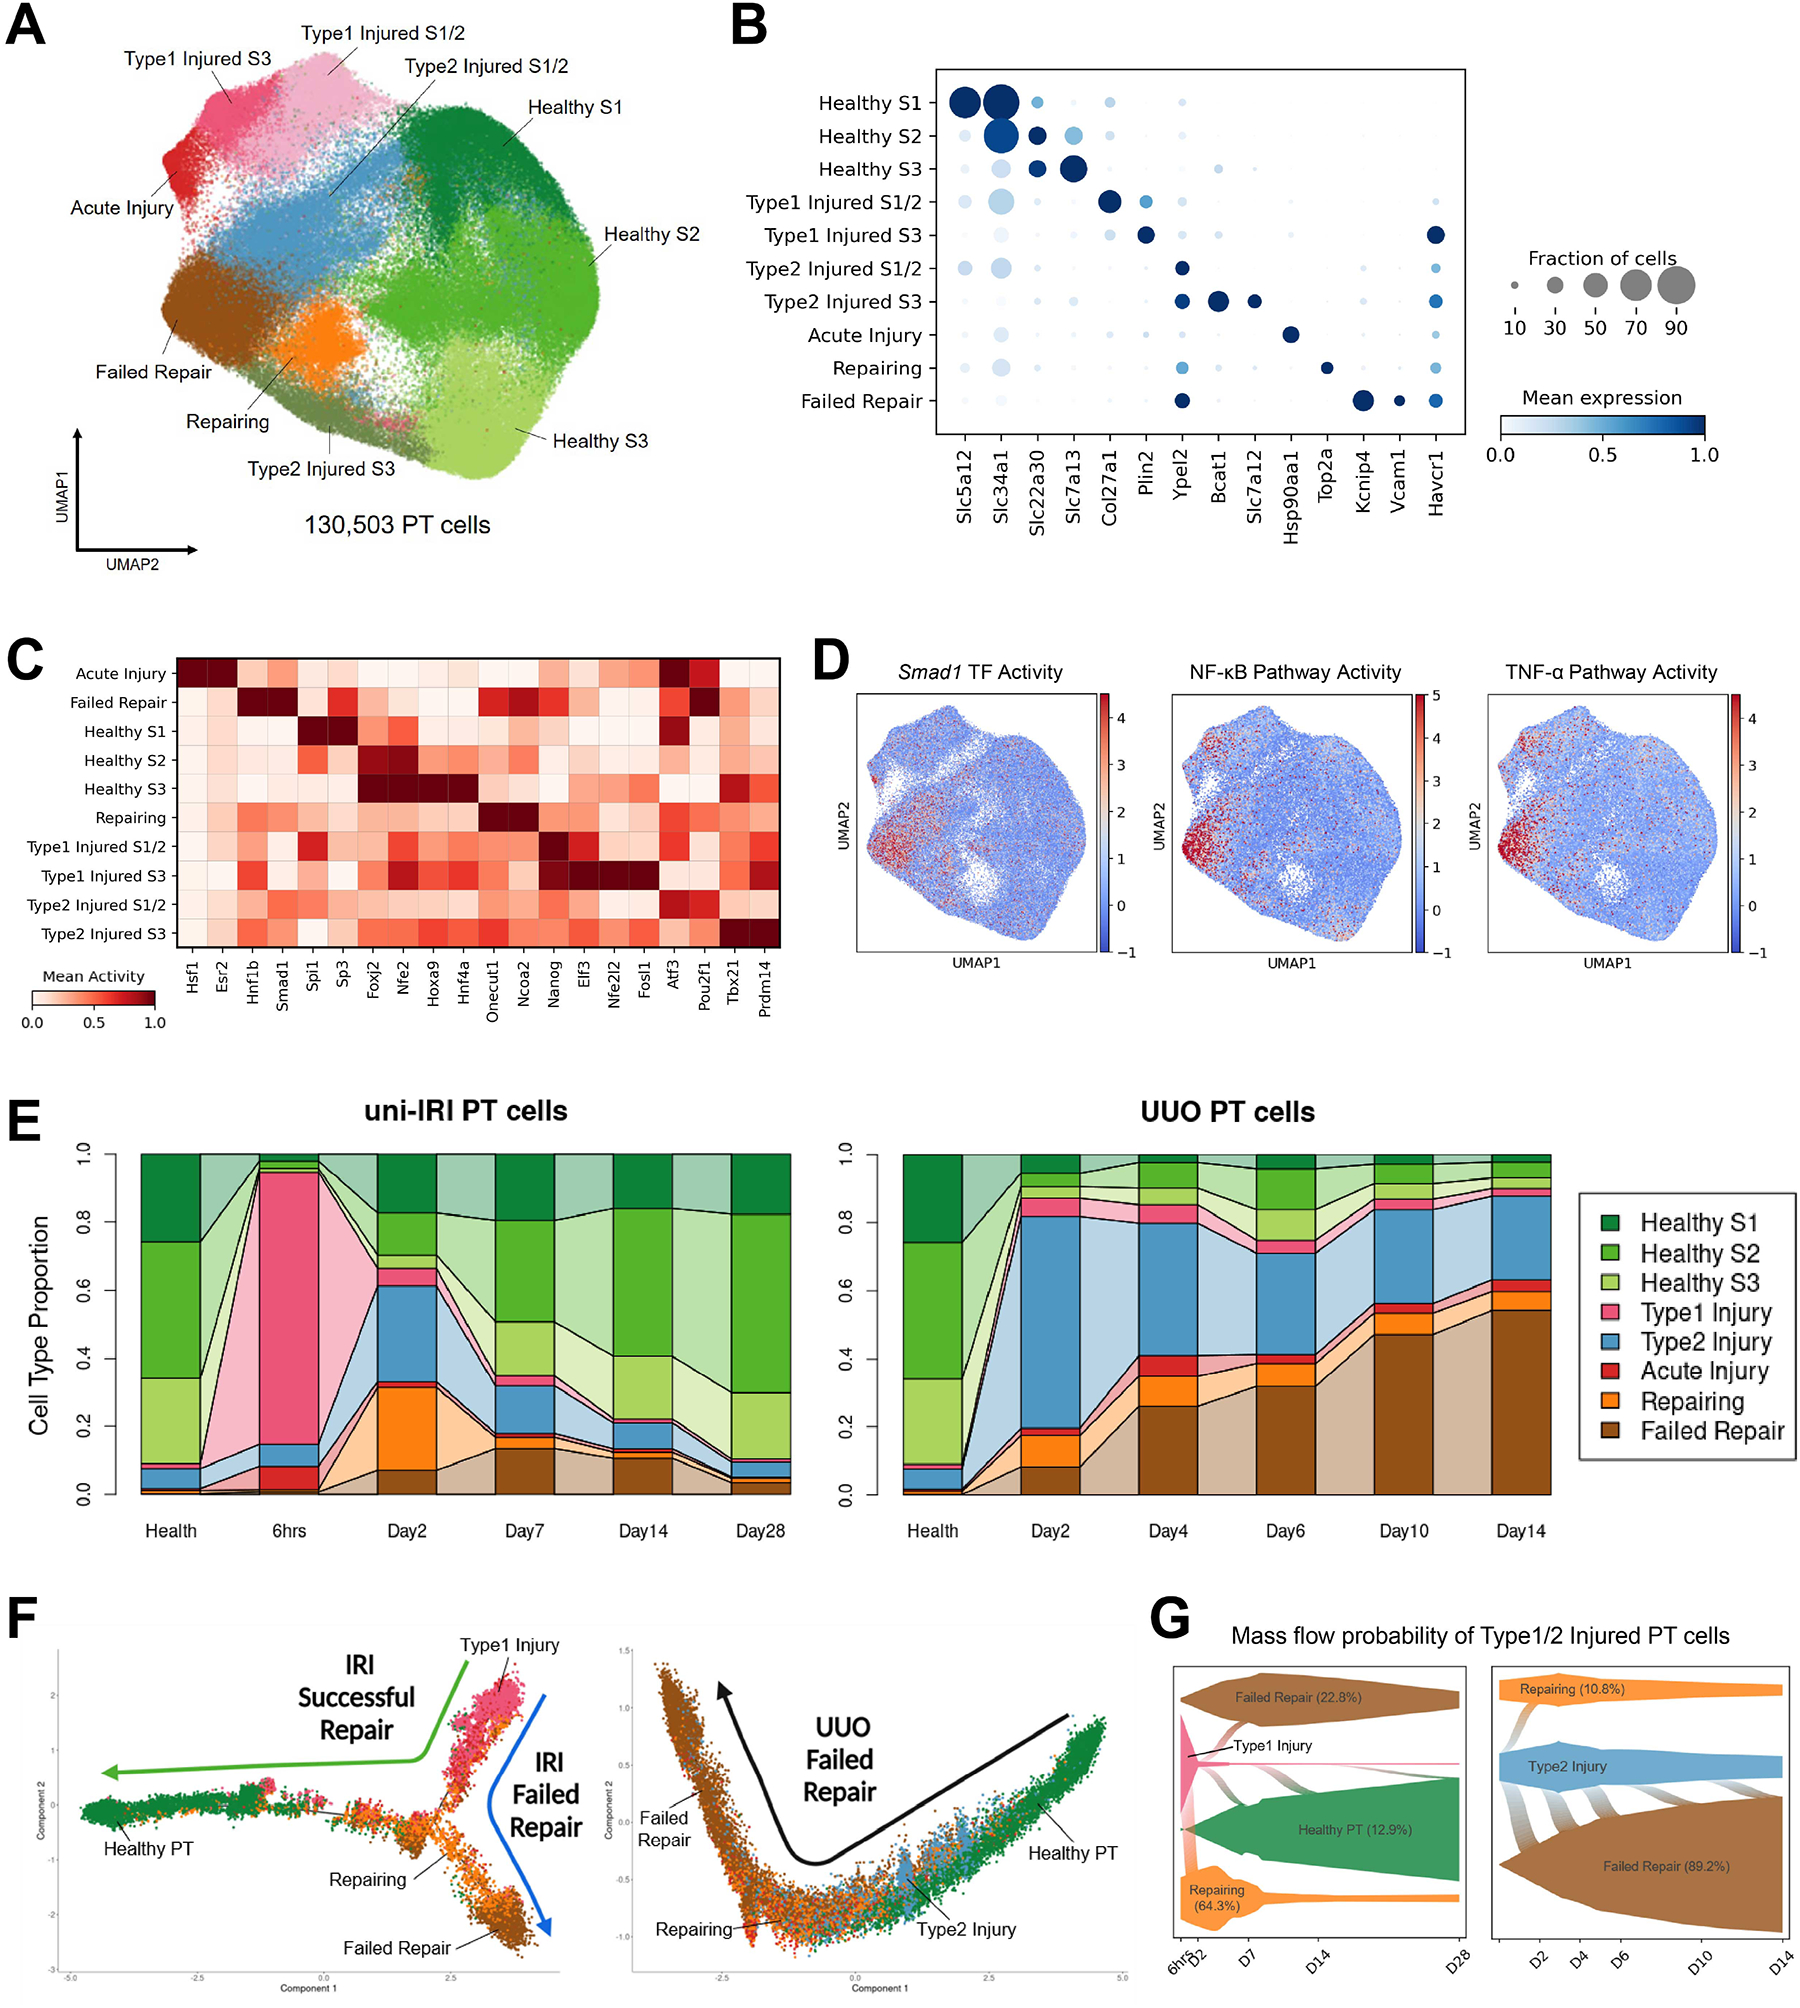
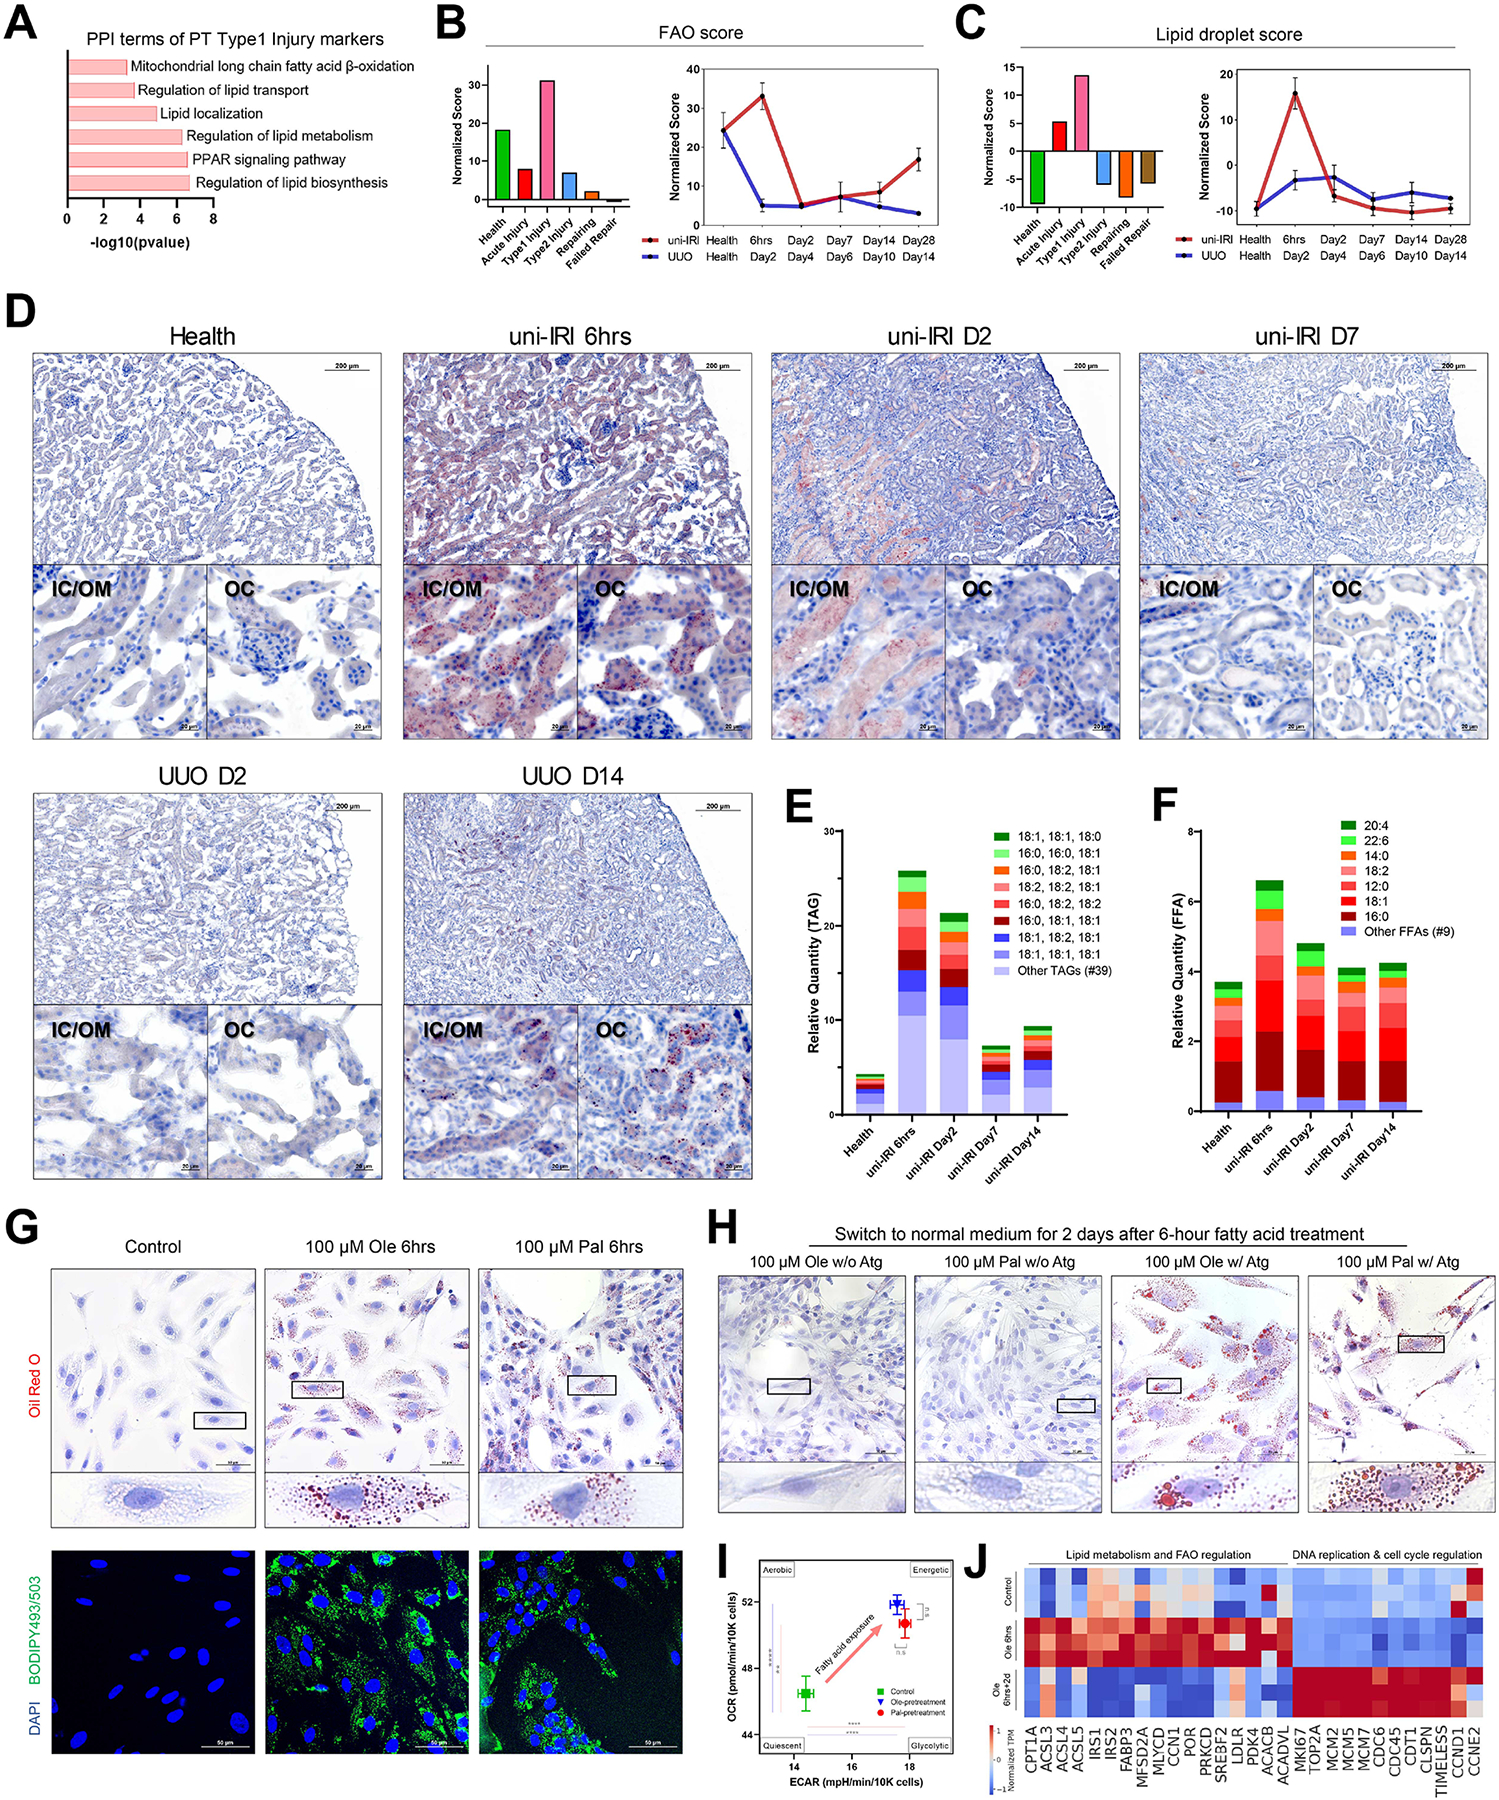
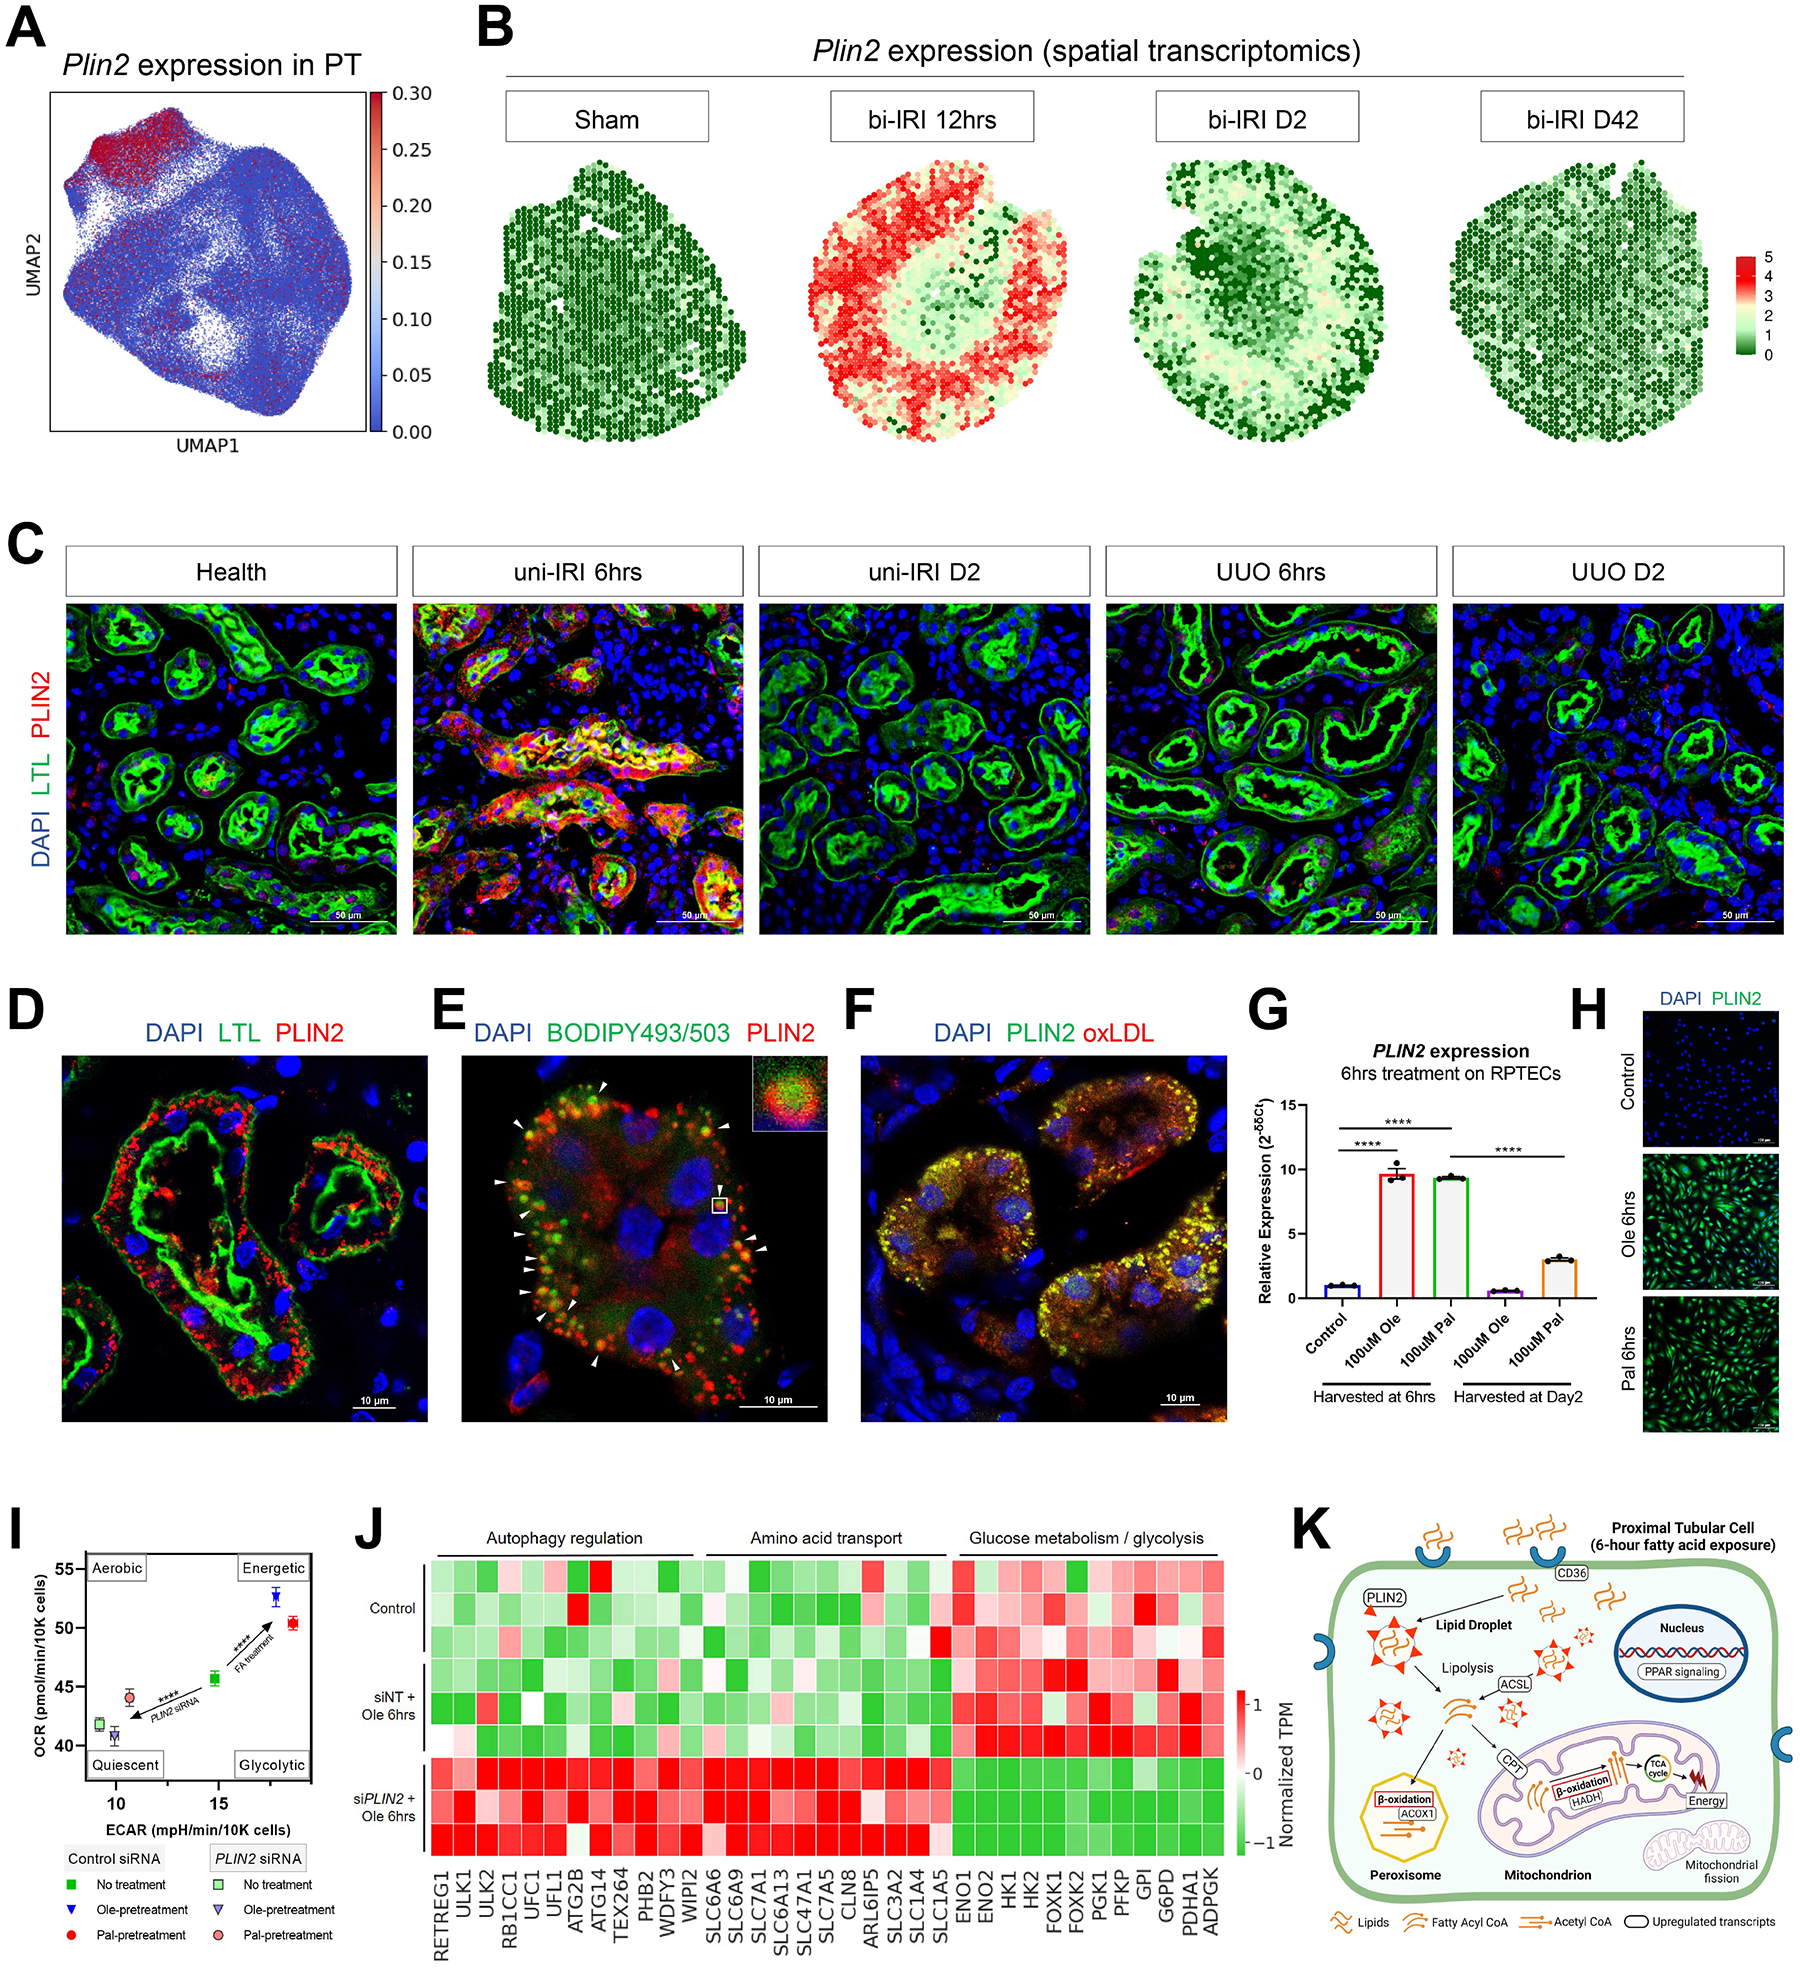
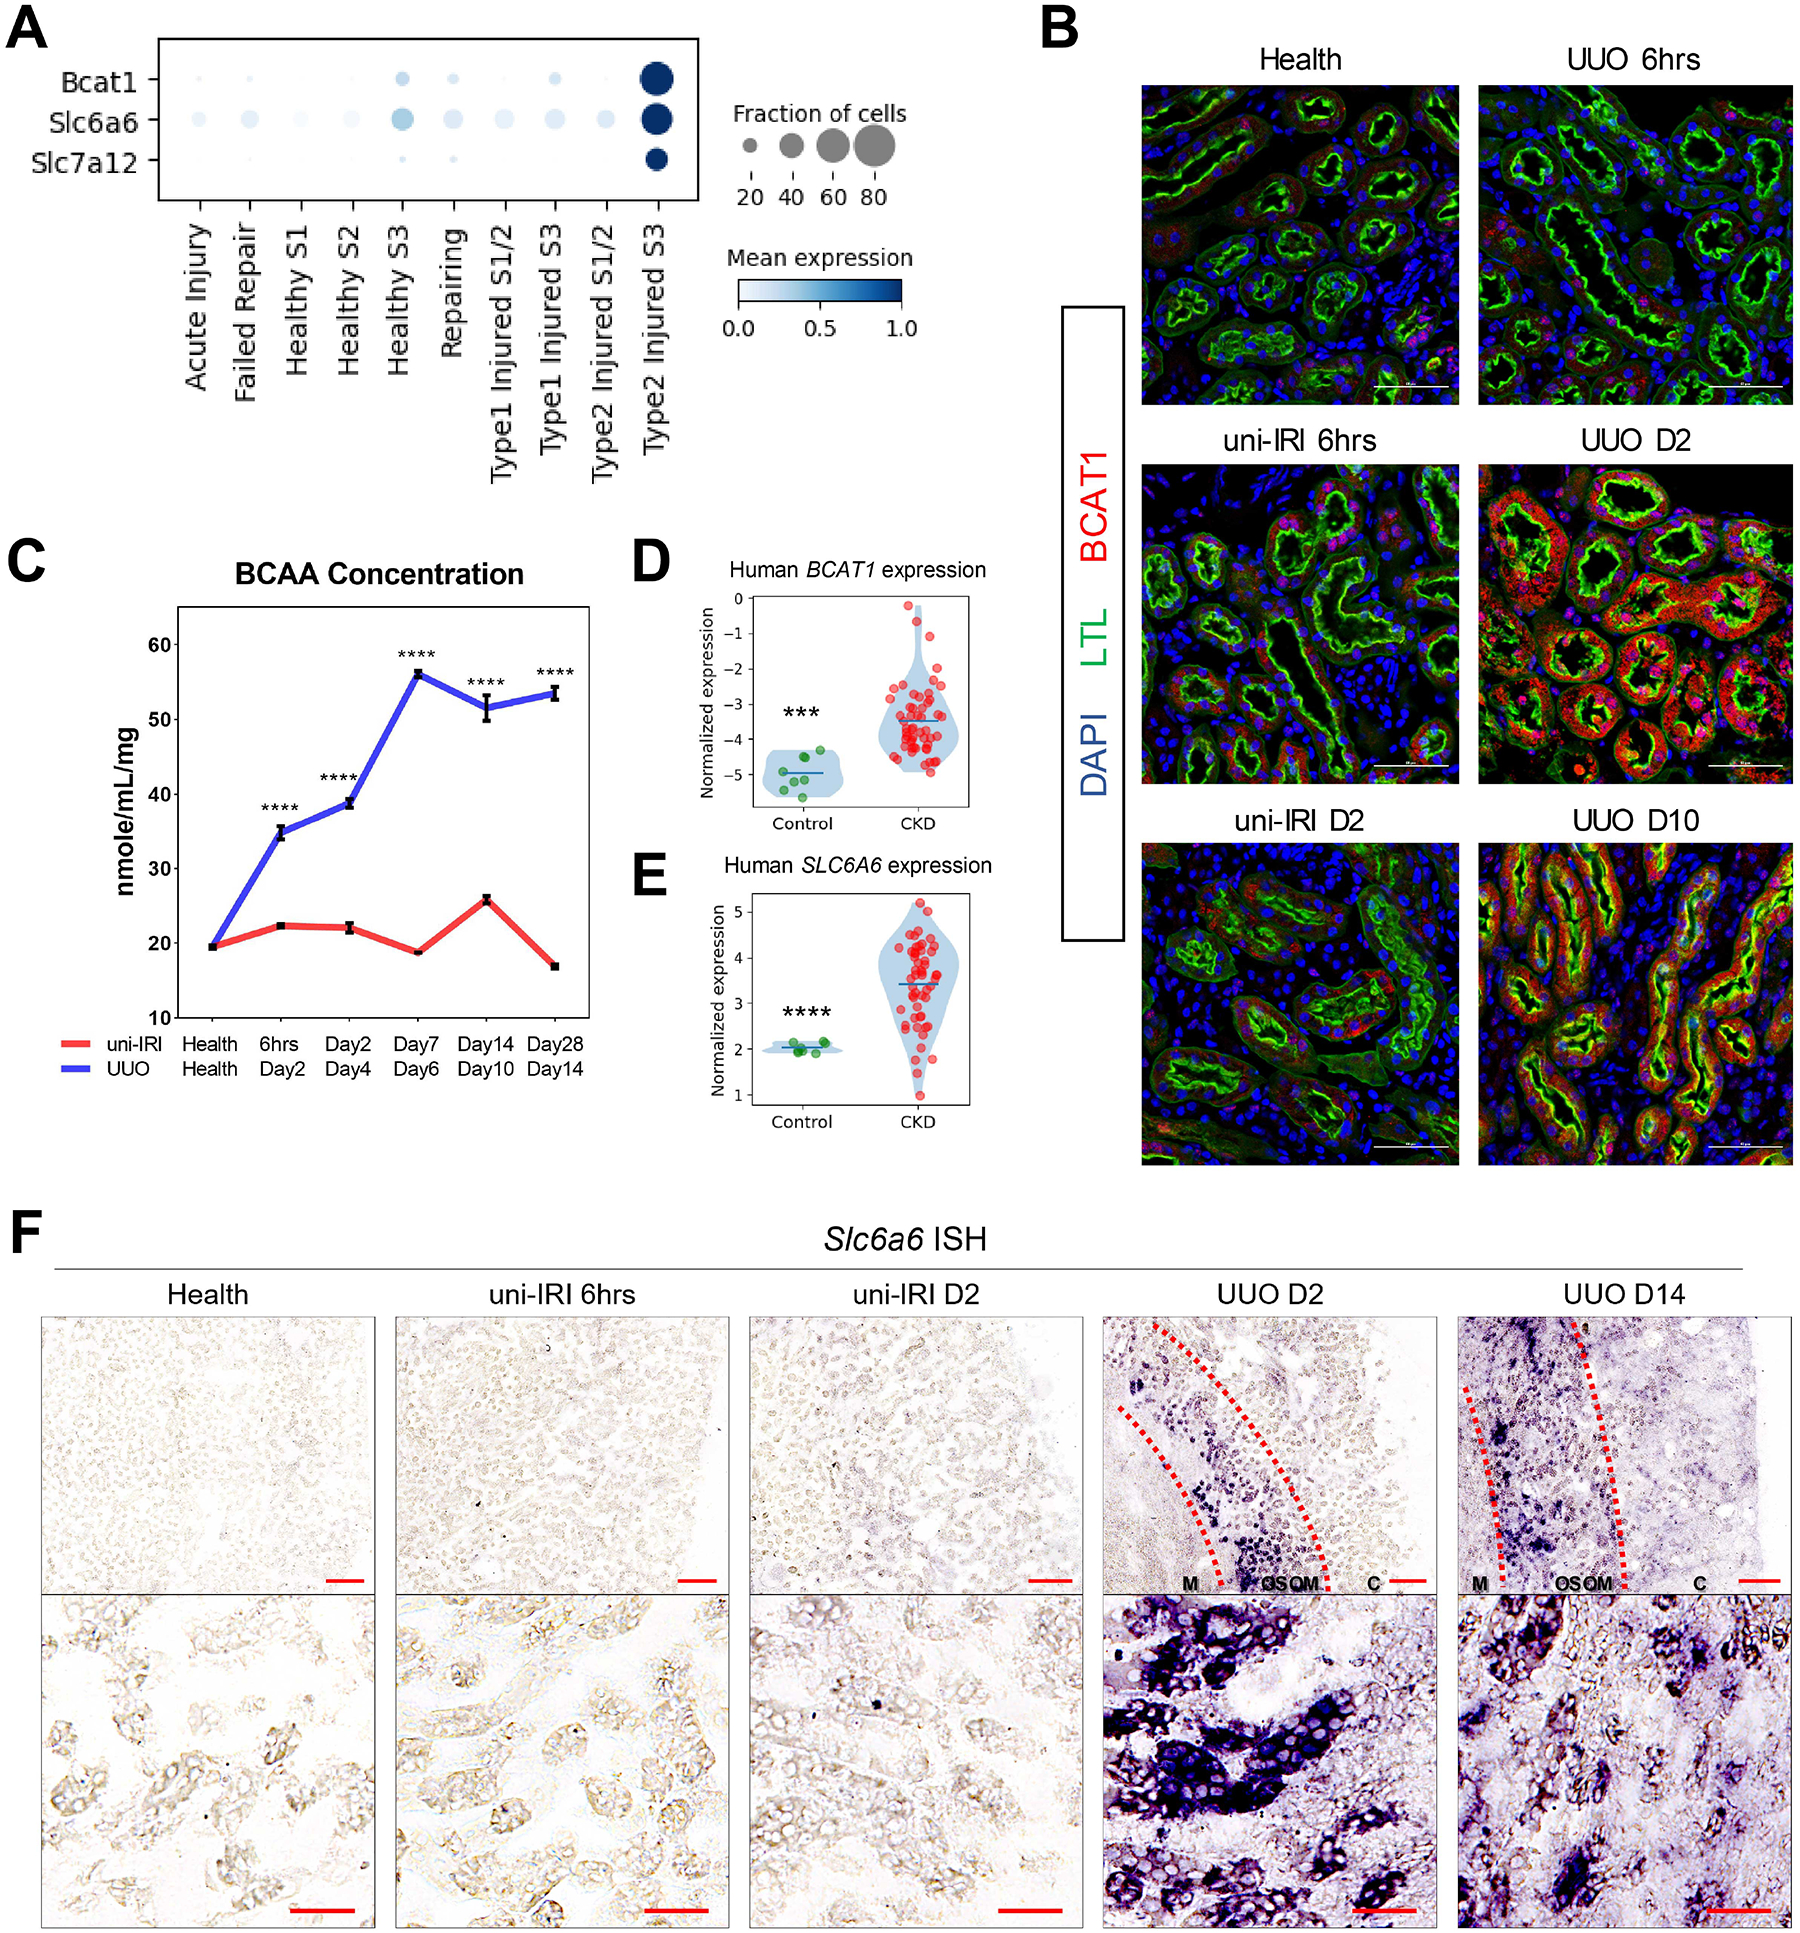
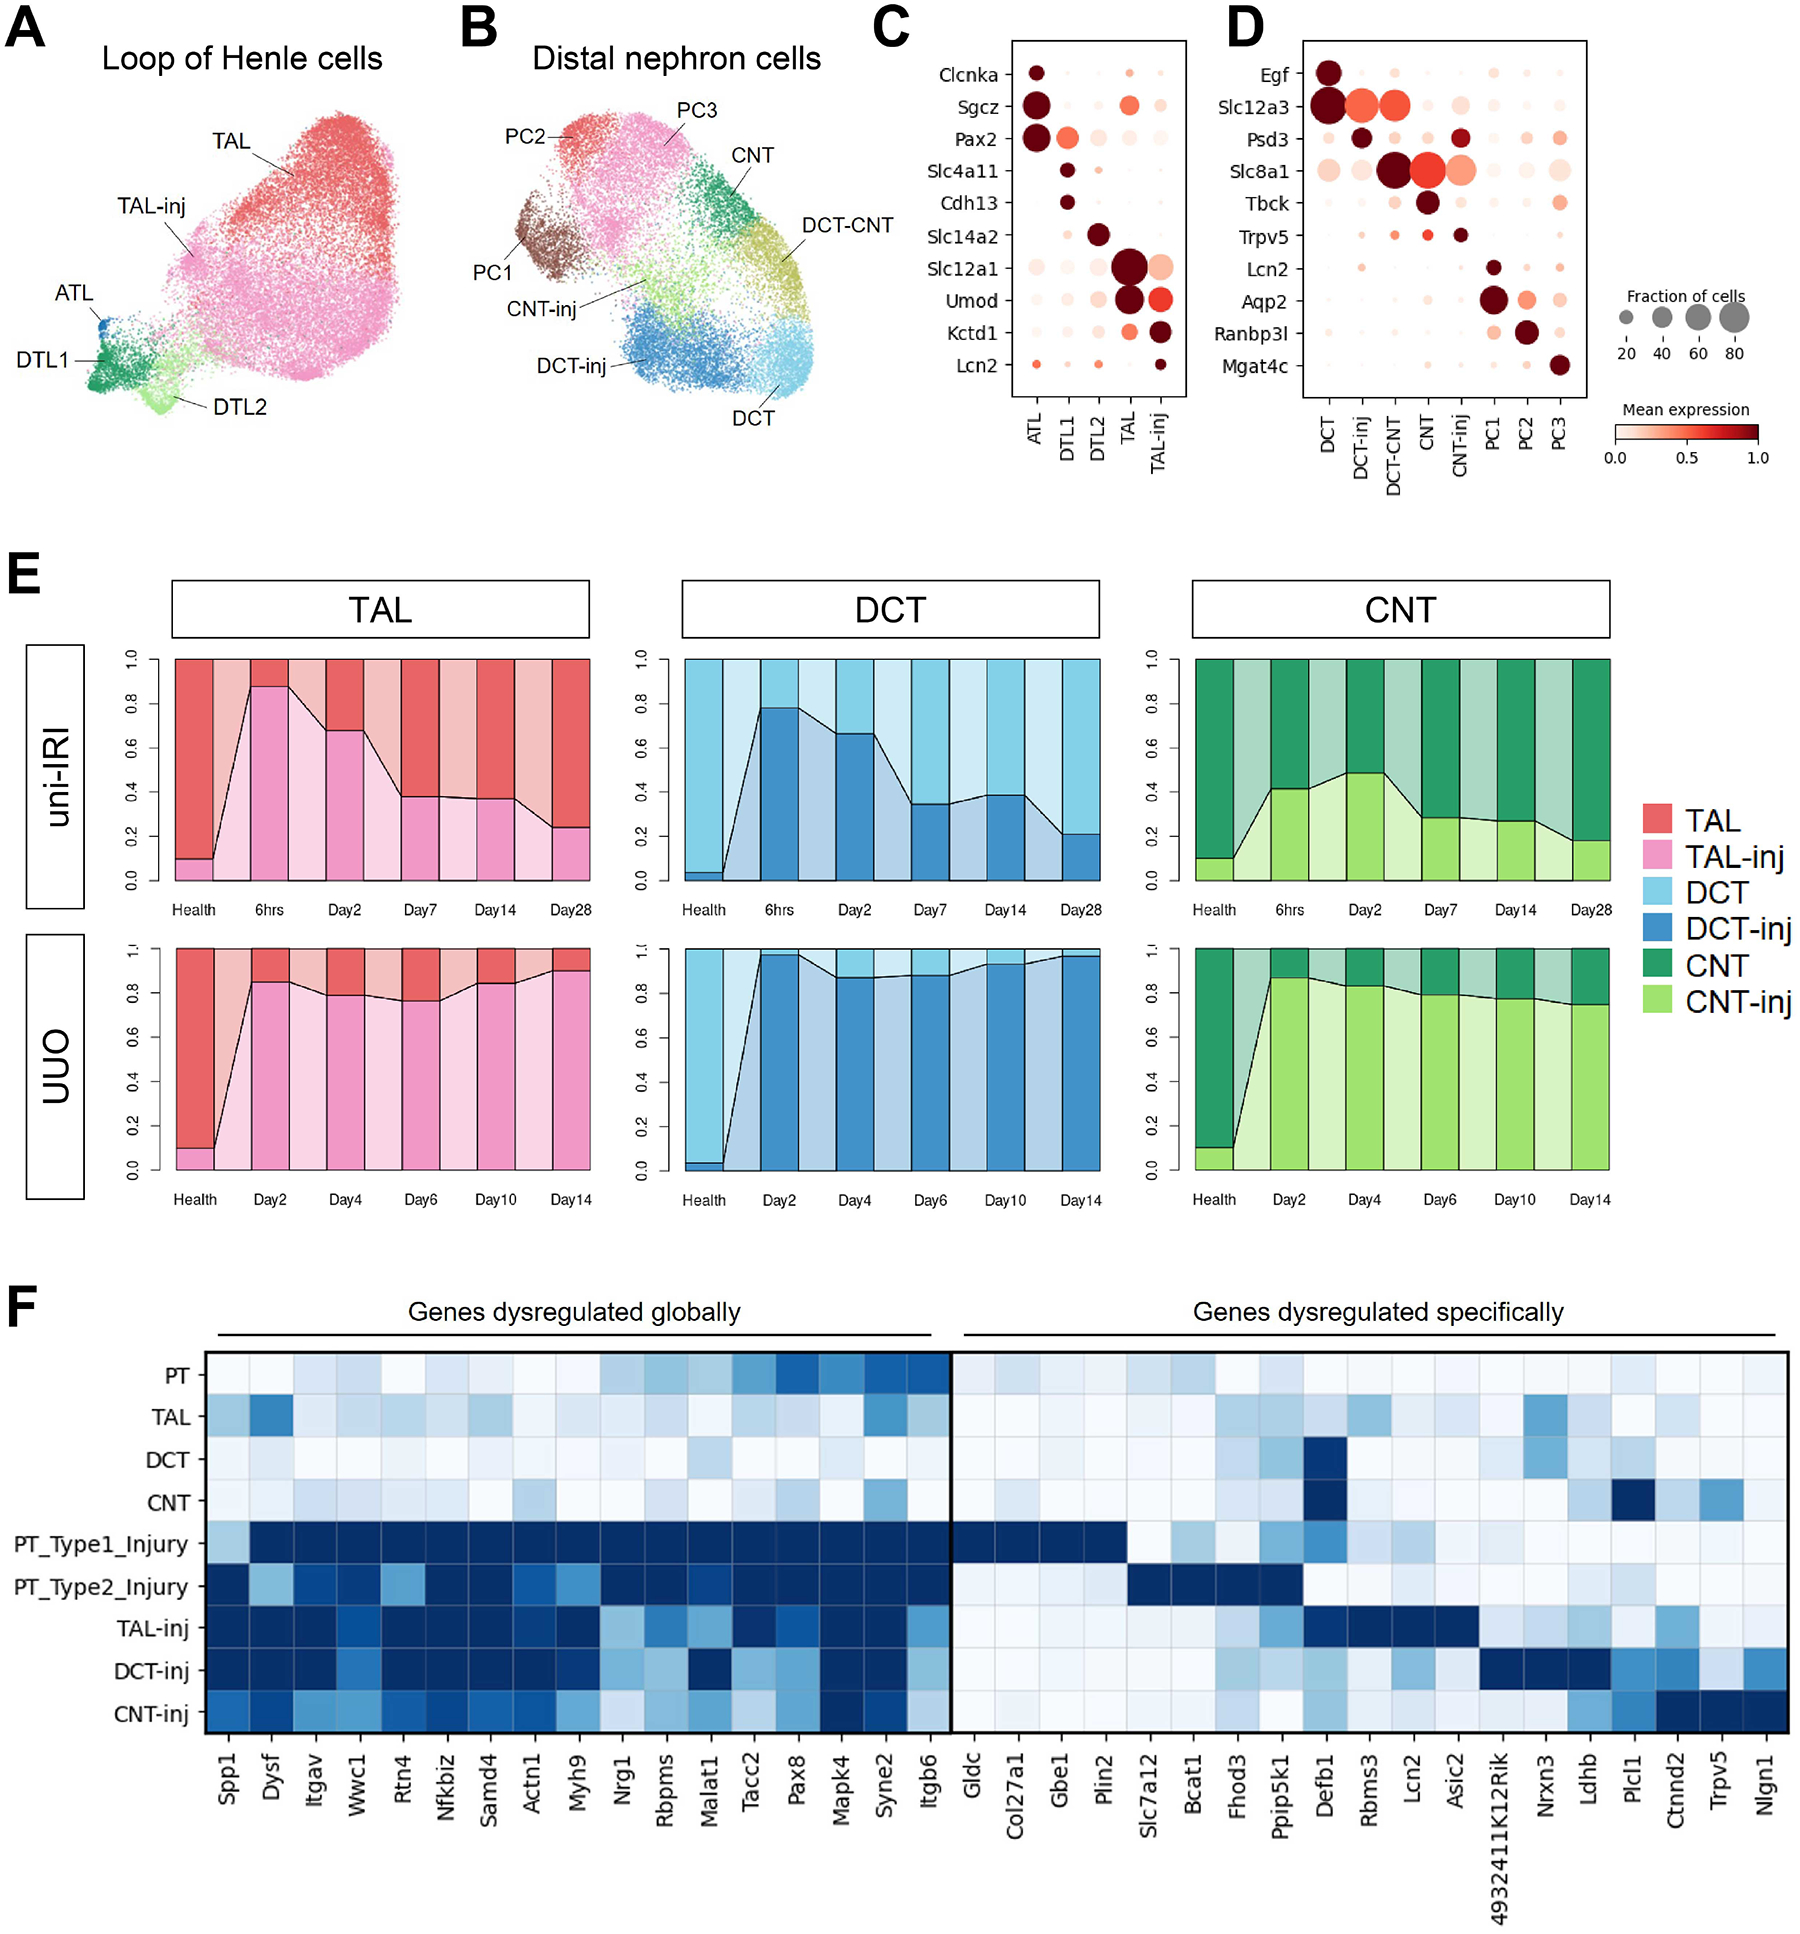
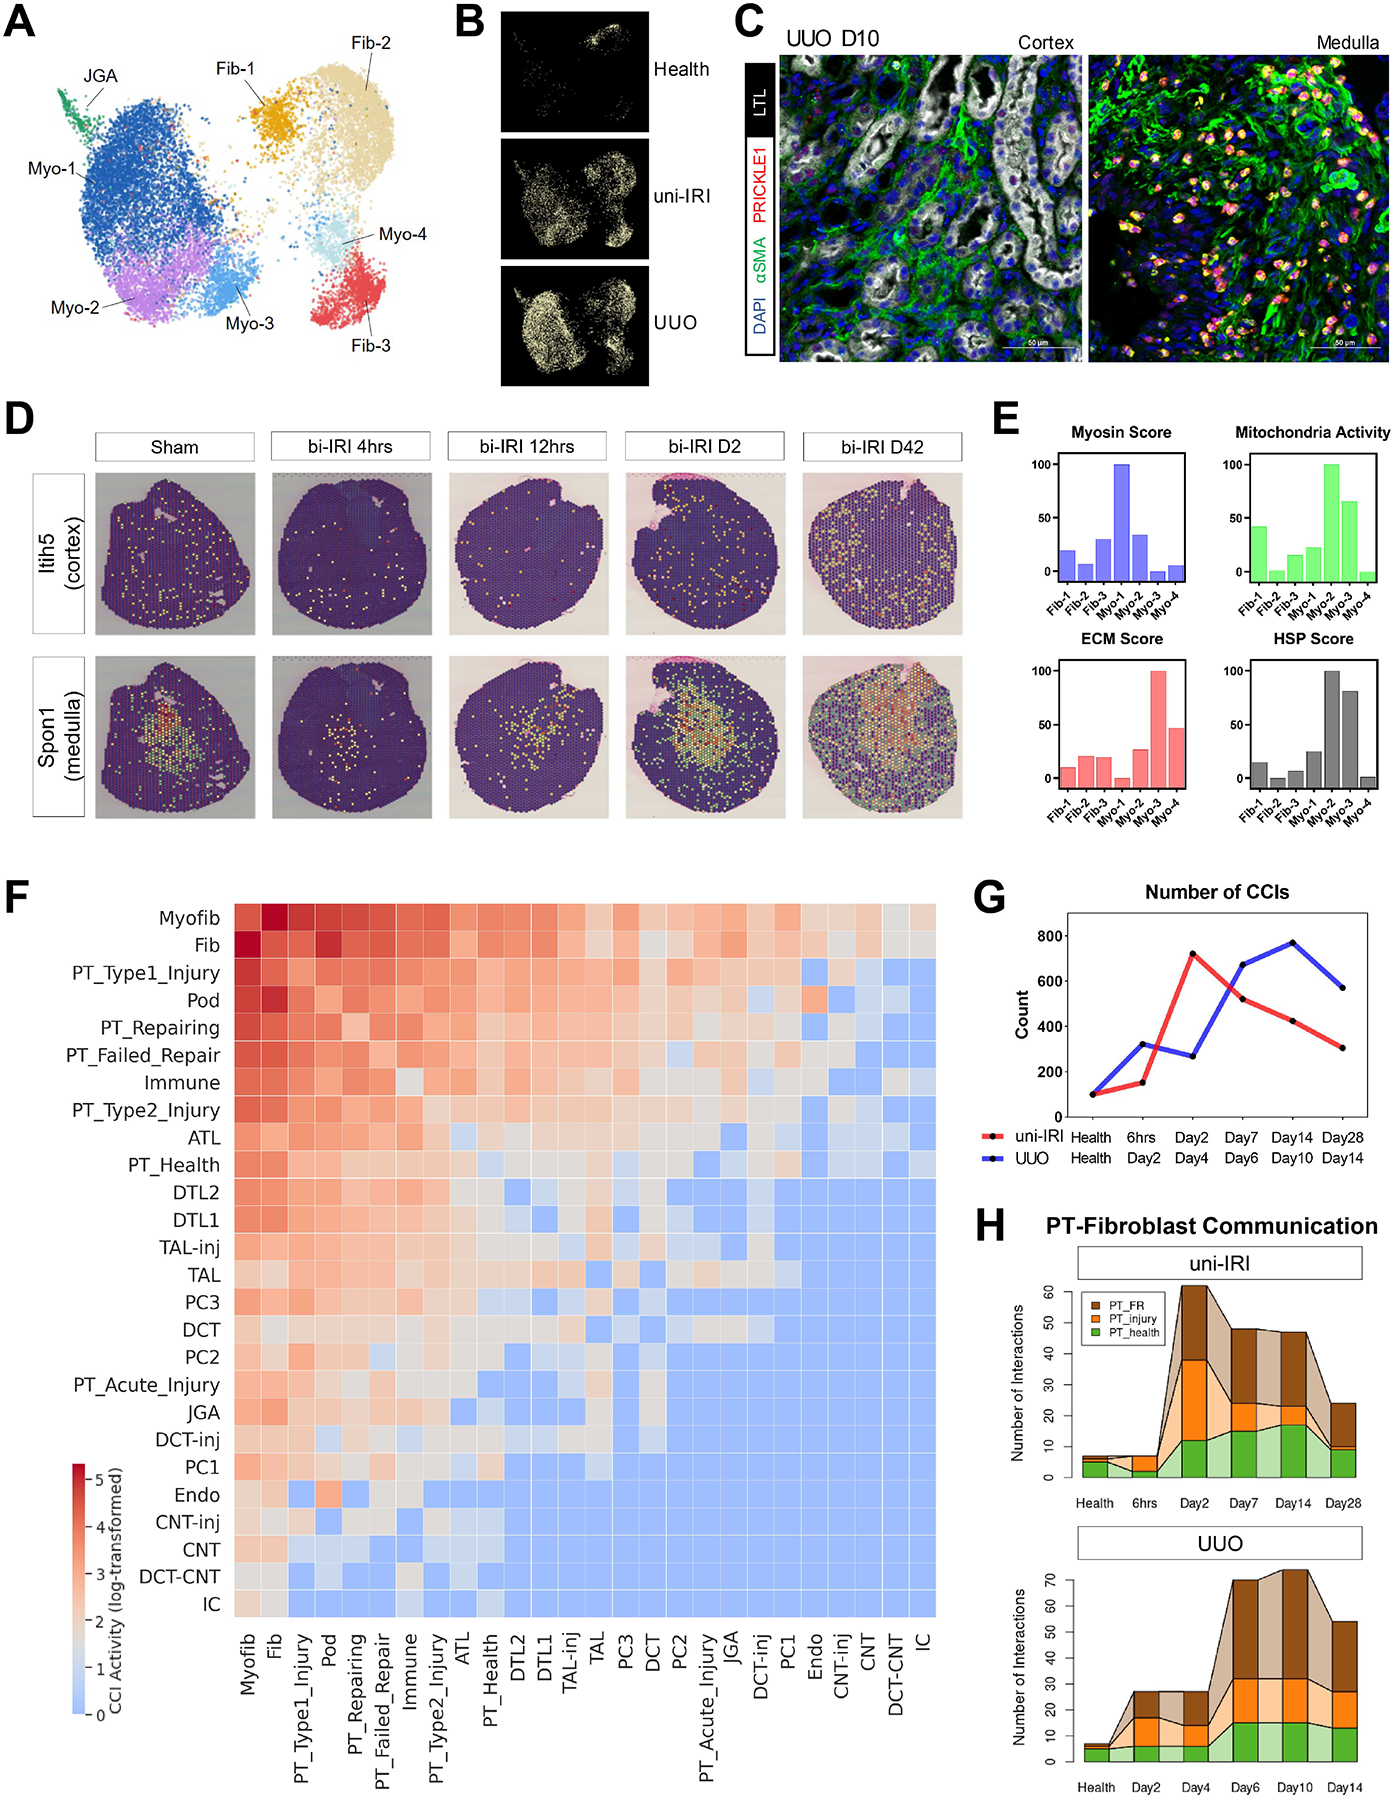
The underlying cellular events driving kidney fibrogenesis and metabolic dysfunction are incompletely understood. Here, we employed single-cell combinatorial indexing RNA sequencing to analyze 24 mouse kidneys from two fibrosis models. We profiled 309,666 cells in one experiment, representing 50 cell types/states encompassing epithelial, endothelial, immune, and stromal populations. Single-cell analysis identified diverse injury states of the proximal tubule, including two distinct early-phase populations with dysregulated lipid and amino acid metabolism, respectively. Lipid metabolism was defective in the chronic phase but was transiently activated in the very early stages of ischemia-induced injury, where we discovered increased lipid deposition and increased fatty acid β-oxidation. Perilipin 2 was identified as a surface marker of intracellular lipid droplets, and its knockdown in vitro disrupted cell energy state maintenance during lipid accumulation. Surveying epithelial cells across nephron segments identified shared and unique injury responses. Stromal cells exhibited high heterogeneity and contributed to fibrogenesis by epithelial-stromal crosstalk.

Keywords: PLIN2; acute kidney injury; cell differentiation; chronic kidney disease; fibrosis; kidney; lipid droplet; lipid metabolism; single-cell combinatorial indexing; tissue regeneration.


Conflict of interest statement

Declaration of interests B.D.H. is a consultant for Janssen Research & Development, LLC, Pfizer, and Chinook Therapeutics and holds equity in Chinook Therapeutics and grant funding from Chinook Therapeutics, Janssen Research & Development, LLC, and Pfizer; all interests are unrelated to the current work.

Figures

Figure 1.
Figure 1.. A single-cell transcriptomics landscape of mouse kidney fibrogenesis profiled with sci-RNA-seq3.
(A) Summary of experimental methodology. n = 2 per timepoint. Nuclei were extracted from all kidney samples and profiled with a three-level combinatorial indexing sequencing strategy. Cells were demultiplexed based on 1st indexing barcodes to identify sample origins in data analysis. Figure created with BioRender.com. (B) Immunofluorescence staining of HAVCR1 (red), Collagen Type I (green), Lotus Tetragonolobus Lectin (LTL; white) and DAPI (blue) on tissue sections collected from all healthy and diseased conditions of our study cohort. Scale bar: 50 μm. (C) Pseudobulk trajectory projection (using Monocle2) of all sample conditions in the study cohort revealing distinct transcriptomic signature of uni-IRI and UUO. Each dot represents a sample (n = 24 in total). (D) An atlas of mouse kidney fibrogenesis. A UMAP presentation (center) shows 309,666 cells profiled from 24 individual mouse kidneys of 11 healthy or diseased conditions. The surrounding circular layouts indicate the cell number of each population (log10-transformed scale bar), 19 major cell types (outer layout) and distributions of 11 group conditions in each cell type (inner layout; color legend same as Figure 1C). PT, proximal tubule; PT-Inj, injured PT; PT-R, repairing PT; FR-PTC, failed repair PT cells; PT-AcInj, acute injury PT; DTL, descending limb of loop of Henle (LoH); ATL, thin ascending limb of LoH; TAL, thick ascending limb of LoH; DCT, distal convoluted tubule; CNT, connecting tubule; PC, principal cell of collecting duct; ICA, type A intercalated cell of collecting duct; ICB, type B intercalated cell of collecting duct; Pod, podocyte; EC, endothelial cell; Fib, fibroblast; Myofib, myofibroblast; Ma, macrophage (Mφ); B/T, immune cell; Uro, urothelium. (E) Dot plot showing expression pattern of cluster-specific marker genes and bar plot showing the number of cells of each cluster. In the dot plot, the diameter of the dot corresponds to the proportion of cells expressing the indicated gene and the density of the dot corresponds to average expression relative to all cell types.
Figure 2.
Figure 2.. Diverse cell states of injured proximal tubule.
(A) UMAP plot of all PT cells after quality control in subclustering analysis. S1, S2 and S3 indicate the three anatomical segments of PT. (B) Dot plot showing expression of marker genes of each PT cell clusters, including 3 clusters in healthy states and 7 injured cell states expressing Havcr1. (C) Heat map showing cluster-specific transcription factor activity predicted by gene regulatory network analysis. Color density corresponds to average activity of the indicated gene relative to all PT cells. (D) Transcription factor activity and single-cell pathway analysis showing activities of Smad1 and NF-κB/TNF-α pathways are enriched in the FR-PTC cluster. (E) Connected bar plots displaying the proportional abundance of each cell cluster in each disease condition. Injured S1/2 and S3 cells are combined for the convenience of data visualization. (F) Pseudotemporal ordering of cells sampled from uni-IRI and UUO subsets colored by cluster identity (color legend same as Figure 2E), using Monocle2. (G) Single-cell fate mapping of Type1 and Type2 injured PT cells (color legend same as Figure 2E), using CellRank. Flows connecting two cell types describe lineage transition and the flow width indicate predicted probability. See also Figure S2K.
Figure 3.
Figure 3.. Dysregulated lipid metabolism in proximal tubule cells during fibrogenesis and activated fatty acid oxidation after short-term lipid deposition.
(A) Protein-protein interaction (PPI) enrichment analysis on upregulated differentially expressed genes of Type1 injured PT cells showing terms associated with lipid metabolism. (B-C) Gene module activity scores of FAO (B) and lipid droplets (C) in different PT clusters (all time points) (left panels) and across the time courses of uni-IRI and UUO (right panels), where each dot indicates mean score of two samples of a group condition and data are shown as the mean ± SEM. (D) Oil Red O staining on multiple group conditions identifying transient accumulation of lipids at uni-IRI 6hrs, clearance of lipids after uni-IRI D2 and lipid accumulation at late stages of UUO. Regions of inner cortex or outer medulla (IC/OM) and outer cortex (OC) are shown. Red color indicates lipids and blue indicates cell nucleus. See also Figure S3C. (E) Relative quantity of triglyceride (TAG) species in mouse kidney tissues of different group conditions. The most abundant 8 TAG species are presented and the other species are combined and annotated as ‘Other TAGs’. See also Figure S3D. (F) Relative quantity of free fatty acid (FFA) species in mouse kidney tissues of different group conditions. The most abundant 7 FFA species are presented and the other species are combined and annotated as ‘Other FFAs’. See also Figure S3D. (G) Oil Red O staining (upper panels) and BODIPY493/503 staining (lower panels) on RPTECs after 6-hour treatment of 100 μM BSA-conjugated oleate (Ole) or palmitate (Pal) fatty acids. Scale bars: 50 μm. Zoom-in figures of a single cell are also presented for Oil Red O staining, which demonstrates accumulation of lipid droplets after treatment. (H) Oil Red O staining on RPTECs which were exposed to culture medium without fatty acid supplements after 6-hour of 100 μM oleate or palmitate fatty acid treatment, with (w/) or without (w/o) Atglistatin (Atg) treatment. Scale bars: 50 μm. Zoom-in figures of a single cell are also presented. (I) Energy map presenting an increased OCR and ECAR at the basal condition after 6-hour 100 μM oleate or palmitate fatty acid pretreatment on RPTECs. OCR and ECAR readouts are normalized by cell numbers. Data are shown as the mean ± SEM. The four energy states were annotated as previously described. **p < 0.01, ****p < 0.0001 and n.s (not significant) by Student’s t test. (J) Heat map showing expression of genes involved in lipid metabolism & FAO regulation and DNA replication & cell cycle regulation in RPTECs with control and 6-hour 100 μM oleic acid (Ole 6hrs) treatments and harvested at 2 days after the 6-hour treatment (Ole 6hrs+2d). Each group has three biological replicates. Transcript per million (TPM) is normalized for visualization.
Figure 4.
Figure 4.. PLIN2 marks lipid droplets in Type1 injured proximal tubule and maintains cell energy state.
(A) Specific expression of Plin2 in Type1 injured PT cells. (B) Revisiting a spatial transcriptomics dataset on female bi-IRI kidneys identifying transient upregulation of Plin2 at kidney cortex in early stages. Each spot of a tissue section is colored by gene expression. (C) Specific upregulation of PLIN2 in PT at uni-IRI 6hrs validated by immunofluorescence staining of PLIN2 (red), LTL (green) and DAPI (blue) on multiple group conditions. Scale bars: 50 μm. (D) Immunofluorescence staining of PLIN2 (red), LTL (green) and DAPI (blue) on a tissue section collected from uni-IRI 6hrs showing presence of intracellular PLIN2+ droplets. Scale bar: 10 μm. (E) Immunofluorescence staining of PLIN2 (red), BODIPY493/503 (green) and DAPI (blue) on a uni-IRI 6hrs tissue section showing localization of PLIN2 at the surface of lipid droplets. Scale bar: 10 μm. A single droplet was encircled and presented in the top-right panel. (F) Immunofluorescence staining of PLIN2 (green), oxidized low-density lipoprotein (oxLDL; red) and DAPI (blue) on a uni-IRI 6hrs tissue section showing PLIN2 colocalizes with oxLDL. Scale bar: 10 μm. (G) Relative expression of PLIN2 in RPTECs after 6-hour oleate (Ole) or palmitate (Pal) fatty acid exposure or at 2 days after removal of the fatty acids from culture medium, measured by qPCR. Data are shown as the mean ± SEM. ****p < 0.0001 by Student’s t test. (H) Immunostaining of PLIN2 (green) and DAPI (blue) on RPTECs after 6-hour oleate or palmitate fatty acid treatment. Scale bar: 100 μm. (I) Energy map presenting an increased OCR and ECAR after 6-hour fatty acid pretreatment, as well as a decreased OCR and ECAR after PLIN2 knockdown on RPTECs. OCR and ECAR readouts are normalized by cell numbers. Data are shown as the mean ± SEM. Comparisons were made between No treatment and combined oleate & palmitate fatty acid-pretreatment (Control siRNA), and between No treatment with Control siRNA and No treatment with PLIN2 siRNA. The four energy states were annotated as previously described. ****p < 0.0001 by Student’s t test. (J) Heat map showing expression of genes involved in autophagy, amino acid transport and glucose metabolism in RPTECs with non-targeting siRNA (control) and 6-hour 100 μM oleic acid (siNT+Ole 6hrs) treatments and in cells treated with PLIN2 siRNA and 6-hour 100 μM oleic acid (siPLIN2+Ole 6hrs). Each group has three biological replicates. TPM expression is normalized for visualization. (K) Proposed model of activated lipid metabolisms in Type1 injured PT cells. CD36 is a transporter of long-chain fatty acids. Intracellular fatty acids aggregate and form lipid droplets with PLIN2 as a surface protein. Fatty acyl-CoA (Coenzyme A) is converted from lipids through ACSL-mediated lipolysis or lipophagy and used in ACOX1-mediated peroxisomal β-oxidation or CPT-mediated mitochondrial β-oxidation, which can generate acetyl CoA, the substrate of tricarboxylic acid (TCA) cycle to produce energy. PPAR signaling is the main regulator of the lipid metabolism pathway and mitochondrial fission is involved in lipid accumulation. Figure created with BioRender.com.
Figure 5.
Figure 5.. Dysregulation of genes involved in amino acid metabolisms in Type2 injured PT cells.
(A) Dot plot showing that three amino acid metabolism-associated genes, Bcat1, Slc6a6 and Slc7a12, were specifically upregulated in Type2 injured PT. (B) Specific upregulation of BCAT1 in PT after UUO validated by immunofluorescence staining of BCAT1 (red), LTL (green) and DAPI (blue) on multiple group conditions. Outer medulla regions are presented. Scale bars: 50 μm. (C) Concentrations of branched-chain amino acids (BCAA) measured in mouse cortical tissues across all group conditions of this study cohort showing significantly increased BCAA concentration in UUO kidneys. Data are shown as the mean ± SEM. ****p < 0.0001 by Student’s t test. (D-E) Violin plots showing increased expression of BCAT1 (D) and SLC6A6 (E) in biopsy samples of patients with CKD than controls. (F) Representative images of RNA in situ hybridization staining of Slc6a6 on multiple group conditions revealing gene upregulation in UUO. Scale bars: 200 μm for the upper panel and 50 μm for the lower panel. Cortical (C), outer stripe of the outer medulla (OSOM) and medullary (M) regions were highlighted. See also Figure S5E.
Figure 6.
Figure 6.. Shared and unique injury responses of renal tubular epithelial cells.
(A-B) UMAP plots of cells of LoH (A) and DCT, CNT and PC (B) in subclustering analysis. Abbreviations of cell types have been described in Figure 1D. (C-D) Dot plots showing expression of genes specific to cell clusters identified in Figure 6A–B. Visualization was performed on dataset combining both uni-IRI and UUO subsets. (E) Connected bar plots displaying the proportional abundance of healthy and injured TECs (including TAL, DCT and CNT) in each group condition, which identifies a shared injury response of TECs in an insult-dependent manner. (F) Heat maps presenting expression of genes that are either co-varied across all injured TECs or dysregulated in a cell-type-specific manner compared to the healthy state of each TEC.
Figure 7.
Figure 7.. Heterogeneity of kidney stromal cells and cell-cell communications in kidney fibrogenesis.
(A) UMAP plot of all stromal subtypes identified in subclustering analysis. Fib, fibroblast; Myo, myofibroblast; JGA, juxtaglomerular apparatus. See also Figure S7A. (B) Condition map showing unique distribution of stromal cells in different experimental groups. (C) Immunofluorescence staining of DAPI (blue), α-SMA (i.e., ACTA2) (green), PRICKLE1 (red) and LTL (white) on a tissue section collected from UUO D10 identifying PRICKLE1 expression on nuclear membranes of myofibroblasts in kidney medulla. Scale bars: 50 μm. (D) Expression of two region-specific genes in a spatial transcriptomics dataset on female bi-IRI kidneys. Each spot of a tissue section is colored by gene expression. See also Figure S7D. (E) Gene module activities on myosin, mitochondrial respiratory chain reactions, extracellular matrix (ECM) and heat-shock proteins (HSP) in each stromal subtype. Gene module scores are shown as means. For the convenience of data visualization, normalization is performed by adjusting the lowest score of each module as 0. (F) Heat map showing the number of significant ligand-receptor pairs in cell-cell interaction (CCIs) analysis, predicted by CellPhoneDB, between major kidney cell types. Log-transformed data are shown. Populations with similar transcriptomics are combined for the convenience of data visualization. (G) Numbers of significant CCIs identified by CellPhoneDB across the time courses of uni-IRI and UUO. (H) Connected bar plots displaying the number of significant CCIs between (myo)fibroblasts and PT cells in each group condition. Fibroblast and myofibroblast are combined to increase robustness of data analysis. PT_injury combines PT-AcInj, PT-R and Type1/2 injured PT cells.

Comment in

References

    1. Abe J. ichi, Ko KA, Kotla S, Wang Y, Paez-Mayorga J, Shin IJ, Imanishi M, Vu HT, Tao Y, Leiva-Juarez MM, Thomas TN, Medina JL, Won JH, Fujii Y, Giancursio CJ, McBeath E, Shin JH, Guzman L, Abe RJ, Taunton J, Mochizuki N, Faubion W, Cooke JP, Fujiwara K, Evans SE, Le NT, 2019. MAGI1 as a link between endothelial activation and ER stress drives atherosclerosis. JCI insight 4. 10.1172/JCI.INSIGHT.125570 - DOI - PMC - PubMed
    1. Adeva MM, Calviño J, Souto G, Donapetry C, 2011. Insulin resistance and the metabolism of branched-chain amino acids in humans. Amin. Acids 2011 431 43, 171–181. 10.1007/S00726-011-1088-7 - DOI - PubMed
    1. Anders S, Pyl PT, Huber W, 2015. HTSeq—a Python framework to work with high-throughput sequencing data. Bioinformatics 31, 166. 10.1093/BIOINFORMATICS/BTU638 - DOI - PMC - PubMed
    1. Balzer MS, Rohacs T, Susztak K, 2021. How Many Cell Types Are in the Kidney and What Do They Do? 10.1146/annurev-physiol-052521-121841 84. 10.1146/ANNUREV-PHYSIOL-052521-121841 - DOI - DOI - PMC - PubMed
    1. Bolisetty S, Zarjou A, Agarwal A, 2017. Heme Oxygenase 1 as a Therapeutic Target in Acute Kidney Injury. Am. J. Kidney Dis 69, 531–545. 10.1053/J.AJKD.2016.10.037 - DOI - PMC - PubMed

Publication types