Lipomatous Metaplasia Enables Ventricular Tachycardia by Reducing Current Loss Within the Protected Corridor
- PMID: 36266004
- PMCID: PMC11148646
- DOI: 10.1016/j.jacep.2022.07.005
Lipomatous Metaplasia Enables Ventricular Tachycardia by Reducing Current Loss Within the Protected Corridor
Abstract
Background: Post-myocardial infarction ventricular tachycardia (VT) is due to re-entry through surviving conductive myocardial corridors across infarcted tissue. However, not all conductive corridors participate in re-entry.
Objectives: This study sought to test the hypothesis that critical VT corridors are more likely to traverse near lipomatous metaplasia (LM) and that current loss is reduced during impulse propagation through such corridors.
Methods: Among 30 patients in the Prospective 2-center INFINITY (Intra-Myocardial Fat Deposition and Ventricular Tachycardia in Cardiomyopathy) study, potential VT-viable corridors within myocardial scar or LM were computed from late gadolinium enhancement cardiac magnetic resonance images. Because late gadolinium enhancement highlights both scar and LM, LM was distinguished from scar by using computed tomography. The SD of the current along each corridor was measured.
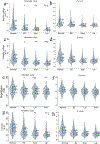
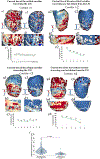
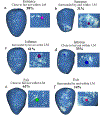
Results: Scar exhibited lower impedance than LM (median Z-score -0.22 [IQR: -0.84 to 0.35] vs -0.07 [IQR: -0.67 to 0.54]; P < 0.001). Among all 381 corridors, 84 were proven to participate in VT re-entry circuits, 83 (99%) of which traversed or were adjacent to LM. In comparison, only 13 (4%) non-VT corridors were adjacent to LM. Critical corridors adjacent to LM displayed lower SD of current compared with noncritical corridors through scar but distant from LM (2.0 [IQR: 1.0 to 3.4] μA vs 8.4 [IQR: 5.5 to 12.8] μA; P < 0.001).
Conclusions: Corridors critical to VT circuitry traverse infarcted tissue through or near LM. This association is likely mediated by increased regional resistance and reduced current loss as impulses traverse corridors adjacent to LM.
Keywords: current loss; fat; impedance; ischemic cardiomyopathy; lipomatous metaplasia; myocardial infarction; ventricular tachycardia.
Copyright © 2022 American College of Cardiology Foundation. Published by Elsevier Inc. All rights reserved.
Conflict of interest statement
Funding Support and Author Disclosures The INFINITY study is funded by National Institutes of Health grant 1R01HL142893-01, as well as support from the Mark Marchlinski Electrophysiology Research and Education Fund. Dr. Marchlinski has served as consultant for Abbott Medical, Biosense Webster, Biotronik, and Medtronic Inc. Dr. Nazarian has served as a consultant for CardioSolv and Circle CVI; and principal investigator for research funding from Biosense Webster, ImriCor, Siemens, ADAS software, and the U.S. National Institutes of Health. The University of Pennsylvania Conflict of Interest Committee manages all commercial arrangements. All other authors have reported that they have no relationships relevant to the contents of this paper to disclose.
Figures


Comment in
-
Ventricular Tachycardia Corridors and Fat.JACC Clin Electrophysiol. 2022 Oct;8(10):1286-1288. doi: 10.1016/j.jacep.2022.08.005. JACC Clin Electrophysiol. 2022. PMID: 36266005 No abstract available.
References
-
- Debakker JMT, Vancapelle FJL, Janse MJ et al. Reentry as a Cause of Ventricular-Tachycardia in Patients with Chronic Ischemic Heart-Disease - Electrophysiologic and Anatomic Correlation. Circulation 1988;77:589–606. - PubMed
-
- Kocovic DZ, Harada T, Friedman PL, Stevenson WG. Characteristics of electrograms recorded at reentry circuit sites and bystanders during ventricular tachycardia after myocardial infarction. J Am Coll Cardiol 1999;34:381–388. - PubMed
-
- Pouliopoulos J, Chik WW, Kanthan A et al. Intramyocardial adiposity after myocardial infarction: new implications of a substrate for ventricular tachycardia. Circulation 2013;128:2296–308. - PubMed
-
- Goldfarb JW, Roth M, Han J. Myocardial fat deposition after left ventricular myocardial infarction: assessment by using MR water-fat separation imaging. Radiology 2009;253:65–73. - PubMed
Publication types
MeSH terms
Substances
Grants and funding
LinkOut - more resources
Full Text Sources
Medical

