. 2022 Oct 20;13(1):6221.
doi: 10.1038/s41467-022-33785-w.

Systems-biology analysis of rheumatoid arthritis fibroblast-like synoviocytes implicates cell line-specific transcription factor function

Affiliations

Systems-biology analysis of rheumatoid arthritis fibroblast-like synoviocytes implicates cell line-specific transcription factor function

Richard I Ainsworth et al. Nat Commun. .

Abstract

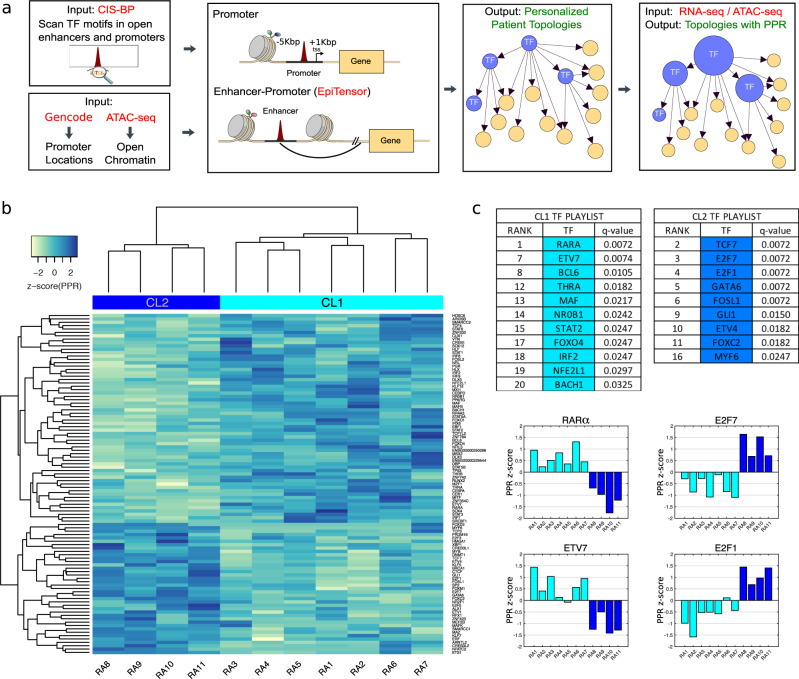
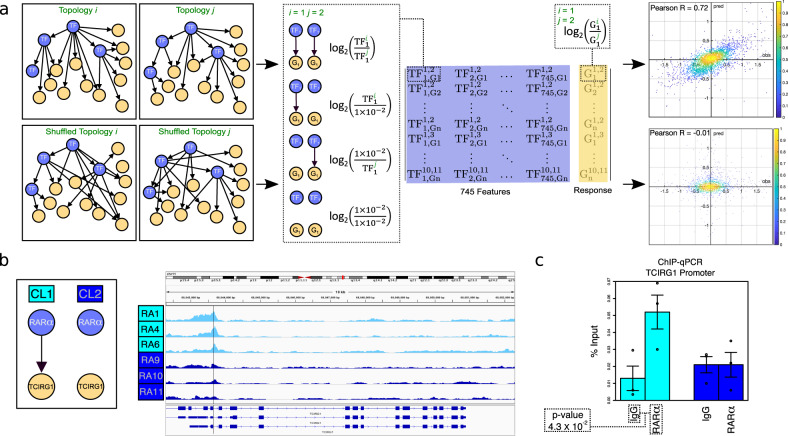
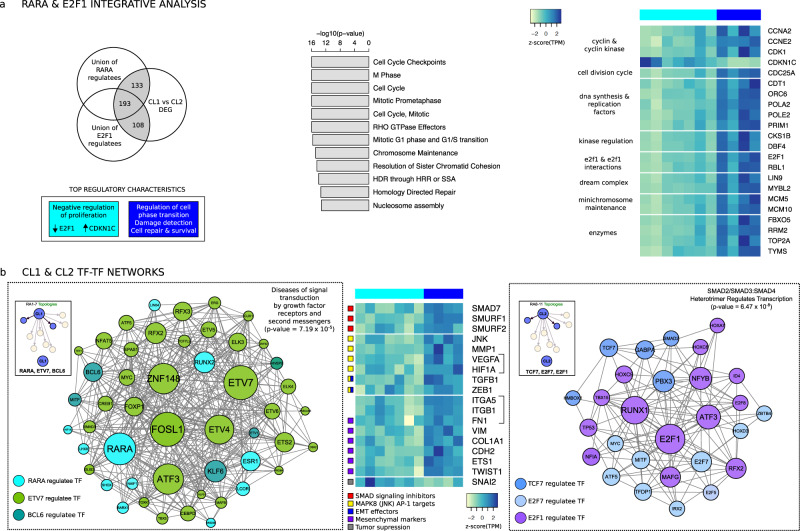
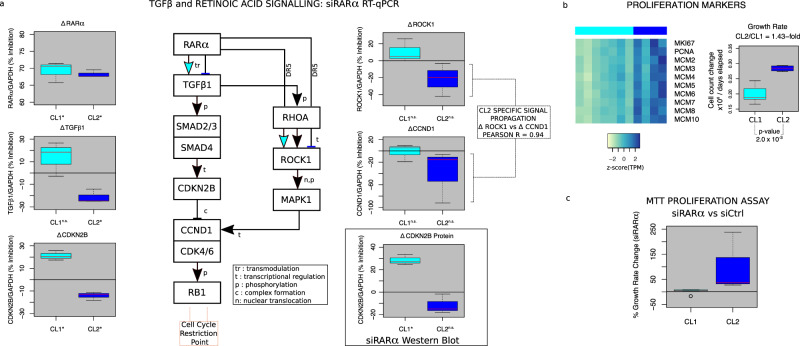
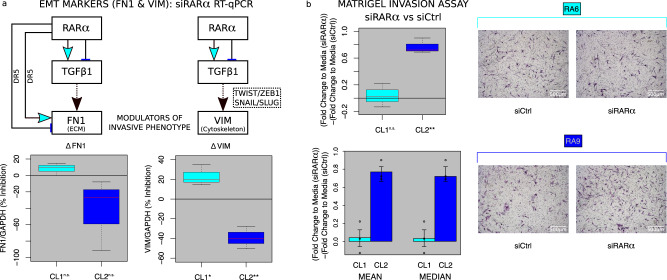
Rheumatoid arthritis (RA) is an immune-mediated disease affecting diarthrodial joints that remains an unmet medical need despite improved therapy. This limitation likely reflects the diversity of pathogenic pathways in RA, with individual patients demonstrating variable responses to targeted therapies. Better understanding of RA pathogenesis would be aided by a more complete characterization of the disease. To tackle this challenge, we develop and apply a systems biology approach to identify important transcription factors (TFs) in individual RA fibroblast-like synoviocyte (FLS) cell lines by integrating transcriptomic and epigenomic information. Based on the relative importance of the identified TFs, we stratify the RA FLS cell lines into two subtypes with distinct phenotypes and predicted active pathways. We biologically validate these predictions for the top subtype-specific TF RARα and demonstrate differential regulation of TGFβ signaling in the two subtypes. This study characterizes clusters of RA cell lines with distinctive TF biology by integrating transcriptomic and epigenomic data, which could pave the way towards a greater understanding of disease heterogeneity.


Conflict of interest statement

The authors declare no competing interests.

Figures

Fig. 1
Fig. 1. Individual transcriptional gene regulation networks for Rheumatoid Arthritis Fibroblast-like Synoviocytes allow for cell line stratification based on global TF regulatory differences.
a Construction of cell line specific global transcriptional gene regulation networks using the Taiji Integrative Pipeline with RNA-seq and ATAC-seq data. Ranking of TFs using Personalized PageRank (PPR). b Cell line stratification into two clusters (CL1 and CL2) based on PPR. Hierarchical clustering using z-score(PPR) of top 100 TFs. c Top ranked TFs from a statistical power analysis of their regulatees and absolute change in PPR between CL1 and CL2. CL1- and CL2-specific TF “playlists”. Barplots of z-score(PPR) for top ranked cluster-specific TFs. Source data are provided as a Source Data file.
Fig. 2
Fig. 2. Computational and experimental verification of personalized transcriptional gene regulation networks for Rheumatoid Arthritis Fibroblast-like Synoviocytes.
a Computational validation of predicted regulatory interactions using a 10-fold cross validated Random Forest regression model. b Selected differential edge formed by rank 1 cluster-specific TF, RARα →TCIRG1. ATAC-seq track from top 3 (CL1) and bottom 3 (CL2) patients as ranked by RARα PPR, showing TCIRG1 gene and location of ATAC-seq peak centered on RARα motif at chr11:68,043,640-68,043,657 (GRCh38/hg38) in the promoter of TCIRG1. c Experimental validation of cluster-specific predicted regulatory interaction using ChIP-qPCR showing CL1-specific RARα DNA-binding. p-value calculated by paired two-tailed Student’s t-test. Center line is mean and error bars +/− 0.5 standard deviation. CL1 n = 3 and CL2 n = 3 biologically independent cell lines. Source data are provided as a Source Data file.
Fig. 3
Fig. 3. Network analysis for top cluster-specific TFs shows differential regulation of cell proliferation mechanisms and an imprinted TGFβ-driven EMT signature in CL2.
a Union of RARα and E2F1 regulatees across all RA patient transcriptional networks intersected with CL1 vs CL2 2-fold (p < 0.05 by two-sided Student t-test) differentially expressed genes (DEGs). Functional enrichment analysis of high edge weight TF-specific DEG regulatees and RARα/E2F1 union DEG regulatees. Heatmap of gene expression (z-score(TPM)) for genes from selected pathway “Mitotic G1 phase and G1/S transition”. b Representation of CL1 and CL2 TF-TF subnetworks each using TF regulatees of the top 3 cluster-specific TFs with a significantly higher (p < 0.05 by two-sided Student t-test) edge weight in the given cluster. Edges between all network nodes shown and node size set to be proportional to out-degree. Nodes colored according to parent TF node identity (see legend). Functional enrichment analysis for all TFs in each network. Heatmap of gene expression (z-score(TPM)) for genes with significant differential expression (p < 0.05 by two-sided Student t-test) between clusters, related to Epithelial-to-Mesenchymal Transition (EMT), canonical SMAD-dependent TGFβ signaling and non-canonical MAPK signaling targets.
Fig. 4
Fig. 4. RARα divergently regulates TGFβ signaling and proliferation in a cluster-specific manner: transcriptional and functional validation.
a siRARα RT-qPCR on CL1 and CL2 RA FLS. Boxplots of change in mRNA levels under RARα depletion (CL1: p = 0.041, CL2: p = 0.015) for TGFβ1 (CL2: p = 0.004) and canonical CDKN2B (CL1: p = 0.0009, CL2: p = 0.0002)/non-canonical signaling axis genes that undergo transcriptional regulation. Arrows (↑) illustrate activating and blunt ended lines (T) inhibiting/repressive effects. Cyan infill depicts the primary CL1 regulation logic, dark blue representing the primary CL2 regulation logic and black arrows representing both CL1 and CL2 logic. Boxplot of change in CDKN2B protein levels under RARα depletion (CL1: p = 0.048). p-values calculated by paired two-tailed Student’s t-test for siRARA vs CTL *p < 0.05. CL1 n = 3 and CL2 n = 3 biologically independent cell lines. b Heatmap of gene expression (z-score(TPM)) for genes with significant differential expression (p < 0.05 by two-tailed Student’s t-test) between clusters, related to cellular proliferation. Growth rate boxplot for CL1 and CL2 FLS. CL1 n = 5 and CL2 n = 4 biologically independent cell lines. c MTT proliferation assay boxplot for siRARα and siCtrl at 1 and 5 days after plating. CL1 n = 6 and CL2 n = 3 biologically independent cell lines. For all box plots, red center line for median, whiskers represent maximum and minimum values, box width from quartile 1 to quartile 3. Source data are provided as a Source Data file.
Fig. 5
Fig. 5. RARα regulates TGFβ signaling and Epithelial-to-Mesenchymal Transition (EMT) effectors in a cluster-specific fashion with subsequent transcriptional and functional validation.
a siRARα RT-qPCR on CL1 and CL2 RA FLS. Arrows (↑) illustrate activating and blunt ended lines (T) inhibiting/repressive effects. Cyan infill depicts the primary CL1 regulation logic, dark blue representing the primary CL2 regulation logic and black arrows representing both CL1 and CL2 logic. Boxplots of change in mRNA levels under siRARα depletion for the EMT markers FN1 and VIM (CL1: p = 0.0189, CL2: p = 0.0041) (transcriptionally regulated downstream of TGFβ1). CL1 n = 3 and CL2 n = 3 biologically independent cell lines. p-values calculated by paired two-tailed Student’s t-test for siRARA vs CTL *p < 0.05 **p < 0.001. b TGFβ-stimulated Matrigel Invasion Assay boxplot for CL1 and CL2 (p = 0.0077) and barplot of mean and median values (error bars represent 1 standard deviation). p-values calculated by paired two-tailed Student’s t-test for siRARA vs CTL **p < 0.001. CL1 n = 3 and CL2 n = 3 biologically independent cell lines. Representative 4× magnification images of migrated RA FLS in siRARα and siCtrl for two exemplar patient cell lines RA6 (CL1) and RA9 (CL2). For all box plots, red center line for median, whiskers represent maximum and minimum values, box width from quartile 1 to quartile 3. Source data are provided as a Source Data file.

References

    1. Firestein GS, McInnes IB. Immunopathogenesis of rheumatoid arthritis. Immunity. 2017;46:183–196. doi: 10.1016/j.immuni.2017.02.006. - DOI - PMC - PubMed
    1. Bluett J, Barton A. Precision medicine in rheumatoid arthritis. Rheum. Dis. Clin. North Am. 2017;43:377–387. doi: 10.1016/j.rdc.2017.04.008. - DOI - PubMed
    1. Ouboussad L, Burska AN, Melville A, Buch MH. Synovial tissue heterogeneity in rheumatoid arthritis and changes with biologic and targeted synthetic therapies to inform stratified therapy. Front. Med. 2019;6:45. doi: 10.3389/fmed.2019.00045. - DOI - PMC - PubMed
    1. Lliso-Ribera G, et al. Synovial tissue signatures enhance clinical classification and prognostic/treatment response algorithms in early inflammatory arthritis and predict requirement for subsequent biological therapy: Results from the pathobiology of early arthritis cohort (PEAC) Ann. Rheum. Dis. 2019;78:1642–1652. doi: 10.1136/annrheumdis-2019-215751. - DOI - PMC - PubMed
    1. Orr C, et al. Synovial tissue research: A state-of-the-art review. Nat. Rev. Rheumatol. 2017;13:463–475. doi: 10.1038/nrrheum.2017.115. - DOI - PubMed

Publication types