. 2022 Oct 20;13(1):6206.
doi: 10.1038/s41467-022-33945-y.

p53 mutation in normal esophagus promotes multiple stages of carcinogenesis but is constrained by clonal competition

Affiliations

p53 mutation in normal esophagus promotes multiple stages of carcinogenesis but is constrained by clonal competition

Kasumi Murai et al. Nat Commun. .

Abstract

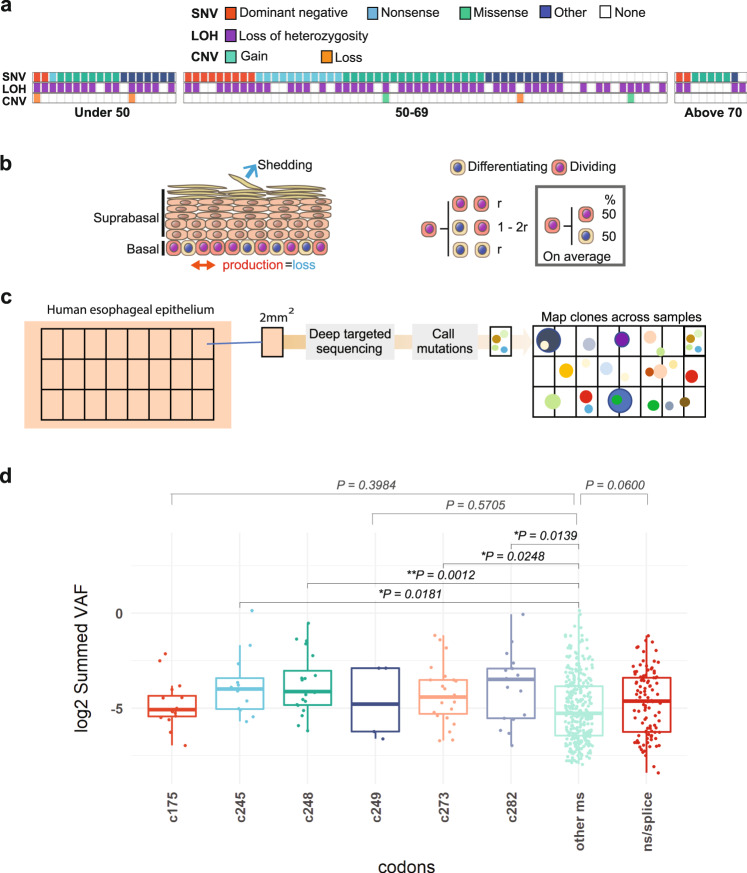
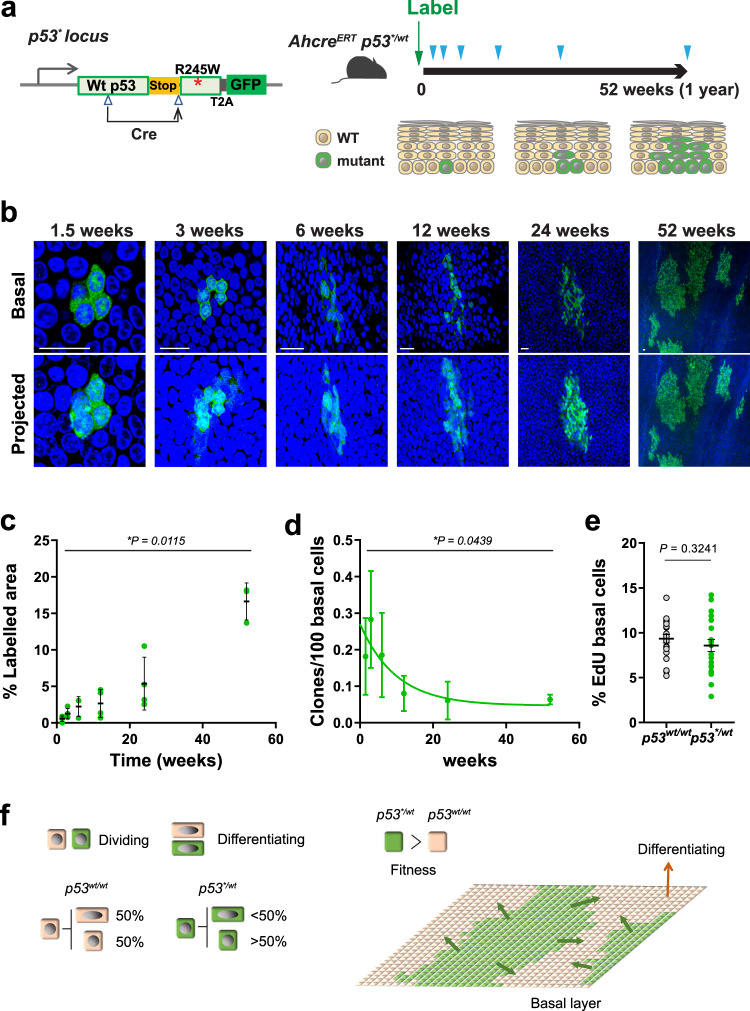
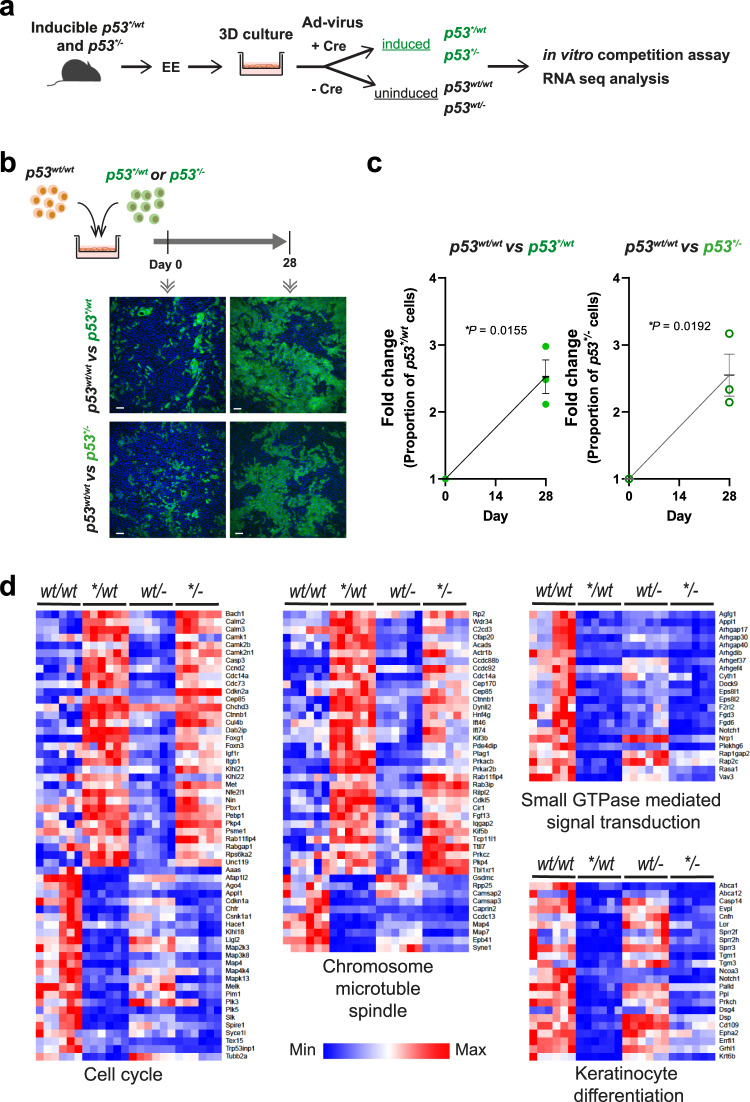
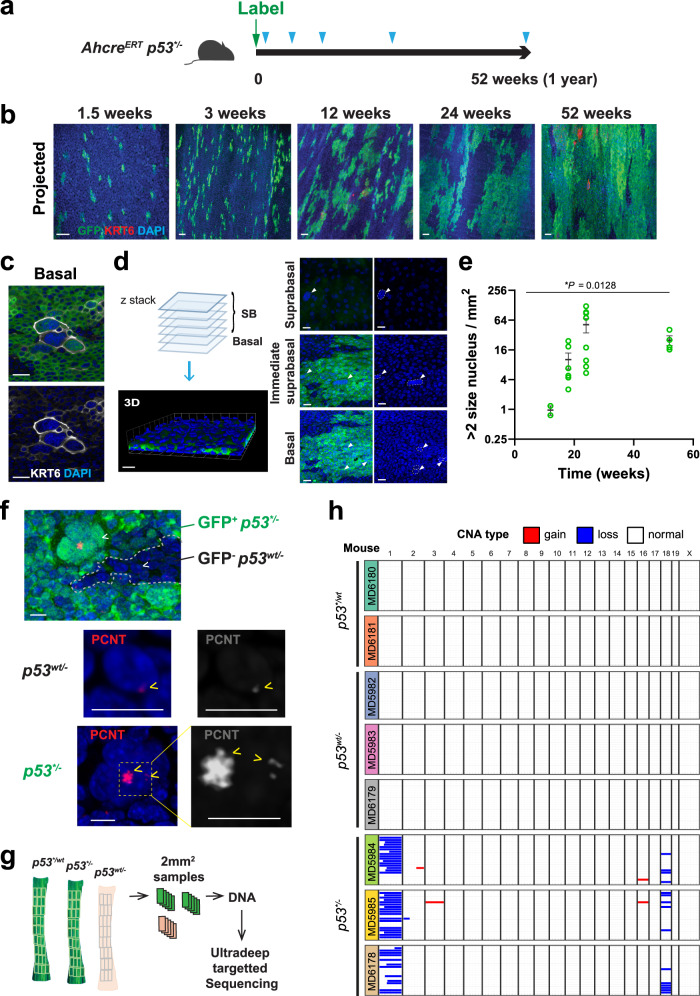
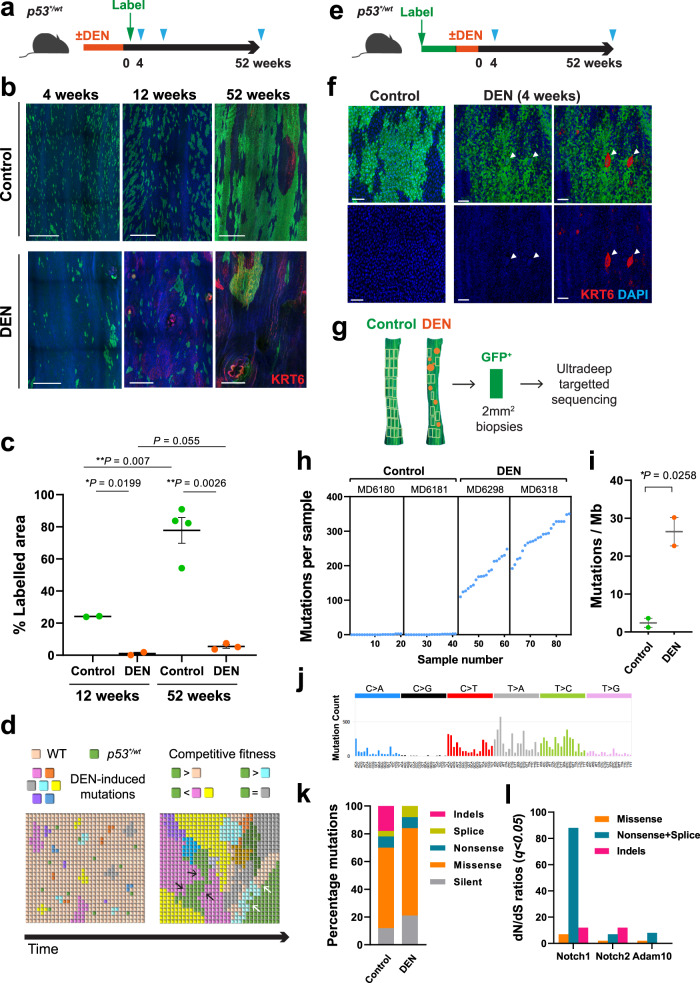
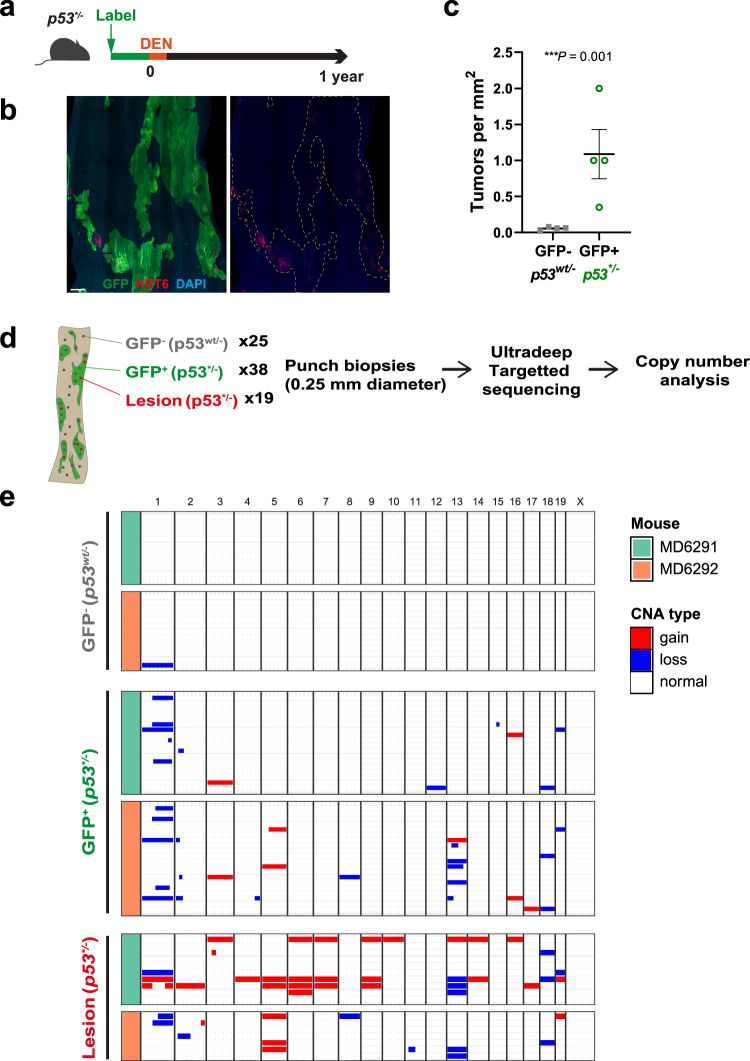
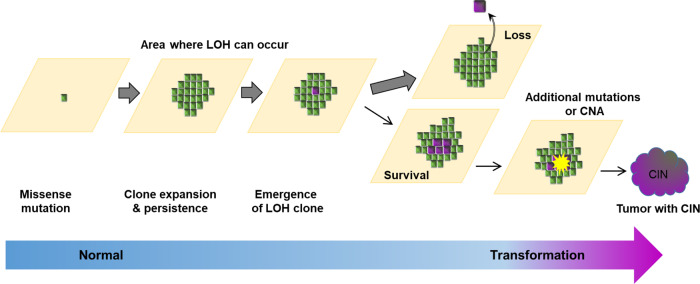
Aging normal human oesophagus accumulates TP53 mutant clones. These are the origin of most oesophageal squamous carcinomas, in which biallelic TP53 disruption is almost universal. However, how p53 mutant clones expand and contribute to cancer development is unclear. Here we show that inducing the p53R245W mutant in single oesophageal progenitor cells in transgenic mice confers a proliferative advantage and clonal expansion but does not disrupt normal epithelial structure. Loss of the remaining p53 allele in mutant cells results in genomically unstable p53R245W/null epithelium with giant polyaneuploid cells and copy number altered clones. In carcinogenesis, p53 mutation does not initiate tumour formation, but tumours developing from areas with p53 mutation and LOH are larger and show extensive chromosomal instability compared to lesions arising in wild type epithelium. We conclude that p53 has distinct functions at different stages of carcinogenesis and that LOH within p53 mutant clones in normal epithelium is a critical step in malignant transformation.


Conflict of interest statement

The authors declare no competing interests.

Figures

Fig. 1
Fig. 1. TP53 mutation in Oesophageal Squamous Cell Carcinoma (ESCC).
a 88 TCGA ESCC samples were analyzed to identify the prevalence of genome alterations (single nucleotide variants, SNV, loss of heterozygosity, LOH & copy number variation, CNV) in the TP53 gene. 74% of samples reported LOH over TP53 and 84% reported SNVs. 64% of samples reported both SNVs and LOH over TP53. See Supplementary Data 1 for source data. b Cell behaviour in basal layer of normal homoeostatic epithelium. On division, a progenitor may generate two dividing progenitors, two differentiating daughters, or one cell of each type. r is the probability of symmetric division outcome. On average, equal proportions of progenitor and differentiating cells are generated. c, d TP53 mutant clones in normal human oesophagus, data from ref. . c Protocol: normal oesophageal epithelium was cut into a contiguous grid of 2 mm2 samples and ultradeep targeted sequencing of 74 cancer genes, including TP53, performed. SNV were called and those spanning adjacent samples merged to generate the variant allele frequency (VAF) for each SNV. d VAF of TP53 mutants. VAFs of missense mutants at codons 175, 245, 248, 249 273, and 282 are compared with the other missense (other ms) and nonsense and essential splice mutants (ns/splice). n = 16, 12, 20, 5, 23, 17, 307, and 101 clones respectively. Boxes indicate quartiles, horizontal bar median and whiskers indicate range, up to 1.5 fold inter-quartile range. p values, Kruskal–Wallis test for between group differences with Dunnett’s correction for multiple comparisons. See Supplementary Data 2.
Fig. 2
Fig. 2. Heterozygous p53R245W (p53*/wt) mutant cell fate in mouse oesophagus.
a Protocol and schematic of genetic lineage tracing in AhcreERT p53 flR245W-GFP/wt (p53*/wt) mice. Expression of the p53 mutant allele and GFP reporter was induced in scattered single cells (Labelling) and oesophagus samples were taken at indicated time points (triangles). The fate of mutant clones was examined by tracking the expression of GFP. bd n = 4 mice per time point except n = 3 at the 6-week and 52-week time points, from 3 independent experiments. b Rendered confocal z stacks showing typical p53*/wt clones in oesophageal epithelial wholemounts. Basal, top-down view of basal layer, Projected, top-down view through all nucleated cell layers. Green, GFP; blue, DAPI; Scale bars, 20 µm c Proportion of projected area labelled with GFP at indicated time points. Average value from 6 fields per animal. Error bars are mean ± s.e.m. d Density of p53*/wt clones over the time. Error bars are mean ± s.e.m. For c, d, p value was determined by Kruskal–Wallis test. e Average percentage of EdU-positive basal cells in p53*/wt clones compared to non-GFP labelled (p53wt/wt) basal cells in the same mouse. EdU was administered an hour before sampling. n = 22 mice across all time points. Error bars are mean ± s.e.m. p value, two-tailed paired Student’s t test. See Supplementary Data 5–7. f Schematic illustration of p53*/wt cell behaviour. On average, wild type progenitors (p53wt/wt) produce equal proportions of dividing and differentiating cells across the population, whereas p53*/wt cells generate more dividing cells. This fate imbalance allows p53*/wt cells to outcompete wild type cells and expand in the tissue.
Fig. 3
Fig. 3. Effect of loss of heterozygosity (LOH) on mutant cell behaviour.
a A 3D primary culture system was used to characterize p53 mutant cells in vitro. Oesophageal keratinocytes were isolated from transgenic mice and p53* mutation was induced by adenovirus carrying cre recombinase. b Cell competition assay. p53*/wt and p53*/− cells were co-cultured with p53wt/wt cells respectively and relative fitness was examined. Representative immunofluorescence images from three biological replicates at day 0 and 28 are shown. Green, GFP; blue, DAPI. Scale bars, 50 µm. c Quantitation of cell competition assay by flow cytometry. Graph shows the fold change of proportion of GFP + p53*/wt or p53*/− cell in the culture. Black lines indicate mean and s.e.m. p value, two-tailed ratio paired t-test, n = 3 replicate cultures. d RNAseq analysis showing differentially expressed transcripts in p53 mutant cells which could affect the fitness of cells. RNAseq data were subjected to the Gene Ontology analysis (enrichGO in R package clusterProfiler). Enriched biological processes in pairwise of comparisons both p53*/wt vs p53wt/wt and p53*/− vs p53wt/− were considered to be affected by p53* expression. Heatmaps were generated for genes associated with the cell cycle, cell division (chromosome, microtubule, and spindle), small GTPase mediated signal transduction, and keratinocyte differentiation. n = 6 biological replicates per genotype. See Supplementary Data 8–11.
Fig. 4
Fig. 4. p53*/− oesophageal epithelium.
a Protocol: p53*/− mice were generated with an inducible p53* allele and a p53 null allele. Following induction, p53*/− clones competed in a p53wt/− background, and were sampled at indicated time points (triangles). bd Images are representative from n = 2 mice for 1.5 and 3 week, n = 4 for 12, 24, and 52 week time points. b Rendered confocal z-stacks showing projected views of p53*− clones in wholemounts. Images are representative from Green, GFP; red, KRT6; blue, DAPI; Scale bars, 40 µm. c Confocal images showing cells with aneuploid appearance in p53*/− clone area. Green, GFP; grey, KRT6; blue, DAPI; Scale bars, 20 µm. d Confocal z-stack images were used to reconstruct a 3D image of the wholemount sample and determine the z-position of cells of interest. Aneuploid-like cells were found both in the basal and suprabasal layers. Scale bars, 20 µm. e Number of cells with large (≥double size) nucleus in p53*/− clone area post induction. n = 2 mice for 12 week time point, n = 6 for 18 week, n = 8 for 24 week and n = 4 for 52 week time points. Error bars are mean ± s.e.m. p value determined by Welch’s ANOVA. See Supplementary Data 13. f Representative images of above samples stained for PCNT. n = 4 mice. GFP-positive p53*/ cells (green) and GFP negative p53wt/− cells are from the same EE. Grey dashed line indicates the border of GFP+ and GFP− area. Each representative nucleus (arrowheads) were shown at higher magnification. PCNT foci (yellow arrowheads) were also shown in grey scale on the right. For p53*/ samples, the yellow dashed box is shown at higher magnification. Red, PCNT; green, GFP; blue, DAPI. Scale bars, 10 µm. g Wholemount epithelium (for protocol, see Supplementary Fig. 5a) was cut into a contiguous grid of 2 mm2 pieces, DNA was extracted and subjected to ultradeep targeted sequencing. h Summary of copy number analysis using targeted sequencing data. Further analysis with Low coverage WGS from same experiment is shown in Supplementary Fig. 5f.
Fig. 5
Fig. 5. p53*/wt mutant clones in mutagenized epithelium.
a Protocol: p53*/wt mice were treated with DEN or vehicle followed by clonal induction, oesophagus samples were collected at indicated time points (triangles). b Projected confocal z-stacks showing p53*/wt clones in epithelial wholemounts. Representative images from two independent experiments. 4 weeks, n = 4 control and n = 3 DEN mice; 12 weeks, n = 2 mice per group; 52 weeks, n = 6 control and n = 4 DEN mice. Green, GFP; Red, KRT6; blue, DAPI. Scale bars, 500 µm. c Average proportion of projected labelled area. Number of mice as in b. Error bars, mean ± s.e.m., p values by two-tailed unpaired t-test with Welch’s t correction. See Supplementary Data 16. d Schematics of p53*/wt clone behaviour in DEN-treated tissue. p53*/wt outcompetes wild type cells, but not all DEN-induced mutant cells. Many p53*/wt clones are lost in 4-weeks. Surviving p53*/wt clones vary widely in size and are found in both epithelium and tumours. p53*/wt clone can be outcompeted by surrounding fitter clones (black arrows) or itself be fitter than adjacent mutant clones (white arrows). e Protocol: Mice were treated with DEN or vehicle after colonization by p53*/wt mutant cells. Triangles, sampling time points. f Top down views of basal layer of wholemounts from p53*/wt induced mice 4 weeks after DEN treatment (n = 9 mice) compared to control (vehicle, n = 4 mice). Green, GFP; red, KRT6; blue, DAPI. Arrowheads indicate large nuclei in p53*/wt clone area following DEN treatment. Scale bar, 50 µm. g Sequencing analysis at 1 year time point (protocol: e). DNA extracted from 2 mm2 grid biopsies were subjected to ultradeep targeted sequencing. Tumours (orange circles) were microdissected out from the epithelium prior to the following sequencing analysis. n = 40 (control) and 42 (DEN) biopsies from 2 mice per condition (hl). h Number of mutations. Every dot corresponds to a sample. i Estimated mutation burden. p value by two-tailed unpaired Student’s t-test. Error bars, mean ± s.e.m. j, Mutational spectrum of DEN-treated p53*/wt epithelium. k Percentage of mutation types identified in each condition. l Positively selected somatic mutations in DEN-treated samples. dN/dS ratios for missense, truncating (nonsense + splice) and indels. See Supplementary Data 14 and 15.
Fig. 6
Fig. 6. Effect of mutagenesis and aging p53*/− epithelium.
a Protocol: Induced p53*/− mice were treated with DEN for 2 weeks and aged. b Confocal image of p53*/− induced epithelium at 1 year post DEN treatment. Typical example from n = 4 mice. Green, GFP; red, KRT6; blue, DAPI. Scale bar, 400 µm. c Number of tumours found in p53*/− (GFP+) and p53wt/− (GFP−) area. Error bars are mean ± s.e.m. n = 4 mice, p value was determined by two-tailed ratio paired t-test. d Sequencing analysis of DEN treated p53*/− epithelium at 1 year time point. Micro-punch biopsies were taken from physiologically normal epithelium, GFP-negative p53*/− or GFP-positive p53*/− clone area, and from lesions (p53*/−). Chromosomal alterations were analyzed using targeted sequencing data. e Summary of copy number alterations. Gain and loss of chromosomes was predominantly detected in p53*/− clone area and lesions which arose from p53*/− cells. n = 2 mice; 25 biopsies for p53wt/−, 38 biopsies for p53*/− clone areas, 19 biopsies for lesions. See Supplementary Data 25 and 26.
Fig. 7
Fig. 7. Mutant p53 in normal epithelia in carcinogenesis.
Heterozygous p53 mutation in single cells in normal epithelia confers a proliferative advantage, clonal expansion, and a population of mutant cells that persists to undergo LOH. Clones with LOH are rare, but those that persist may acquire CNA and progress to form tumours. Once a tumour has formed, p53 mutation enhances tumour growth.

References

    1. Lee-Six H, et al. The landscape of somatic mutation in normal colorectal epithelial cells. Nature. 2019;574:532–537. doi: 10.1038/s41586-019-1672-7. - DOI - PubMed
    1. Martincorena I, et al. Somatic mutant clones colonize the human esophagus with age. Science. 2018;362:911–917. doi: 10.1126/science.aau3879. - DOI - PMC - PubMed
    1. Martincorena I, et al. Tumor evolution. High burden and pervasive positive selection of somatic mutations in normal human skin. Science. 2015;348:880–886. doi: 10.1126/science.aaa6806. - DOI - PMC - PubMed
    1. Suda K, et al. Clonal expansion and diversification of cancer-associated mutations in endometriosis and normal endometrium. Cell Rep. 2018;24:1777–1789. doi: 10.1016/j.celrep.2018.07.037. - DOI - PubMed
    1. Yokoyama A, et al. Age-related remodelling of oesophageal epithelia by mutated cancer drivers. Nature. 2019;565:312–317. doi: 10.1038/s41586-018-0811-x. - DOI - PubMed

Publication types

Substances