. 2023 Feb;19(2):198-205.
doi: 10.1038/s41589-022-01162-9. Epub 2022 Oct 20.

A fluorescent multi-domain protein reveals the unfolding mechanism of Hsp70

Affiliations

A fluorescent multi-domain protein reveals the unfolding mechanism of Hsp70

Satyam Tiwari et al. Nat Chem Biol. 2023 Feb.

Erratum in

Abstract

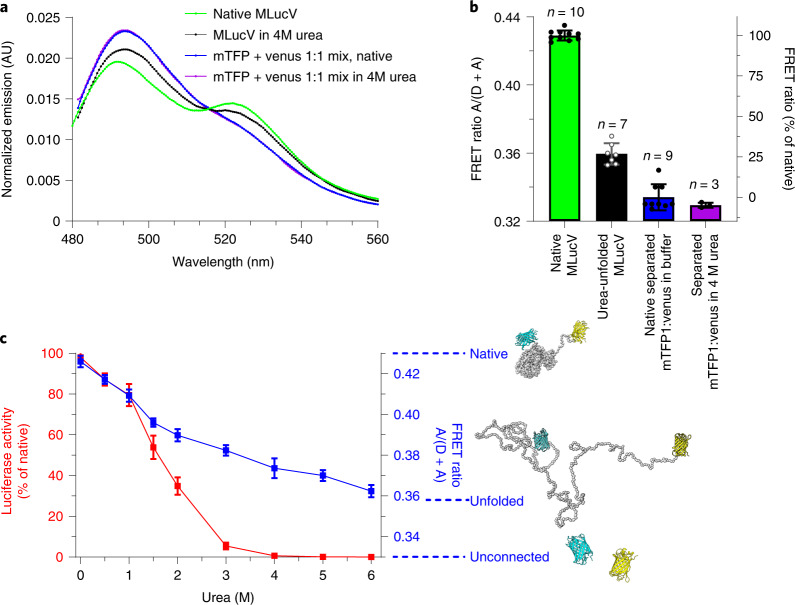
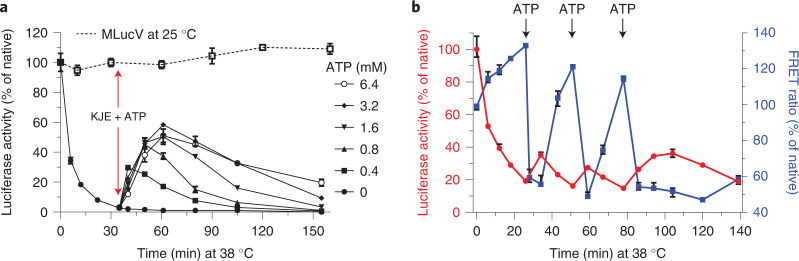
Detailed understanding of the mechanism by which Hsp70 chaperones protect cells against protein aggregation is hampered by the lack of a comprehensive characterization of the aggregates, which are typically heterogeneous. Here we designed a reporter chaperone substrate, MLucV, composed of a stress-labile luciferase flanked by stress-resistant fluorescent domains, which upon denaturation formed a discrete population of small aggregates. Combining Förster resonance energy transfer and enzymatic activity measurements provided unprecedented details on the aggregated, unfolded, Hsp70-bound and native MLucV conformations. The Hsp70 mechanism first involved ATP-fueled disaggregation and unfolding of the stable pre-aggregated substrate, which stretched MLucV beyond simply unfolded conformations, followed by native refolding. The ATP-fueled unfolding and refolding action of Hsp70 on MLucV aggregates could accumulate native MLucV species under elevated denaturing temperatures highly adverse to the native state. These results unambiguously exclude binding and preventing of aggregation from the non-equilibrium mechanism by which Hsp70 converts stable aggregates into metastable native proteins.


Conflict of interest statement

The authors declare no competing interests.

Figures

Fig. 1
Fig. 1. Biophysical characterization of native and non-native MLucV.
a, FRET spectra (normalized to their respective area) of MLucV (0.4 µM) under native conditions (green) compared to 4 M urea (black) and to disconnected fluorophores (0.4 µM each) under the same conditions (blue and purple, respectively). b, Calculation of FRET-PRs from the spectra in a. The right y-axis shows FRET ratios normalized to that of native MLucV (Methods). Error bars show means ± s.d.; respective sample sizes are shown above the bars. c, MLucV urea denaturation curves, monitored by FRET and luciferase activity. MLucV (0.4 μM) was incubated with different urea concentrations (0, 0.5, 1, 1.5, 2, 3, 4, 6 M urea) at 30 °C for 15 min. Luciferase activity and FRET were measured (separately for the same samples) in the presence of each urea concentration. Error bars show mean ± s.d. from n = 4 independent experiments. The native and unfolded protein models have been obtained using Molecular Dynamics simulations (Methods). Source data
Fig. 2
Fig. 2. Biophysical characterization of aggregated MLucV.
a, FRET spectra (normalized to their respective area) of UMLucV (black; 30 µM MLucV were unfolded at 25 °C in 4 M urea for 5 min, then diluted to 0.4 µM and incubated 20 min at 25 °C) and HSMLucV (purple; 0.4 µM incubated 23 min at 38 °C, followed by 20 min at 25 °C). Mixtures of disconnected fluorophores prepared under the same conditions are also shown (red and green spectra, respectively). b, Normalized FRET ratios derived from the spectra in a and luciferase activity in the corresponding conditions. The left y-axis shows FRET ratios (blue bars) normalized to that of native MLucV, and the right y-axis shows similarly normalized luciferase activity (red bars). Error bars show means ± s.d.; respective sample sizes are shown above the bars. c, The structure of UMLucV and HSMLucV oligomers analyzed by negative stain electron microscopy. Samples were prepared as in a. Scale bars, 100 nm. Bottom, native MLucV and native GroEL + GroES taken as controls. All transmission electron microscopy experiments were reproduced at least three times with similar results. d, Normalized FRET ratio of UMLucV oligomers (black circles, prepared as in a), or HSMLucV oligomers (after 20 min preincubation at 39 °C, then 20 min at 25 °C; magenta circles); from 0.4 up to 4 µM. Error bars show means ± s.d. (n = 3). e, Molecular Dynamics simulation of the aggregation of 12 misfolded monomers: they were free to diffuse, rotate and rearrange in a confining potential (schematically represented by the circle), which became progressively more confining (arrows) until the 12 monomers arranged in a single aggregate. The confining potential was then turned off and the resulting aggregate allowed to briefly rearrange (Methods). Gray, luciferase core; cyan, mTFP1; yellow, Venus. Source data
Fig. 3
Fig. 3. Resolving the individual steps of the KJE mechanism of action.
a, 30 µM MLucV unfolded in 4 M urea at 25 °C for 5 min, then diluted to 0.4 µM in refolding buffer in the absence or presence of ATP (4 mM), KJE (4 µM DnaK, 1 µM DnaJ and 2 µM GrpE, respectively), KJE + ATP, ADP (4 mM), or KJE + ADP. FRET and luciferase activity was measured after 120 min at 25 °C. Error bars show means ± s.d. (n = 3). b, Order-of-addition experiment showing DnaJ- and DnaK-mediated unfolding of urea pre-aggregated MLucV oligomers. UMLucV was preformed in the presence of ATP (without chaperones) as in a. After, DnaJ, DnaK and GrpE (1, 4 and 2 µM, respectively) were sequentially added at the indicated times (arrows). FRET and luciferase activity were measured at 25 °C. Squares: native MLucV, circles: UMLucV. Error bars show mean ± s.d. from n = 3 independent experiments. c, Negative-staining electron micrographs of UMLucV oligomers (0.5 µM, prepared as in b) before (top left) and after (top right) a 5-min incubation with the KJE chaperone system: DnaK (4 µM), DnaJ (1 µM) and GrpE (2 µM) (top right). Bottom, control samples of KJE + ATP only (left) showing no large particles, and GroEL + GroES (2 µM each, right). Scale bars, 100 nm. All samples were in the presence of 4 mM ATP. TEM experiments were reproduced three times with consistent results. d, Probability distribution of the distance between the active centers of mTFP1 and Venus in representative native (green), misfolded (black), urea-unfolded (cyan), and DnaK-expanded (magenta) MLucV monomers, collected from Molecular Dynamics simulations. Source data
Fig. 4
Fig. 4. Non-equilibrium action of the KJE system.
The KJE system can convert inactive species into native species under conditions that are unfavorable to the native state and this non-equilibrium process depends on ATP. a, Native MLucV (0.5 µM) was incubated at 38 °C in buffer with 4 µM BSA for 30 min. At t = 35 min, KJE (4, 1, 2 µM, respectively) and increasing amounts of ATP were added (red arrow) at the indicated concentrations and incubated at 38 °C. Luciferase activity is expressed as a percentage of the maximal activity of 0.5 µM native MLucV. Native MLucV at 25 °C (dashed line) is shown as a control. b, Native MLucV (0.5 µM) was constantly incubated at 38 °C, in the presence of 4 µM BSA, 4 µM DnaK, 1 µM DnaJ, 2 µM GrpE (KJE) and 2 µM ClpB, first without ATP. Then, 0.8 mM ATP was added at t = 26 min and 51 min; and finally 5 mM ATP was added at t = 78 min (arrows). Luciferase activity and FRET ratios were measured at the indicated time points and expressed as a percentage of the initial luciferase activity and FRET ratios at t = 0. Source data
Extended Data Fig. 1
Extended Data Fig. 1. Urea and temperature stability of individual mTFP1 and Venus fluorophores.
a) The intrinsic fluorescence of 0.4 µM mTFP1 excited at 405 nm was measured at 30°C after 15 min incubation in the presence of up to 8 M Urea. b) Relative peak fluorescence (percentage) of mTFP1 normalized to the no urea control, from the data in a). c) mTFP1 fluorescence was measured at different time points during incubation at 39 °C, up to 150 min. d) Relative mTFP1 fluorescence from the data in c), normalized to the value at t = 0. e) to h) Same experiments as in a)-d), with Venus instead (excitation wavelength: 480 nm). Source data
Extended Data Fig. 2
Extended Data Fig. 2. Aggregation propensity of Urea or heat denatured Luciferase and MLucV.
a) 20 µM Luciferase or MLucV was preunfolded with 4 M urea at 30°C for 30 min, then diluted to a final concentration of 1 µM in buffer (50 mM HEPES-KOH pH 7.5,150 mM KCl, 10 mM Mgcl2, 2 mM DTT), immediately aggregation was monitored by light scattering at 340 nm at 30°C for 30 min using Perkin Elmer Fluorescence Spectrophotometer. b) Aggregation propensity of heat denatured Luciferase and MLucV. 0.5 µM MLucV or Luciferase was incubated at 38°C and aggregation was monitored for 30 minutes by light scattering at 340 nm wavelength. c) Solubility analysis of urea-preaggregated and heat denatured - MLucV, compared to luciferase alone. ΔLuciferase or MLucV was denatured with 4 M urea at 30°C for 30 min, then diluted to a final concentration of 1 µM in buffer (50 mM HEPES-KOH, pH 7.5 + 150 mM KCl+10 mM Mgcl2 + 2 mM DTT). Samples were incubated at 30°C for 30 min then soluble fraction was separated with high-speed centrifugation (20000 g, 10 min). Equal volumes of Total and supernatant was loaded in 12% SDS-PAGE blue gel. For solubility after heat denaturation, 0.5 µM MLucV was incubated at 38°C for 30 min then soluble fraction was separated with high-speed centrifugation (20000 g, 10 min). Equal volumes of Total and supernatant was loaded in 12% SDS-PAGE gel stained with Coomassie. SDS-PAGE experiments shown are representative from three independent repeats. d) Luciferase activity (luminescence) comparison under native conditions between luciferase alone or MLucV (both at 0.5 µM) after 30 min at 25 °C. Error bars show mean ± SD, n = 3 independent experiments. Source data
Extended Data Fig. 3
Extended Data Fig. 3. Temporal stability of UMLucV and HSMLucV.
a) 30 µM MLucV were unfolded at 25°C in 4 M urea for 5 min, then diluted to 0.4 µM in buffer (containing 4 µM BSA with or without 4 mM ATP) and incubated 20 min at 25°C; then samples were supplemented either with water or with KJE (4:1:2 µM final). Luciferase activity was then monitored over time at 25 °C up to 160 min. Error bars show mean ± SD (n = 3). b) Calculation (performed as in Fig. 2b) of FRET proximity ratio of urea pre-aggregated MLucV directly after dilution (t = 0) and after 90 min, compared to native MLucV. Error bars show means ± SD (n ≥ 6). c) 400 nM MLucV were incubated 35 min at 38°C, followed by 20 min at 25 °C in buffer (containing 4 µM BSA with or without 4 mM ATP). Then, samples were supplemented either with water or with KJE (4:1:2 µM final). Luciferase activity was monitored over time at 25 °C up to 160 min. Error bars show mean ± SD (n = 3). Source data
Extended Data Fig. 4
Extended Data Fig. 4. Size distributions of particles observed by negative-staining TEM.
Particles sizes were manually measured using ImageJ. Histograms (left y-axes) of particle sizes are shown for GroEL rings (top, n = 200), HSMLucV particles (middle, n = 372), and UMLucV aggregates (bottom, n = 331). For comparisons, all normal distributions fitted to the histograms are shown in each panel (right y-axes). Source data
Extended Data Fig. 5
Extended Data Fig. 5. Molecular weight calculations of native and aggregated MLucV by SEC-RALS.
In all panels, left y-axes show the relative abundance of eluted proteins, measured by differential refractive index (RI); and right y-axes show the calculated molecular weights (shown as dashed lines) of eluting species. a) SEC-RALS analysis of Native MLucV, native Luciferase and UMLucV, showing elution of UMLucV as a ~12mer (black, 1500 ± 250 kDa), native MLucV as a monomer (green, 120 ± 10 kDa), and native Luciferase as monomer (orange, 65 ± 5 kDa). b) SEC-RALS analysis of different concentrations of UMLucV. The inset shows the narrow range of elution times and molecular weights. Source data
Extended Data Fig. 6
Extended Data Fig. 6. Raw fluorescence spectra corresponding to the data points in Figs. 2d and 3a.
a) Spectra corresponding to increasing concentrations of UMLucV oligomers (30 µM MLucV were unfolded in 4 M urea at 25°C for 5 min, then diluted to the indicated concentrations and further incubated 20 min at 25°C). b) Spectra corresponding to increasing concentrations of HSMLucV. Increasing concentrations of MLucV were incubated at 39°C for 20 min, followed by 20 min at 25°C, and then spectra were measured. Note that due to varying MLucV concentrations, the fluorometer’s detector gain needed to be adjusted to avoid signal saturation, resulting in different overall signal amplitudes. c) Fluorescence spectra representative of the FRET ratios shown in Fig. 3a. For clarity, spectra from one repeat are shown. 30 µM MLucV unfolded in 4 M urea at 25°C for 5 min, then diluted to 0.4 µM in refolding buffer in the absence or presence of ATP (4 mM), or KJE (4 µM DnaK, 1 µM DnaJ+2 µM GrpE respectively), or KJE + ATP, ADP (4 mM), or KJE + ADP. FRET spectra were measured after 120 min at 25 °C. Source data
Extended Data Fig. 7
Extended Data Fig. 7. Diameter distribution of misfolded MLucV 12-mers, obtained by MD simulations.
Simulations were performed with LAMMPS (see Methods). Fluorophore moieties were excluded in the diameter calculations. Source data
Extended Data Fig. 8
Extended Data Fig. 8. Using MLucV as an in-vivo misfolding sensor.
a) FRET spectra of MLucV expressed under limited-growth conditions in WT W3110 E. coli; under native conditions at 30 °C (black), or after a 10 min heat shock at 39 °C (red). b) Calculation of FRET efficiencies from the spectra in a), normalized to that of native purified MLucV. Error bars show means ± SD; respective sample sizes (independent biological replicates) are shown above the bars. c) Time course of MLucV misfolding in WT W3110 E. coli (see Methods) during heat shock at 39 °C, measured by FRET (blue), and enzymatic activity (red). Source data
Extended Data Fig. 9
Extended Data Fig. 9. DnaJ binding to urea pre-aggregated MLucV oligomers.
a) Titration of UMLucV and native MLucV with DnaJ, monitored by FRET. 30 μM MLucV (blue circles) unfolded in 4 M urea at 25°C then diluted to 0.4 μM in refolding buffer in presence of 4 mM ATP, 4 μM BSA, 2 mM DTT and incubated 30 min at 25°C. Increasing amount of DnaJ was added and the reaction was allowed to equilibrate for another 60 min at 25°C. Native MLucV is shown as green squares. The y axis shows FRET ratios normalized to that of native MLucV. Error bars show means ± SD (n = 4). b) 4 µM DnaK and 2 µM GrpE was added in samples from a, after 90 min at 25°C, and Luciferase activity was measured. c) Representative result from a coarse-grained molecular dynamics simulation, showing DnaJ (green) can access exposed misfolded luciferase segments (gray) on the surface of MLucV oligomers. Source data
Extended Data Fig. 10
Extended Data Fig. 10. Effect of BSA on KJE-mediated refolding of urea pre-aggregated Luciferase.
200 nM of urea pre-aggregated ΔLuciferase were incubated at the indicated time points at RT in the presence of 4 µM DnaK, 1 µM DnaJ, 2 µM GrpE and 4 mM ATP and 0, 10 20, 30 mg/mL native BSA. a) Time course showing the relative refolding of ΔLucifease for each added BSA concentration. b) Refolded ΔLuciferase yield (nM) after 70 min, as a function of added BSA concentration. The presence of up to 2250-fold molar excess of native BSA over the aggregated ΔLuciferase did not affect the yields of the chaperone-mediated unfolding/refolding chaperone reaction, which were all around 72 nM, corresponding to ~36% of natively refolded luciferase. Source data

References

    1. Anfinsen CB. Principles that govern the folding of protein chains. Science. 1973;181:223–230. doi: 10.1126/science.181.4096.223. - DOI - PubMed
    1. Dobson CM. Protein folding and misfolding. Nature. 2003;426:884–90.. doi: 10.1038/nature02261. - DOI - PubMed
    1. Rivas G, Minton AP. Macromolecular crowding in vitro, in vivo, and in between. Trends Biochem. Sci. 2016;41:970–981. doi: 10.1016/j.tibs.2016.08.013. - DOI - PMC - PubMed
    1. Ellis RJ. Macromolecular crowding: an important but neglected aspect of the intracellular environment. Curr. Opin. Struct. Biol. 2001;11:114–119. doi: 10.1016/S0959-440X(00)00172-X. - DOI - PubMed
    1. Goloubinoff P, et al. Chaperones convert the energy from ATP into the nonequilibrium stabilization of native proteins. Nat. Chem. Biol. 2018;14:388–395. doi: 10.1038/s41589-018-0013-8. - DOI - PubMed

Publication types