. 2023 Mar;19(3):265-274.
doi: 10.1038/s41589-022-01153-w. Epub 2022 Oct 20.

Nitric oxide-driven modifications of lipoic arm inhibit α-ketoacid dehydrogenases

Affiliations

Nitric oxide-driven modifications of lipoic arm inhibit α-ketoacid dehydrogenases

Gretchen L Seim et al. Nat Chem Biol. 2023 Mar.

Abstract

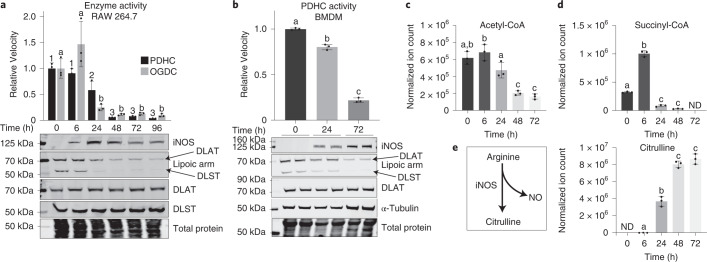
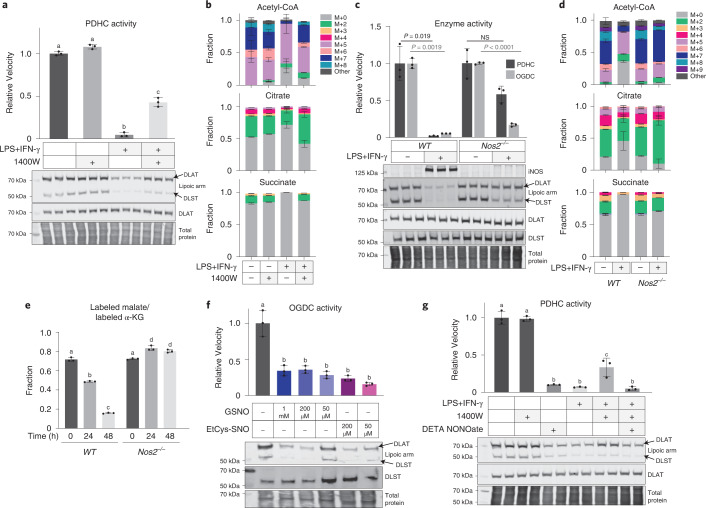
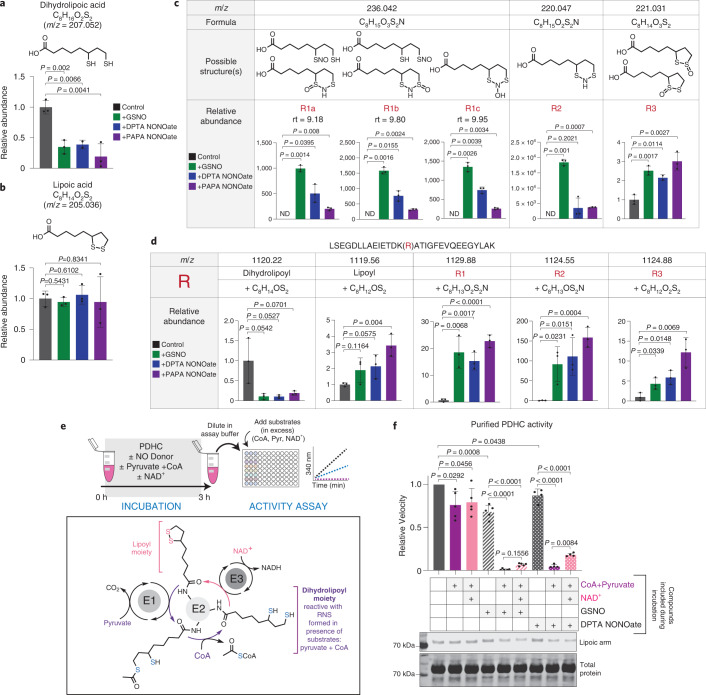
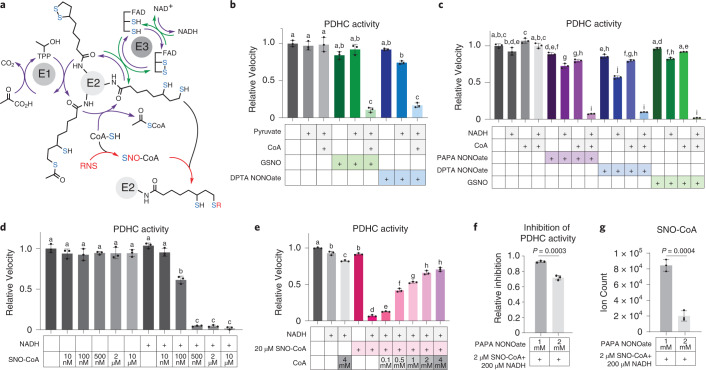
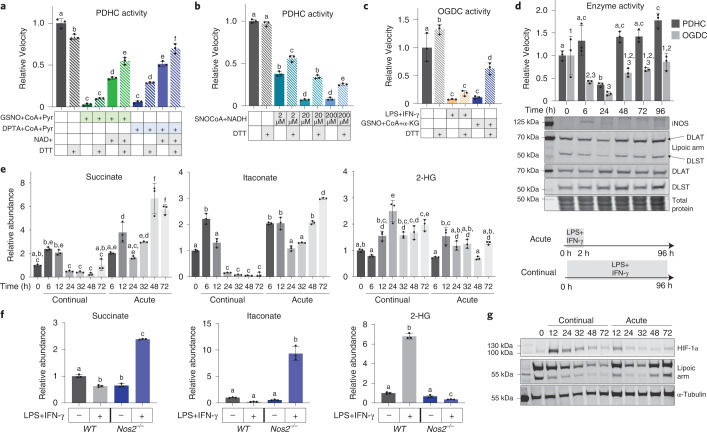
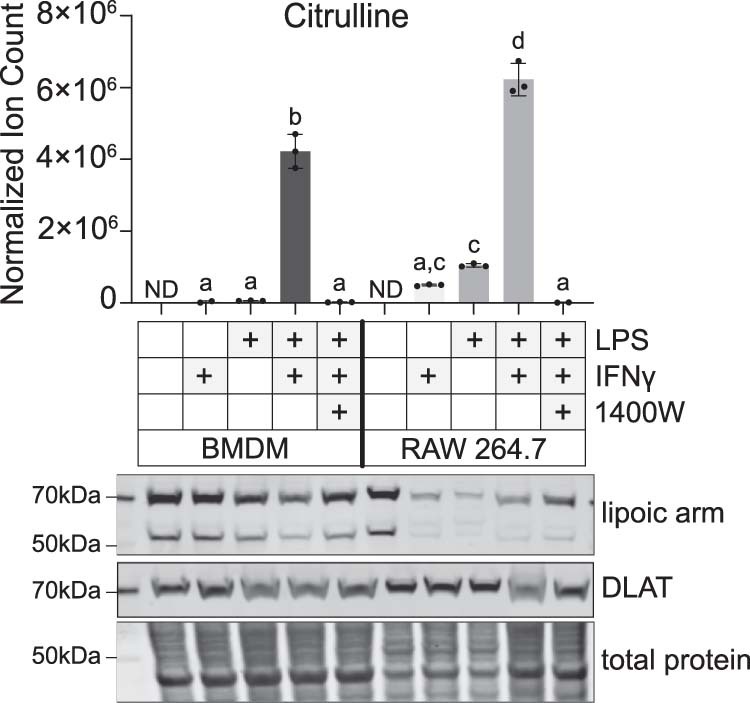
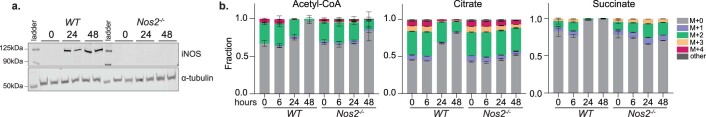
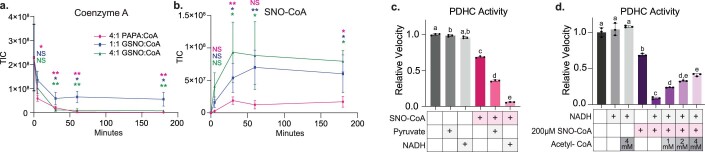
Pyruvate dehydrogenase complex (PDHC) and oxoglutarate dehydrogenase complex (OGDC), which belong to the mitochondrial α-ketoacid dehydrogenase family, play crucial roles in cellular metabolism. These multi-subunit enzyme complexes use lipoic arms covalently attached to their E2 subunits to transfer an acyl group to coenzyme A (CoA). Here, we report a novel mechanism capable of substantially inhibiting PDHC and OGDC: reactive nitrogen species (RNS) can covalently modify the thiols on their lipoic arms, generating a series of adducts that block catalytic activity. S-Nitroso-CoA, a product between RNS and the E2 subunit's natural substrate, CoA, can efficiently deliver these modifications onto the lipoic arm. We found RNS-mediated inhibition of PDHC and OGDC occurs during classical macrophage activation, driving significant rewiring of cellular metabolism over time. This work provides a new mechanistic link between RNS and mitochondrial metabolism with potential relevance for numerous physiological and pathological conditions in which RNS accumulate.


Conflict of interest statement

The authors declare no competing interests.

Figures

Fig. 1
Fig. 1. NO production temporally correlates with the loss of catalytically active lipoic arm and PDHC and OGDC activity.
a, PDHC and OGDC activity, DLAT and DLST level and their lipoylation state, and iNOS level in RAW 264.7 cells stimulated with LPS + IFN-γ for the indicated time. b, PDHC activity, iNOS expression, protein lipoylation state and total DLAT level in murine BMDM stimulated with LPS + IFN-γ for the indicated time. ce. The abundance of intracellular acetyl-CoA (c), succinyl-CoA (d) and citrulline (e) in BMDM stimulated with LPS + IFN-γ for the indicated time. ND, not detected. All bars and error bars represent mean ± s.d. (n = 3 distinct samples). Data were analyzed using one-way analysis of variance (ANOVA) followed by Tukey’s post hoc test. Bars not sharing a letter/number are significantly different (P < 0.05) from one another. Exact P values for each comparison are available in the source data. a,b, On lipoic arm western blots, specific bands corresponding to the lipoic arm of DLAT and DLST are labeled based on the expected molecular mass and the position of DLAT and DLST bands, as determined by total DLAT/DLST blots. The blots shown are representative of at least two independent experiments. Source data
Fig. 2
Fig. 2. Loss of PDHC and OGDC activity and their functional lipoic arm depends on NO.
a, Relative PDHC activity and lipoylation state in unstimulated or LPS + IFN-γ stimulated (48 h) RAW 264.7 cells with or without treatment with iNOS inhibitor 1400W (80 µM). Relative activity was normalized to the PDHC activity in unstimulated, untreated cells. b, Labeling patterns of acetyl-CoA, citrate and succinate after incubation with [U-13C]glucose tracer for 24 h in RAW 264.7 cells with or without LPS + IFN-γ stimulation and with or without 1400W for 48 h. M + i indicates the fraction of isotopologue with i-labeled carbons. c, Relative PDHC and OGDC activity and protein lipoylation state in unstimulated and LPS + IFN-γ stimulated (48 h) wild-type (WT) and Nos2 knockout RAW 264.7 cells (Nos2/). Relative activity was normalized to the respective unstimulated condition. P values were determined using the two-tailed Student’s t-test. NS, not significant (P > 0.05). d, Labeling patterns of acetyl-CoA, citrate and succinate after incubation with [U-13C]glucose tracer for 24 h in unstimulated or LPS + IFN-γ stimulated wild-type or Nos2/ RAW 264.7 cells. M + i indicates the fraction of isotopologue with i-labeled carbons. e, Ratio of the labeled malate fraction to the labeled α-KG fraction after incubation with [5-13C]glutamine tracer for 24 h in wild-type or Nos2/ RAW 264.7 cells stimulated with LPS + IFN-γ for the indicated length of time. f, OGDC activity and protein lipoylation state in the lysate of unstimulated RAW 264.7 cells with or without in vitro treatment of NO donor GSNO or EtCys-SNO at the indicated concentrations (3 h, room temperature). g, PDHC activity and protein lipoylation state in RAW 264.7 cells treated with the indicated combination of LPS + IFN-γ, iNOS inhibitor (80 µM 1400W) or NO donor (200 µM DETA NONOate) for 48 h. All bars and error bars represent mean ± s.d. (n = 3 distinct samples). a,eg, Data were analyzed using one-way ANOVA followed by Tukey’s post hoc test. Those not sharing a letter are significantly different (P < 0.05) from one another. Exact P values for each comparison are available in the source data. b,d, Statistical comparison (ANOVA and Tukey’s post hoc test) between each labeled form is provided in the source data. Western blots shown in a, c, f and g are representative of at least two independent experiments. Source data
Fig. 3
Fig. 3. RNS cause S-modifications on lipoic arm and inactivate its catalytic activity.
a,b, Abundance of DHLA (a) and LA (b) after incubation (3 h, room temperature) with or without NO donor, GSNO, DPTA NONOate or PAPA NONOate. c, Formulas, possible structures and relative abundances of major products after DHLA was incubated with the indicated NO donor (3 h, room temperature). Identified products with a unique formula are designated by R#. m/z is the exact mass of a singly charged negative ion. ND, not detected; rt, retention time. d, Depletion of substrate and appearance of products after dihydrolipoyl peptide LSEFDLLAEIETDK(dihydrolipoyl)ATIGFEVQEEGYLAK was incubated with the indicated NO donors in the presence of CoA (3 h, room temperature). m/z is the exact mass of the 3+ ion, R# corresponds to the modifications identified in c. In this LC condition the different isomers of R1 are not well separated by chromatography. Bars and error bars represent mean ± s.d. (n = 3 distinct samples). P values were determined using one-way ANOVA followed by Dunnett’s multiple comparison test. For species not detectable in controls, a one-sample two-sided Student’s t-test was used to test whether the mean was significantly different from 0. e, Schematic of experimental workflow and the catalytic mechanism of PDHC. After incubation with the indicated compounds, enzyme activity was measured after dilution into assay buffer containing all substrates at saturating levels. f, Activity and lipoylation state of purified PDHC following 3 h incubation (room temperature) with NO donors in the presence or absence of the indicated substrates. Independent experiments were combined and normalized to their own control (PDHC incubated in buffer). Bar graph with error bars represents mean ± s.d. n = 4 distinct samples for DPTA NONOate treatment, otherwise n = 5 distinct samples. For comparison between NO donor-treated samples, P values were determined by ANOVA followed by Tukey’s post hoc test. For comparison with the control (PDHC incubated in buffer), P values were determined using a one-sample t-test to determine whether the mean is significantly different from 1. The shown western blot is representative of two independent experiments. Source data
Fig. 4
Fig. 4. CoA delivers RNS modifications to the lipoic arm.
a, Model schematic. CoA, the thiol-containing natural substrate of the E2 subunit, reacts with RNS and delivers modifications to the lipoic arm, blocking its catalytic cycle. Green arrows show that NADH can generate reduced lipoic arm via reversed E3 subunit activity. b, Activity of purified PDHC after 3 h incubation at room temperature with NO donors GSNO (400 µM) or DPTA NONOate (400 µM) in the presence or absence of CoA (400 µM) and/or pyruvate (400 µM). c, Activity of purified PDHC after 3 h incubation (room temperature) with NO donors GSNO (200 µM), DPTA NONOate (600 µM) or PAPA NONOate (600 µM) in the presence or absence of CoA (200 µM) and/or NADH (200 µM). d, Activity of purified PDHC after 1 h incubation with the indicated concentration of SNO-CoA in the presence or absence of NADH (200 µM). e, Activity of purified PDHC after 1 h incubation with 20 µM SNO-CoA in the presence or absence of NADH (200 µM) and varying amounts (as indicated) of CoA. be, Bars and error bars represent mean ± s.d., n = 3 different samples as indicated by individual dots. Data were analyzed using one-way ANOVA followed by Tukey’s post hoc test. Those not sharing a letter are significantly different (P < 0.05) from one another. Exact P values for each comparison are available in the source data. f,g, Relative inhibition of PDHC (f) after purified PDHC was incubated for 1 h (room temperature) with 2 µM SNO-CoA, 200 µM NADH and indicated dosages of additional PAPA NONOate. Relative inhibition is the loss of PDHC activity relative to PDHC control (incubated in buffer without substrate nor NO donor for 1 h). Actual abundance of SNO-CoA in each condition was measured by LC–MS and is shown in g. Bars and error bars represent mean ± s.d., n = 3 different samples as indicated by individual dots. Significance was determined by two-sided Student’s t-test. Source data
Fig. 5
Fig. 5. Recovery of RNS-mediated PDHC and OGDC inhibition in vitro and in cells.
a, Activity of purified PDHC after incubation with indicated combinations of NO donors (GSNO or DPTA NONOate), CoA and pyruvate (3 mM each), and NAD+ (9 mM) followed by 30 min treatment with 10 mM DTT or buffer control. b, Activity of purified PDHC after incubation with or without SNO-CoA (at the indicated concentrations) and NADH (200 µM) followed by 30 min treatment of 10 mM DTT or buffer control. c, Changes in OGDC activity in cell lysate upon in vitro DTT treatment (20 mM). Lysates of unstimulated RAW 264.7 cells that had been incubated in vitro with the indicated combination of substrates and NO donor (GSNO, CoA and α-KG, 1 mM each), and lysate of LPS + IFN-γ stimulated (48 h) RAW 264.7 cells were treated with DTT or buffer control. Relative activity is normalized to OGDC activity in the lysate of unstimulated macrophages. d, PDHC and OGDC activity, total E2 subunit levels and their lipoylation status, and iNOS expression in RAW 264.7 cells over a time course following 2 h acute stimulation with LPS + IFN-γ. Blots are representative of two independent experiments. e, Changes in intracellular succinate, itaconate and 2-HG levels in RAW 264.7 cells over a time course either following 2 h acute stimulation with LPS + IFN-γ (acute) or with continual exposure to LPS + IFN-γ (continual). f, Intracellular succinate, itaconate and 2-HG levels in wild-type and Nos2/ RAW 264.7 cells with or without continual LPS + IFN-γ stimulation for 48 h. af, Bar graphs and error bars represent mean ± s.d., n = 3 distinct samples. Statistical analyses were done using one-way ANOVA followed by Tukey’s post hoc test. Those bars not sharing a letter/number are significantly different (P < 0.05) from one another. Exact P values for each comparison are available in the source data. g, Changes in HIF-1α level and protein lipoylation status in RAW 264.7 cells over a time course following 2 h acute stimulation with LPS + IFN-γ (acute) or continual exposure to LPS + IFN-γ (continual). α-Tubulin levels are shown as a loading control. The blot is representative of three independent experiments. Source data
Extended Data Fig. 1
Extended Data Fig. 1. Loss of functional lipoic arm in conditions with high citrulline accumulation.
Intracellular accumulation of the iNOS product citrulline, total DLAT level, and lipoic arm status in RAW 264.7 cells and murine bone marrow derived macrophages (BMDM) treated with various combinations of LPS, IFNγ and the iNOS inhibitor, 1400W. Bar graph and error bars represent mean ± SD, n=3 distinct samples (in each of the following two conditions, BMDM +IFNγ and RAW 264.7 + LPS + IFNγ + 1400W, citrulline was not detected in one of the 3 samples, so two dots are shown). ND indicates not detected. Data were analyzed using one-way ANOVA followed by Tukey’s post hoc test. Those bars not sharing a letter are significantly different (p<0.05) from one another. Exact P-values for each comparison are available in Source Data. Western blot data is representative of two independent experiments. Source data
Extended Data Fig. 2
Extended Data Fig. 2. Remodeling of glucose metabolism through TCA cycle in LPS+IFNγ stimulated BMDM is largely NO dependent.
a. iNOS level in wild-type and Nos2/ BMDMs stimulated with LPS+IFNγ for indicated time. α-tubulin levels are shown as a loading control. b. The labeling patterns of acetyl-CoA, citrate, and succinate after incubation with 1,2-13C-glucose tracer for 24h in wild-type or Nos2/ BMDM stimulated with LPS+IFN-γ for indicated time. All bars and error bars represent mean ± SD, (n=3 distinct samples). Statistical comparison (ANOVA followed by Tukey’s post-hoc test) between each labeled form is provided in Source Data. Source data
Extended Data Fig. 3
Extended Data Fig. 3. SNO-CoA delivers RNS modifications to the lipoic arm.
a-b. The decrease in CoA level (a) and the appearance of SNO-CoA (b) over time after CoA was mixed with NO donor PAPA NONOate or GSNO at indicated ratio. Statistical difference between each time point comparing to time 0 was determined by Dunnett’s multiple comparisons tests. NS specifies not significant (p>0.05), * signifies p≤0.05, ** signifies p≤0.01. Color of significance indicator corresponds to respective condition with the same color. Exact P-values for each comparison are available in Source Data. Symbol and error bars represent mean ± SD, n=3 distinct samples. TIC, total ion count. c. The activity of purified PDHC after 3h incubation (RT) with ± 200µM SNO-CoA ± 200µM pyruvate ± 200µM NADH, as indicated on figure. d. The activity of purified PDHC after 1h incubation (RT) with 200µM SNO-CoA, 200µM NADH and acetyl-CoA at various doses as indicated. After incubation period and immediately prior to activity measurement, varying amount of acetyl-CoA was added to samples to even out the final acetyl-CoA concentration across all reactions. c-d. Bars and error bars represent mean ± SD, n=3 distinct samples. Data were analyzed using one-way ANOVA followed by Tukey’s post hoc test. Those bars not sharing a letter are significantly different from each other (p<0.05). Exact P-values for each comparison are available in Source Data. Source data

References

    1. Solmonson A, DeBerardinis RJ. Lipoic acid metabolism and mitochondrial redox regulation. J. Biol. Chem. 2018;293:7522–7530. doi: 10.1074/jbc.TM117.000259. - DOI - PMC - PubMed
    1. Perham RN. Swinging arms and swinging domains in multifunctional enzymes: catalytic machines for multistep reactions. Annu. Rev. Biochem. 2002;69:961–1004. doi: 10.1146/annurev.biochem.69.1.961. - DOI - PubMed
    1. Neinast M, Murashige D, Arany Z. Branched chain amino acids. Annu. Rev. Physiol. 2019;81:139–164. doi: 10.1146/annurev-physiol-020518-114455. - DOI - PMC - PubMed
    1. Reed LJ, Damuni Z, Merryfield ML. Regulation of mammalian pyruvate and branched-chain α-keto acid dehydrogenase complexes by phosphorylation–dephosphorylation. Curr. Top. Cell. Regul. 1985;27:41–49. doi: 10.1016/B978-0-12-152827-0.50011-6. - DOI - PubMed
    1. Yan LJ, Sumien N, Thangthaeng N, Forster MJ. Reversible inactivation of dihydrolipoamide dehydrogenase by mitochondrial hydrogen peroxide. Free Radic. Res. 2013;47:123–133. doi: 10.3109/10715762.2012.752078. - DOI - PMC - PubMed

Publication types

MeSH terms

Substances