

Identification of a novel ceRNA network related to prognosis and immunity in HNSCC based on integrated bioinformatic investigation
- PMID: 36266384
- PMCID: PMC9584951
- DOI: 10.1038/s41598-022-21473-0
Identification of a novel ceRNA network related to prognosis and immunity in HNSCC based on integrated bioinformatic investigation
Abstract
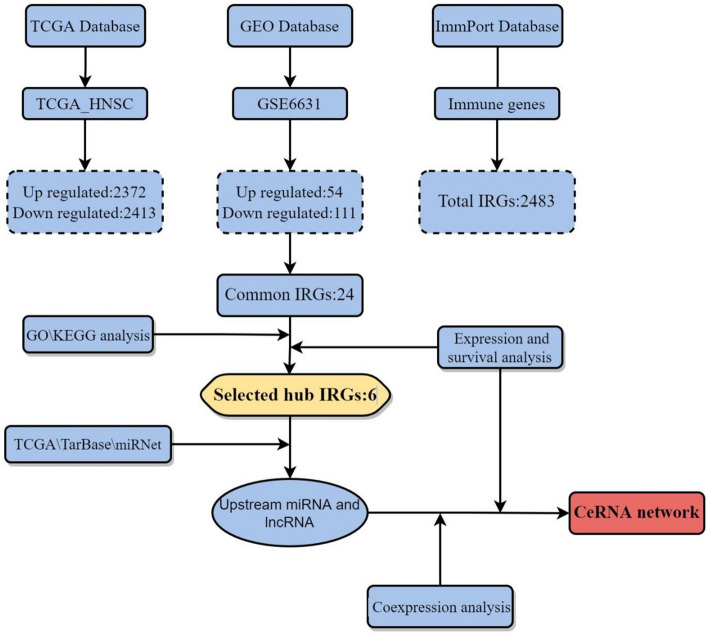
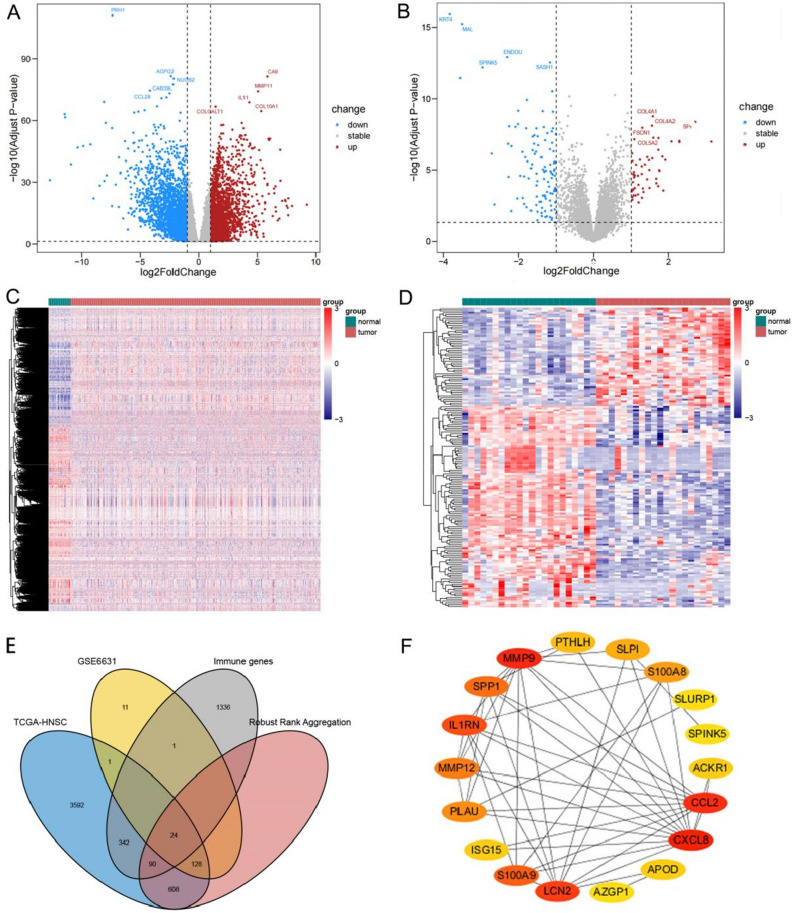
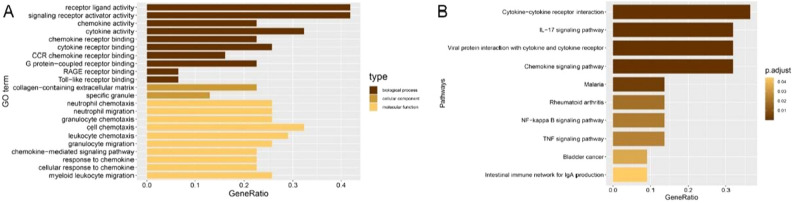
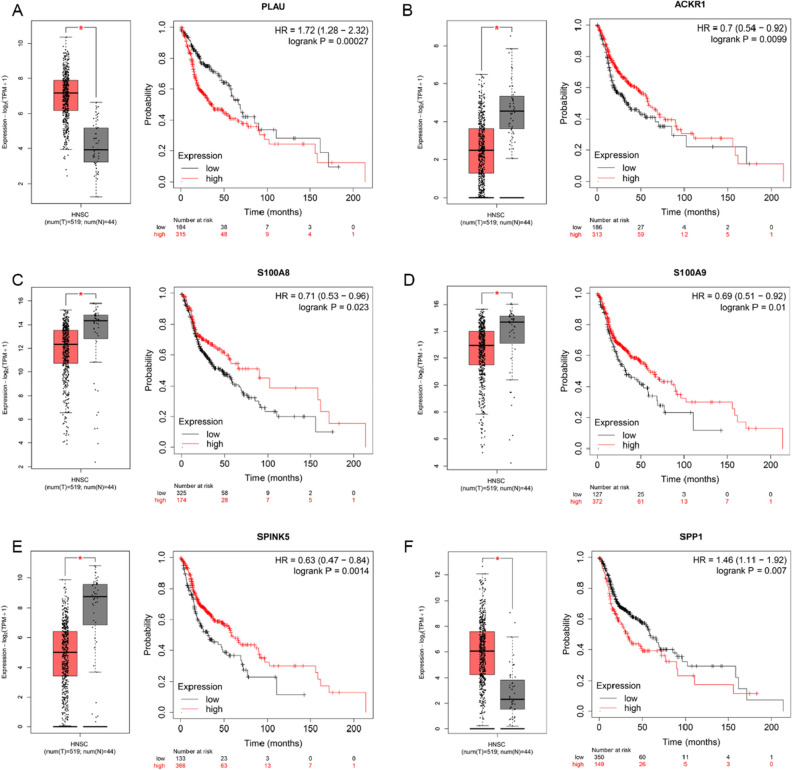
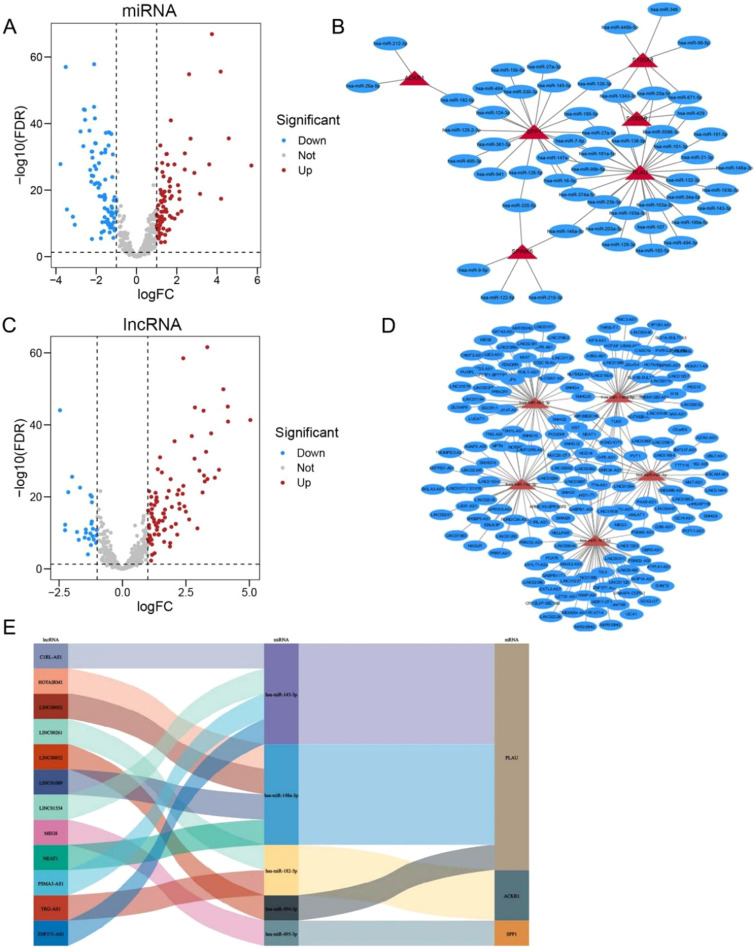
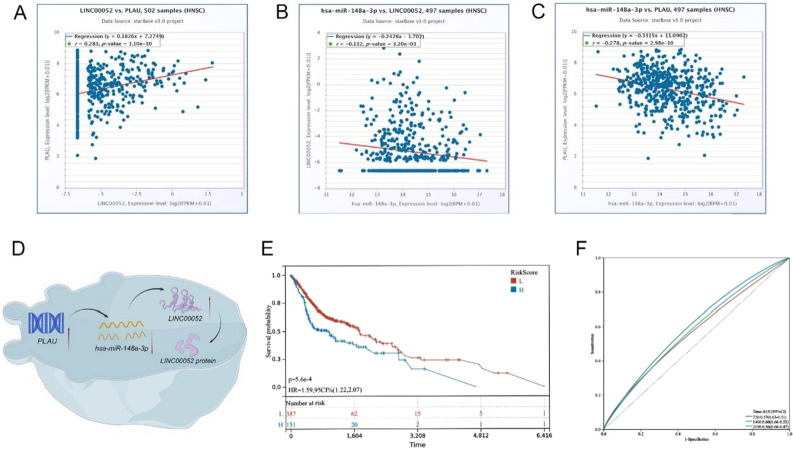
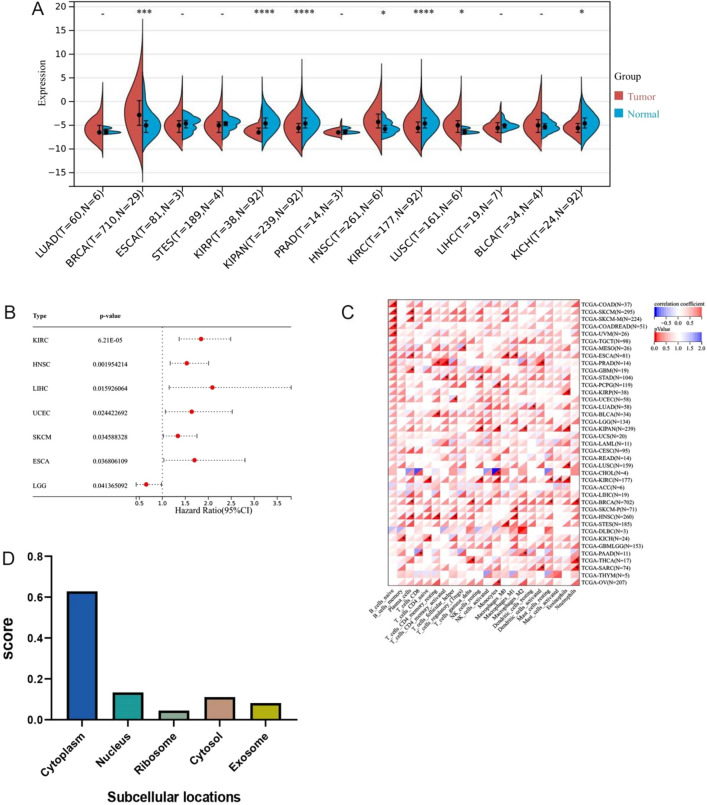
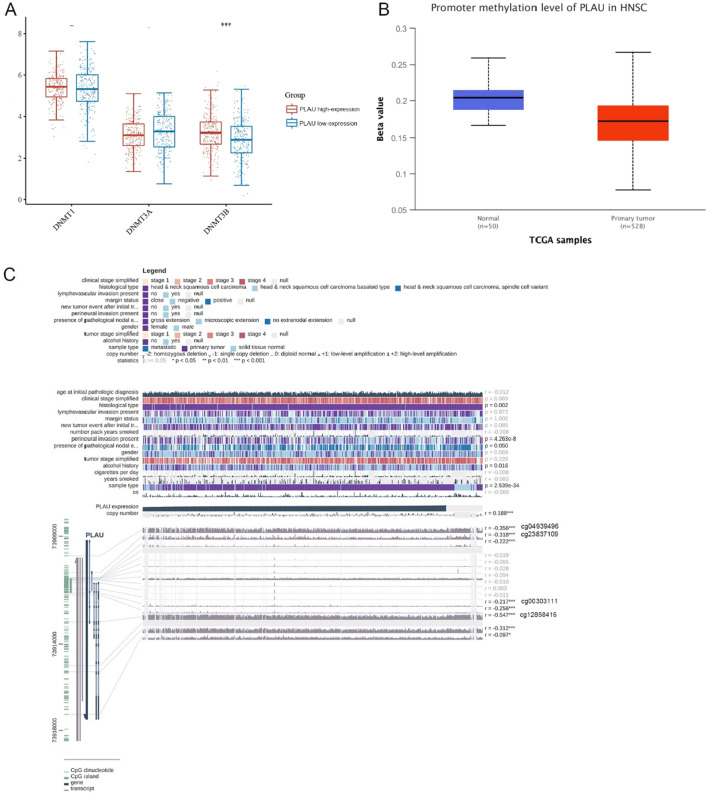
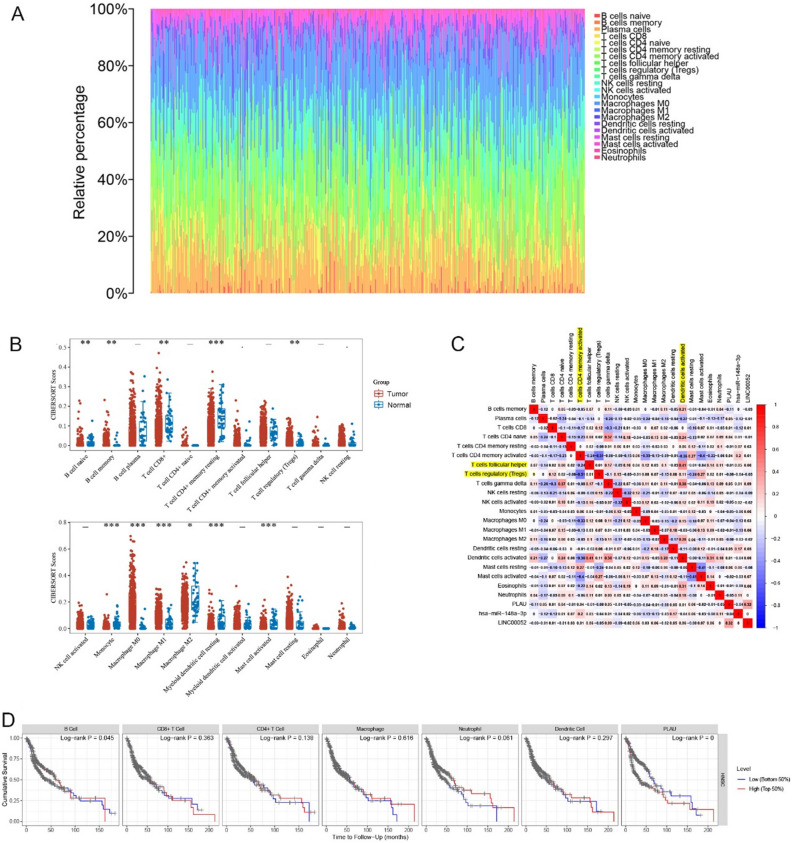
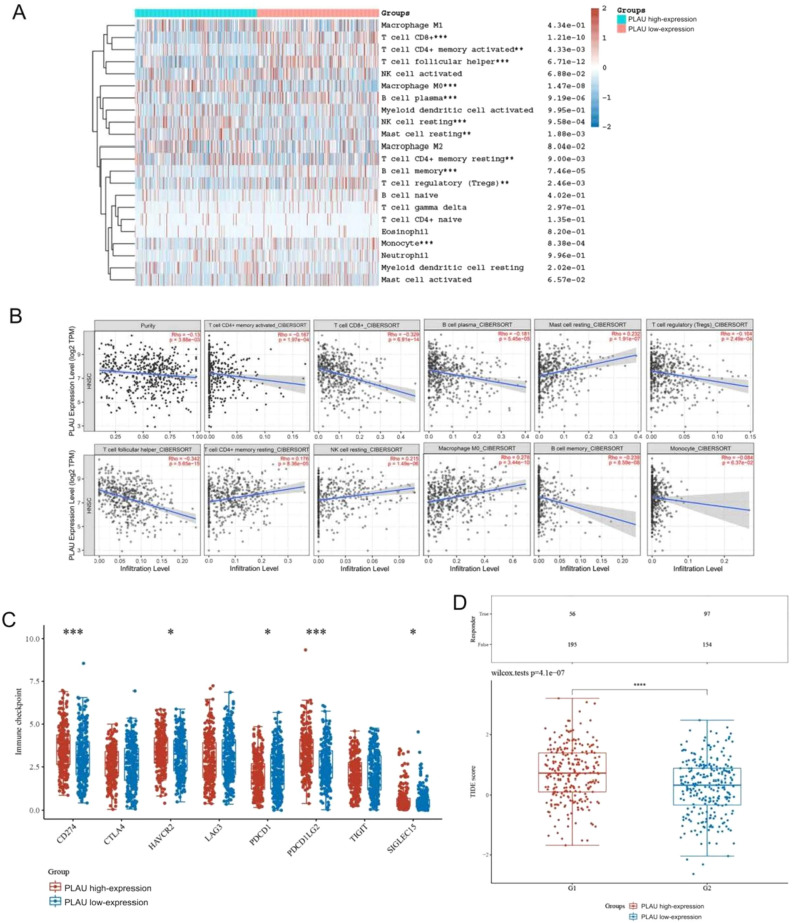
Head and neck squamous cell carcinoma (HNSCC) is characterized by an immunosuppression environment and necessitates the development of new immunotherapy response predictors. The study aimed to build a prognosis-related competing endogenous RNA (ceRNA) network based on immune-related genes (IRGs) and analyze its immunological signatures. Differentially expressed IRGs were identified by bioinformatics analysis with Gene Expression Omnibus (GEO), The Cancer Genome Atlas (TCGA) and ImmPort databases. Finally, via upstream prognosis-related microRNAs (miRNAs) and long noncoding RNAs (lncRNAs) prediction and co-expression analysis, we built an immune-related ceRNA network (LINC00052/hsa-miR-148a-3p/PLAU) related to HNSCC patient prognosis. CIBERSORT analysis demonstrated that there were substantial differences in 11 infiltrating immune cells in HNSCC, and PLAU was closely correlated with 10 type cells, including T cells CD8+ (R = - 0.329), T cells follicular helper (R = - 0.342) and macrophage M0 (R = 0.278). Methylation and Tumor Immune Dysfunction and Exclusion (TIDE) analyses revealed that PLAU upregulation was most likely caused by hypomethylation and that high PLAU expression may be associated with tumor immune evasion in HNSCC, respectively.
© 2022. The Author(s).
Conflict of interest statement
The authors declare no competing interests.
Figures
Similar articles
-
Excavating novel diagnostic and prognostic long non-coding RNAs (lncRNAs) for head and neck squamous cell carcinoma: an integrated bioinformatics analysis of competing endogenous RNAs (ceRNAs) and gene co-expression networks.Bioengineered. 2021 Dec;12(2):12821-12838. doi: 10.1080/21655979.2021.2003925. Bioengineered. 2021. PMID: 34898376 Free PMC article.
-
Immune Infiltration-Related ceRNA Network Revealing Potential Biomarkers for Prognosis of Head and Neck Squamous Cell Carcinoma.Dis Markers. 2022 Sep 2;2022:1014347. doi: 10.1155/2022/1014347. eCollection 2022. Dis Markers. 2022. PMID: 36097539 Free PMC article.
-
Identification novel prognostic signatures for Head and Neck Squamous Cell Carcinoma based on ceRNA network construction and immune infiltration analysis.Int J Med Sci. 2021 Jan 19;18(5):1297-1311. doi: 10.7150/ijms.53531. eCollection 2021. Int J Med Sci. 2021. PMID: 33526991 Free PMC article.
-
Integrated analysis of lncRNA-associated ceRNA network in p16-positive and p16-negative head and neck squamous cell carcinoma.Medicine (Baltimore). 2022 Aug 19;101(33):e26120. doi: 10.1097/MD.0000000000026120. Medicine (Baltimore). 2022. PMID: 35984201 Free PMC article.
-
Expression of SESN1, UHRF1BP1, and miR-377-3p as prognostic markers in mutated TP53 squamous cell carcinoma of the head and neck.Cancer Biol Ther. 2017 Oct 3;18(10):775-782. doi: 10.1080/15384047.2017.1373212. Epub 2017 Sep 8. Cancer Biol Ther. 2017. PMID: 28886272 Free PMC article. Review.
Cited by
-
A deep learning method for classification of HNSCC and HPV patients using single-cell transcriptomics.Front Mol Biosci. 2024 May 30;11:1395721. doi: 10.3389/fmolb.2024.1395721. eCollection 2024. Front Mol Biosci. 2024. PMID: 38872916 Free PMC article.
References
Publication types
MeSH terms
Substances
LinkOut - more resources
Full Text Sources
Medical
Research Materials
