

A mouse model of hepatic encephalopathy: bile duct ligation induces brain ammonia overload, glial cell activation and neuroinflammation
- PMID: 36266427
- PMCID: PMC9585018
- DOI: 10.1038/s41598-022-22423-6
A mouse model of hepatic encephalopathy: bile duct ligation induces brain ammonia overload, glial cell activation and neuroinflammation
Abstract
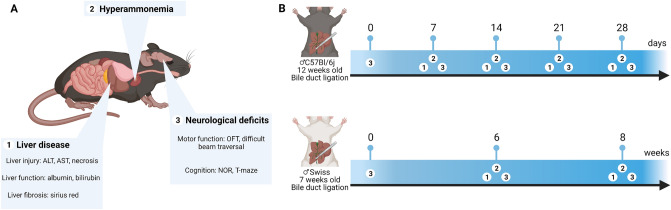
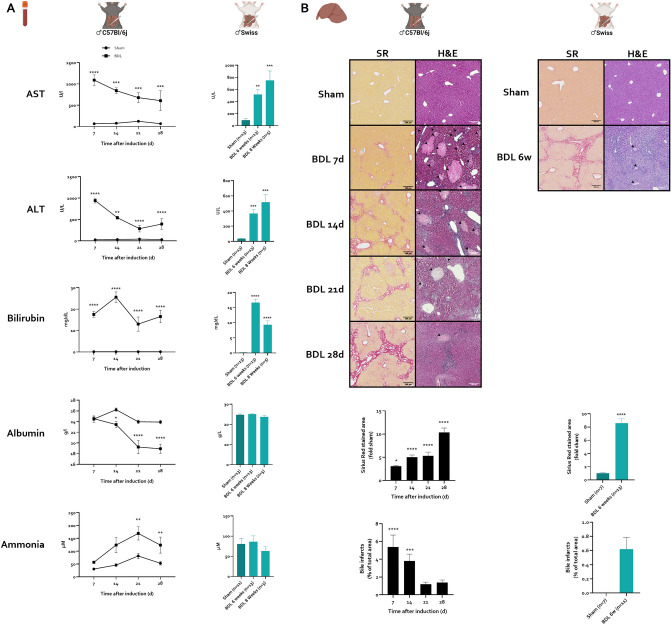
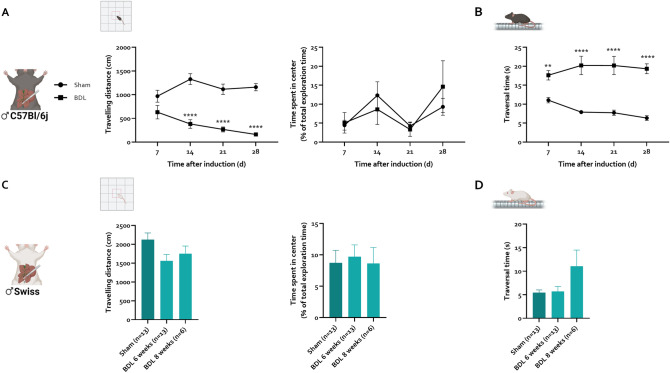
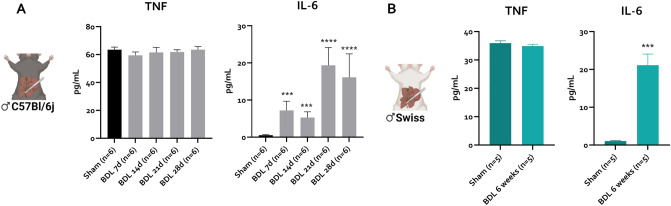
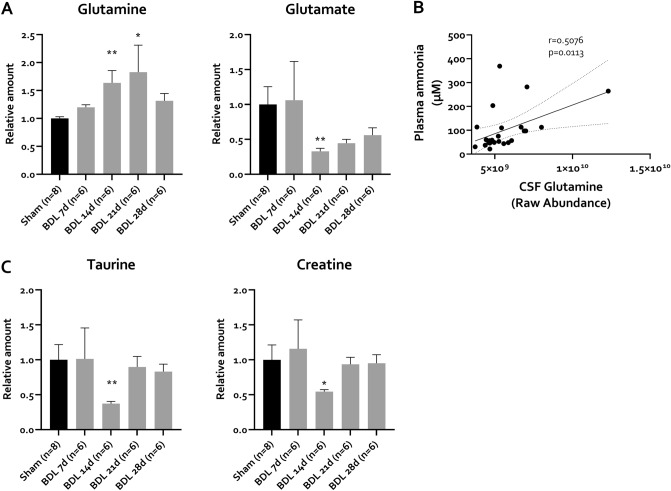
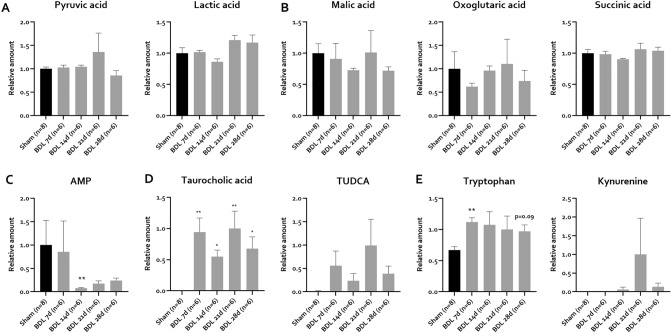
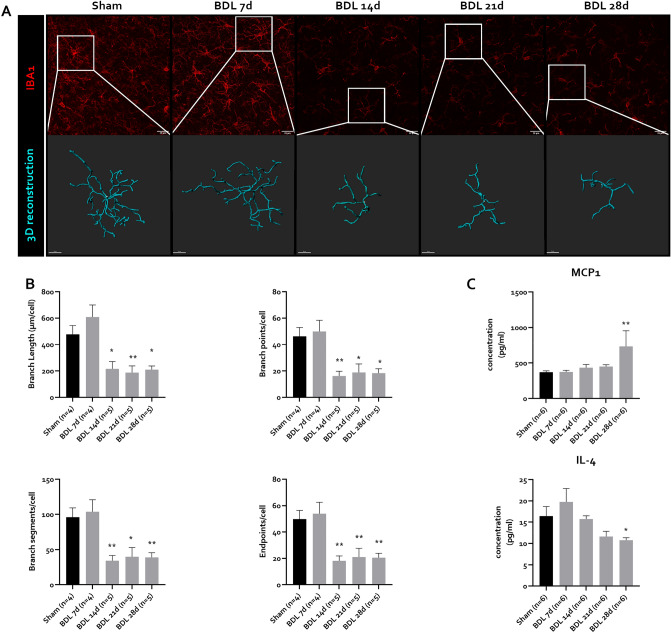
Hepatic encephalopathy (HE) is a common complication of chronic liver disease, characterized by an altered mental state and hyperammonemia. Insight into the brain pathophysiology of HE is limited due to a paucity of well-characterized HE models beyond the rat bile duct ligation (BDL) model. Here, we assess the presence of HE characteristics in the mouse BDL model. We show that BDL in C57Bl/6j mice induces motor dysfunction, progressive liver fibrosis, liver function failure and hyperammonemia, all hallmarks of HE. Swiss mice however fail to replicate the same phenotype, underscoring the importance of careful strain selection. Next, in-depth characterisation of metabolic disturbances in the cerebrospinal fluid of BDL mice shows glutamine accumulation and transient decreases in taurine and choline, indicative of brain ammonia overload. Moreover, mouse BDL induces glial cell dysfunction, namely microglial morphological changes with neuroinflammation and astrocyte reactivity with blood-brain barrier (BBB) disruption. Finally, we identify putative novel mechanisms involved in central HE pathophysiology, like bile acid accumulation and tryptophan-kynurenine pathway alterations. Our study provides the first comprehensive evaluation of a mouse model of HE in chronic liver disease. Additionally, this study further underscores the importance of neuroinflammation in the central effects of chronic liver disease.
© 2022. The Author(s).
Conflict of interest statement
The authors declare no competing interests.
Figures

Similar articles
-
Hyperammonemia induces neuroinflammation that contributes to cognitive impairment in rats with hepatic encephalopathy.Gastroenterology. 2010 Aug;139(2):675-84. doi: 10.1053/j.gastro.2010.03.040. Epub 2010 Mar 18. Gastroenterology. 2010. PMID: 20303348
-
Increased brain lactate is central to the development of brain edema in rats with chronic liver disease.J Hepatol. 2014 Mar;60(3):554-60. doi: 10.1016/j.jhep.2013.10.011. Epub 2013 Oct 26. J Hepatol. 2014. PMID: 24512824
-
Sex is associated with differences in oxidative stress and susceptibility to severe hepatic encephalopathy in bile-duct ligated rats.J Neurochem. 2022 Aug;162(4):337-351. doi: 10.1111/jnc.15661. Epub 2022 Jul 18. J Neurochem. 2022. PMID: 35771118
-
Hepatic Encephalopathy: Current Thoughts on Pathophysiology and Management.Curr Neurol Neurosci Rep. 2025 Mar 28;25(1):28. doi: 10.1007/s11910-025-01415-9. Curr Neurol Neurosci Rep. 2025. PMID: 40153081 Review.
-
The neurogliovascular unit in hepatic encephalopathy.JHEP Rep. 2021 Aug 11;3(5):100352. doi: 10.1016/j.jhepr.2021.100352. eCollection 2021 Oct. JHEP Rep. 2021. PMID: 34611619 Free PMC article. Review.
Cited by
-
Limitations of PLX3397 as a microglial investigational tool: peripheral and off-target effects dictate the response to inflammation.Front Immunol. 2023 Nov 22;14:1283711. doi: 10.3389/fimmu.2023.1283711. eCollection 2023. Front Immunol. 2023. PMID: 38077359 Free PMC article.
-
Cognitive Functions, Neurotransmitter Alterations, and Hippocampal Microstructural Changes in Mice Caused by Feeding on Western Diet.Cells. 2023 Sep 21;12(18):2331. doi: 10.3390/cells12182331. Cells. 2023. PMID: 37759553 Free PMC article.
-
Experimental hepatic encephalopathy causes early but sustained glial transcriptional changes.J Neuroinflammation. 2023 May 29;20(1):130. doi: 10.1186/s12974-023-02814-w. J Neuroinflammation. 2023. PMID: 37248507 Free PMC article.
-
Interaction between Per- and Polyfluorinated Substances (PFAS) and Acetaminophen in Disease Exacerbation-Focusing on Autism and the Gut-Liver-Brain Axis.Toxics. 2024 Jan 3;12(1):39. doi: 10.3390/toxics12010039. Toxics. 2024. PMID: 38250995 Free PMC article. Review.
-
Transcriptome Profile in the Mouse Brain of Hepatic Encephalopathy and Alzheimer's Disease.Int J Mol Sci. 2022 Dec 30;24(1):675. doi: 10.3390/ijms24010675. Int J Mol Sci. 2022. PMID: 36614117 Free PMC article.
References
-
- Giménez-Garzó C, Fiorillo A, Ballester-Ferré M-P, Gallego J-J, Casanova-Ferrer F, Urios A, Benlloch S, Martí-Aguado D, San-Miguel T, Tosca J, et al. A new score unveils a high prevalence of mild cognitive impairment in patients with nonalcoholic fatty liver disease. J. Clin. Med. 2021;10:2806. doi: 10.3390/jcm10132806. - DOI - PMC - PubMed
Publication types
MeSH terms
Substances
LinkOut - more resources
Full Text Sources
Other Literature Sources
Medical
