. 2022 Nov;25(11):1470-1480.
doi: 10.1038/s41593-022-01178-3. Epub 2022 Oct 20.

Neurotensin neurons in the extended amygdala control dietary choice and energy homeostasis

Affiliations

Neurotensin neurons in the extended amygdala control dietary choice and energy homeostasis

Alessandro Furlan et al. Nat Neurosci. 2022 Nov.

Abstract

Obesity is a global pandemic that is causally linked to many life-threatening diseases. Apart from some rare genetic conditions, the biological drivers of overeating and reduced activity are unclear. Here, we show that neurotensin-expressing neurons in the mouse interstitial nucleus of the posterior limb of the anterior commissure (IPAC), a nucleus of the central extended amygdala, encode dietary preference for unhealthy energy-dense foods. Optogenetic activation of IPACNts neurons promotes obesogenic behaviors, such as hedonic eating, and modulates food preference. Conversely, acute inhibition of IPACNts neurons reduces feeding and decreases hedonic eating. Chronic inactivation of IPACNts neurons recapitulates these effects, reduces preference for sweet, non-caloric tastants and, furthermore, enhances locomotion and energy expenditure; as a result, mice display long-term weight loss and improved metabolic health and are protected from obesity. Thus, the activity of a single neuronal population bidirectionally regulates energy homeostasis. Our findings could lead to new therapeutic strategies to prevent and treat obesity.


Figures

Extended Data Fig. 1
Extended Data Fig. 1. IPACNts neurons encode the hedonic value of a stimulus
(a) Schematics showing the locations of optic fiber placement in the mice used in Figure 2 and 3. (b) Feeding behavior of mice when presented with HFD (green) or chow (orange), for 20 minutes, in food restricted (FR, left) or sated condition (right). N=8. Group effect: F(1,7)=95.19, p<0.0001, **p<0.01; ****p<0.0001; Two-way RM ANOVA, Sidak’s test. (c, d) Schematics of the experimental setup (c) and task structure (d) used in Figure 2. Bottom panel: representative raster plot showing licking behavior following liquid delivery. (e) Drinking behavior of wild-type mice when presented with Intralipid 0.5% (Fat 0.5%, green) or water (orange), in a 2-bottle preference test, for 72-h, in sated condition. N=6 mice. ***P=0.0003, paired t-test. (f-h) Food-restricted (FR) mice (f) and water-restricted (WR) mice (g, h) were presented with equal volumes of liquids in the same session. Left: Area under the curve (AUC) of GCAMP6f signals. Right: licking behavior (behavior) of mice. AUC and licking behavior were measured in a 3-s window following the first lick. Paired t-tests, n=5 mice/group in all panels. (f) Sucrose (green) or sucralose (orange); AUC: p=0.1071 (n.s.); Behavior: *p=0.0462. (g) Monosodium glutamate (MSG, green) or water (orange); AUC: p=0.3008 (n.s.); Behavior: p=0.7061 (n.s.). (h) Citric acid (green) or water (orange); AUC: p=0.1997 (n.s.); Behavior: p=0.8677 (n.s.).
Extended Data Fig. 2
Extended Data Fig. 2. Response of IPACNts neurons to odors from several diets
(a, b) Heatmaps of the response of IPACNts neurons in individual mice to odors derived from different food sources, under sated or food-restricted condition, as indicated. Dashed lines indicate the onset of odor presentation. (c) Average GCaMP6f signals from IPACNts neurons in food-restricted mice aligned to the presentation of different odors (dashed line). (d) Area under the curve (AUC) of the responses in individual mice in (c) in a 3-s window following odor presentation. N=4 mice. F(3,9)=10.36, p=0.0028; *p<0.05, **p<0.01, n.s., p>0.05; one-way RM ANOVA, Holm-Sidak’s test. (e) Average GCaMP6f signals from IPACNts neurons in sated mice aligned to odor presentation (dashed line). (f) Area under the curve (AUC) of the responses in individual mice in (e) in a 3-s window following odor presentation. N=5 mice. F(3,12)=5.169, p=0.0160; *p<0.05, p>0.05 (n.s); one-way RM ANOVA, Holm-Sidak’s test.
Extended Data Fig. 3
Extended Data Fig. 3. Characterization of behavioral effects following activation of IPACNts neurons
(a) Optic fiber placement for mice in Fig. 4. (b) Effect of photostimulation of IPACNts neurons in mice fed dark chocolate (DCh), chow, sucrose, HFD, white chocolate (WCh). ChR2 (n=9) or GFP (n=6) for DCh, ChR2 (n=9) or GFP (n=8) for chow, sucrose, HFD, WCh. Two-way RM ANOVA, Sidak’s test. DCh, group effect: F(1,13)=7.374, p= 0.0177; chow, group effect: F(1,15)=8.999, p=0.0090; sucrose, group effect: F(1,15)=7.829, p=0.0135; HFD, group effect: F(1,15)=21.22, p=0.0003; WCh, group effect: F(1,15)=22.56, p=0.0003. (c) Effect of photostimulation of IPACNts neurons in mice presented with an inedible pencil eraser. ChR2 (n=9) or GFP (n=6). two-way RM ANOVA, Sidak’s test. Gnawing, interaction effect: F(2,26)=4.939, p=0.0152; intake: F(2,26)=1.066, p=3591 (n.s.). ****p<0.0001; p>0.05(n.s.). (d, e) Photostimulation of IPACNts neurons increased the number (d) and the duration (e) of feeding bouts in ChR2 (n=9) but not GFP mice (n=7). (d) GFP: *p=0.0465, ChR2: **p=0.0028; (e) GFP: p=0.0982(n.s.), ChR2: ***p=0.0007, paired t-test. (f) Effect of photostimulation of IPACNts neurons in ChR2 mice fed quinine-flavored or plain chow pellets (n=5). Interaction effect: F(2,8)=9.476, p=0.0078, **p<0.01, two-way RM ANOVA, Sidak’s comparisons test. (g) Effect of photostimulation of IPACNts neurons on liquid consumption (control for Figure 4e). GFP mice (n=5), interaction effect: F (4, 16)=1.119, p=0.3820 (n.s.). Two-way RM ANOVA. (h) Self-stimulation paradigm (left) and quantification of the poking responses of ChR2 (n=9) and GFP mice (n=8). Group effect: F(1,15)=37.63, p<0.0001; ****p<0.0001; p>0.05 (n.s.), two-way RM ANOVA, Sidak’s test. (i) Distance travelled in the RTPP/A task. ChR2 (n=11) and GFP (n=8) mice. Group effect: F(1,17)=34.11, p<0.0001; ****p<0.0001; p>0.05 (n.s.), two-way RM ANOVA, Sidak’s test. (j) Distance traveled in the open field test. ChR2 (n=8) and GFP (n=6) mice. Group effect: F(1,12)=17.30, p=0.0013; ****p<0.0001; p>0.05 (n.s.) two-way RM ANOVA, Sidak’s test.
Extended Data Fig. 4
Extended Data Fig. 4. Inactivation of IPACNts neurons impairs hedonic perception
(a) HFD intake over a 2-h period in sated NtsCre mice expressing mCherry (gray, control) or KORD (red) injected with DMSO or SalB. mCherry mice, n= 7; KORD mice, n=5. paired t-test. Cherry DMSO-SaLB: p=0.7748, (n.s.); KORD DMSO-SaLB: p=0.1066 (n.s.). Paired t-test.(b) Percentage change of chow intake in food-restricted mice expressing mCherry (gray, control) or KORD (red) when injected with SaLB, normalized to their intake when injected with DMSO, within 30 minutes from food presentation. mCherry mice, n=7; KORD mice, n=5. *p = 0.0326. Unpaired t-test. (c) Daily water intake of the GFP mice (n=10) and TeLC mice (n=8) fed chow. p=0.8023 (n.s.), unpaired t-test. (d) Daily water intake of the GFP mice (n=10) and TeLC mice (n=8) fed HFD. *p=0.0305, unpaired t-test. (e) Schematic of the 2-bottle preference test (left) for sucralose (center) and sucrose (right). Sucralose: GFP mice (n=5), TeLC mice (n=5): **p=0.0055, unpaired t-test. Sucrose: GFP mice (n=6); TeLC mice (n=5); p=0.6488 (n.s.), unpaired t-test. Legend: L, left bottle, R, right bottle. (f) Comparison of energy intake from chow and HFD diets (derived from Figure 5i and 5j). GFP (n=10): ****p<0.0001; TeLC mice (n=8): p=0.3562 (n.s.); paired t-test. (g) Change in energy intake after the switch from chow to HFD. ***P=0.0002, unpaired t-test.
Extended Data Fig. 5
Extended Data Fig. 5. Inactivation of IPACNts neurons has positive metabolic effects
(a) Changes in body weight (BW) following injection (d0). GFP mice (n=11): F(3, 30)=6.588, p=0.0015; **p<0.01; ***p<0.001; TeLC mice (n=10): F(3, 27)=28.11, p<0.0001; ****p<0.0001, p>0.05 (n.s.); one-way RM ANOVA, Sidak’s test. (b) Volume of carbon dioxide produced (VCO2) by GFP (n=10) and TeLC mice (n=8). Group effect: F(1, 16)=5.745, p=0.0291, two-way RM ANOVA. (c) Average carbon dioxide production (VCO2) of the mice in (b). GFP (n=10); TeLC (n=8). Group effect: F(1, 16)=5.603, p=0.0309; *p<0.05, p>0.05 (n.s.); two-way RM ANOVA, Sidak’s test. (d) Respiratory exchange ratio (RER) of GFP (n=10) and TeLC mice (n=8). Interaction effect: F(70,1120) = 5.042, p<0.0001, two-way RM ANOVA. (e) Average RER of GFP (n=10) and TeLC mice (n=8) fed chow. Interaction effect: F(1, 16)=7.546, *p=0.0143; two-way RM ANOVA, Sidak’s test. (f) Average energy expenditure of GFP (n=10) and TeLC mice (n=8) fed HFD. Group effect: F(1, 16)=6.526, p=0.0212; *p<0.05, n.s., p>0.05; two-way RM ANOVA, Sidak’s test. (g) Average oxygen consumption (VO2) of GFP (n=10) and TeLC mice (n=8) fed HFD. Group effect: F(1, 16)=6.066, *p=0.0255, p>0.05 (n.s.); two-way RM ANOVA, Sidak’s test. (h) Average carbon dioxide production (VCO2) of GFP (n=10) and TeLC mice (n=8) fed HFD. Group effect: F(1, 16)=5.276, *p=0.0355, p>0.05 (n.s.); two-way RM ANOVA, Sidak’s test. (i) Average locomotor activity of GFP (n=10) and TeLC mice (n=8) fed HFD. Group effect: F(1,16)=25.21, p<0.0001; ****p<0.0001, p>0.05 (n.s.), two-way RM ANOVA, Sidak’s test.
Extended Data Fig. 6
Extended Data Fig. 6. Network of IPACNts neurons
(a) Representative images of brain areas innervated by IPACNts (green) and mBSTNts (red) neurons. Scale bar: 100 μm. STLV: ventral lateral division of the BNST; STMA: anterior medial division; VP: ventral pallidum; CPu: caudate putamen; IPAC: interstitial nucleus of the posterior limb of the anterior commissure (aca); LC: locus coeruleus; PBN: parabrachial nu.; CeA: central amygdala; BLA: basolateral amygdala; PAG: periacqueductal gray; DR: dorsal raphe. (b) Representative image of smFISH for Nts on retrograde labelled CT-B+ neurons in the IPAC. The square in the image show the high-magnification area showed in Figure 7h (right). Scale bar: 100μm. (c) Schematics showing the locations of optic fiber placement in the mice used in Figure 7. (d) Effect of light delivery into the IPAC of the ChR2 (n=9) or GFP (n=5) mice on gnawing (left) and consumption (right) of inedible items (i.e., pencil eraser). Gnawing (group effect): F(1,12)=11.51, p =0.0053, two-way RM ANOVA, Sidak’s test. ****p<0.0001. Intake: (group effect): F(1,12)=0.5327, p=4783, two-way RM ANOVA . (e) Preference of ChR2 (n=8) and GFP mice (n=6) for the left chamber side. Interaction effect: F(2,24)=125.1; p<0.0001; ****p<0.0001; p>0.05 (n.s.). Two-way RM ANOVA, Sidak’s test.
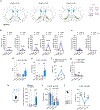
Figure 1.
Figure 1.. IPACNts neurons are activated by palatable food in vivo
(a) A coronal brain section containing the IPAC (yellow) and the FS (green) from a representative NtsCre;Ai14 mouse. Scale bar: 200 μm. STLV/D: ventral/dorsal lateral division of the BNST; STMA/V: anterior medial/ventral division; VP: ventral pallidum; CPu: caudate putamen; LSV: lateral septum; FS: fundus strati; LPO: lateral preoptic area; IPAC: interstitial nucleus of the posterior limb of the anterior commissure (aca). (b) A Representative image of IPAC tissue stained for Nts, Gad2 and Vglut2. DAPI labels nuclei. Scale bar: 50 μm. (c-e) Representative images of IPAC tissue stained for c-Fos and Nts from food-restricted mice (FR, c), FR mice fed chow (FR + chow, d) and FR mice fed HFD (FR + HFD, e). DAPI labels nuclei. Scale bar: 200 μm. (f-k) Quantification of (c-e) in IPAC (f-h, yellow) and FS (i-k, green). N=5 mice in each group; (f): F(2,12)=18.16, p=0.0002; (g): F(2,12)=26.61, p<0.0001; (h): p=0.0318; (i): F(2,12)=4.619, p=0.0325; (j): F(2,12)=1.660, p=0.2309; (k): p=0.1393. (f, g, i, j): One-way ANOVA followed by Sidak’s multiple comparisons test. ****p<0.0001; ***p<0.001, ***p<0.01; *p<0.05; p>0.05 (n.s.). (h, k): unpaired t-test. (l) Quantification of energy intake (calories, left) and food intake (grams, right) and in mice fed chow and HFD. Left: p=0.5295 (n.s.); right: p=0.3450 (n.s.), unpaired t-test. Data are presented as mean ± s.e.m.
Figure 2.
Figure 2.. IPACNts neurons encode the hedonic value of a tastant
(a) Representative histological image. Scale bar: 100 μm. STLV/D: ventral/dorsal lateral division of the BNST; STMA/V: anterior medial/ventral division; CPu: caudate putamen; IPAC: interstitial nucleus of the posterior limb of the anterior commissure (aca). (b) Food-restricted (FR) mice presented with HFD (green trace) or chow (orange trace). Feeding bouts: 10 seconds. Dashed line: stimulus presentation. Gray/blue traces: isosbestic controls. n=5 mice. (c) Mice sated on chow presented with HFD. Feeding bouts: 10 seconds. Dashed line: stimulus presentation. Gray trace: isosbestic control. n=7 mice. (d-i) Food-restricted (FR) mice (d-f) and water restricted (WR) mice (g-i) were given equal volumes of liquids in the same session. Left: average GCaMP6f signals from IPACNts neurons. Dashed line: stimulus presentation (first lick). Center: Area under the curve (AUC) of GCAMP6f signals. Right: licking behavior (behavior) of mice. AUC and licking behavior were measured in a 3-s window following the first lick. Gray/blue traces: isosbestic controls. Paired t-tests, n=5 mice/group in all panels. (d) Intralipid (Fat 20%, green trace) or water (orange trace); AUC: *p=0.0234; Behavior: ***p=0.0002. (e) Intralipid 5% (Fat 5%, green trace) or Intralipid 0.5% (Fat 0.5%, orange trace); AUC: *p=0.0309; Behavior: ***p=0.0008. (f) Sucrose (green trace) or water (orange trace); AUC: *p=0.0388; Behavior: ****p<0.0001. (g) Sucralose (green trace) or water (orange trace); AUC: **p=0.0049; Behavior: *p=0.0109. (h) Quinine (green trace) or water (orange trace); AUC quinine 0.5 mM – water: p=0.0874; AUC quinine 1 mM – water: **p=0.0095; Behavior quinine 0.5 mM – water: p=0.0576; Behavior quinine 1 mM – water: **p=0.0057. (i) Sodium Chloride (NaCl, green trace) or water (orange trace); AUC: p=0.9292 (n.s.); Behavior: p=0.7136 (n.s.). (j) Correlation between the amplitude of GCaMP6f signals from IPACNts neurons for a tastant (Z-Score %, x-axis) and licking behavioral preference for such tastant. ****P<0.0001, R2=0.4685. Pearson correlation test. Data are presented as mean ± s.e.m.
Figure 3.
Figure 3.. IPACNts neurons encode the hedonic value of an odor
(a) A schematic of the experimental setup to test odor preference. (b) Heatmaps of average GCaMP6f responses of IPACNts neurons in individual mice. Dashed line: stimulus presentation. HFD: high fat diet; BA: butyric acid; MO: mineral oil. (c) Average GCaMP6f signals from IPACNts neurons in food-restricted mice to HFD, BA and MO. Dashed line: stimulus presentation. (d) Area under the curve (AUC) of the responses in individual mice measured in a 3-s window following the odor presentation. n=10 mice, F(2,18)=21.06, p<0.0001; ***p<0.001, ****p<0.0001; One-way RM ANOVA, Holm-Sidak’s test. (e) Mouse behavioral preference for coconut oil-based (HFDCO) and olive oil-based (HFDOO) high fat diets. (f) Average GCaMP6f signals from IPACNts neurons of mice in (e), in food restriction, aligned to odor presentation (dashed line). (g) AUC of the responses of mice in (e, f), in food restriction, in a 3-s window following the odor presentation. Dashed line: stimulus presentation. N=8 mice, F(3,21)=11.96, p<0.0001; n.s., p>0.05, *p<0.05, ***p<0.001; one-way RM ANOVA , Holm-Sidak’s test. (h) AUC of the responses of mice in (e), sated, in a 3-s window following the odor presentation. N=8 mice, F(3,21)=8.546, p= 0.0007; n.s., p>0.05, *p<0.05, **p<0.01; one-way RM ANOVA, Holm-Sidak’s multiple comparisons test. (i) Average responses of IPACNts neurons in (g) and (h) are replotted for visual inspection. Interaction effect: F(3,21)=5.394, p=0.0065; *p<0.05, two-way RM ANOVA, Holm-Sidak’s test. (j) IPACNts neurons responded more to the preferred than the non-preferred HFD in food-restricted mice (left), but not sated mice (right). N=8 mice.F(1,7)=8.769, p=0.0211; p>0.05 (n.s), *p<0.05; two-way RM ANOVA, Holm-Sidak’s test. Data are presented as mean ± s.e.m.
Figure 4.
Figure 4.. Activation of IPACNts regulates dietary choices
(a) Representative histological image. Scale bar 200 μm. STLV/P/D: ventral/posterior/dorsal lateral division of the BNST; VP: ventral pallidum; CPu: caudate putamen; IPAC: interstitial nucleus of the posterior limb of the anterior commissure (aca). (b) Left: schematic of the paradigm. Right: intake of fed chow or HFD. ChR2 (n=9), interaction effect: F(2,16)=17.75, p<0.0001, ****p<0.0001; GFP (n=8), group effect: F(1,7) = 9.164, p=0.0192, p>0.05(n.s.); two-way RM ANOVA, Sidak’s test. (c) Intake of mice fed white or dark chocolate. ChR2 (n=9), F(2,16)=19.12, p<0.0001, ****p<0.0001; GFP (n=6), F(2,10) = 5.6, p=0.0234, **p<0.001; two-way RM ANOVA, Sidak’s test. (d) Correlation between food intake at baseline and during photostimulation. ChR2 (n=9): **p=0.0018; GFP (chow, sucrose, HFD, WhC: n=8; DCh: n=6), p = 0.5860 (n.s.); Pearson’s test. (e) Liquid intake of ChR2 mice (n=7). interaction effect: F(4,24)=14.90, p<0.0001, *p<0.05; ****p<0.0001; **p<0.001 between sucrose and quinine during the first laser off period; two-way RM ANOVA, Turkey’s test. (f) Correlation between liquid intake at baseline and during photostimulation. ChR2 (n=7): **p=0.0016; GFP (n=5), *p=0.0374. Pearson’s test. (g) Preference for HFDCO over HFDOO with light off. N=5 mice per group, p=0.9385 (n.s.), unpaired t-test. (h) Intake of mice (in g) on HFDCO and HFDOO with light on. ChR2 (n=5), interaction effect: F(2,8)=9.443, p=0.0078, **p<0.01; GFP (n=5), interaction: F(2,8)=0.9049, p=0.4423; two-way RM ANOVA, Sidak’s test. (i) Paradigm for conditional flavor preference. (j) Effects of light delivery on food preference. N=5 mice per group, **p=0.0082, paired t-test. (k) Left: Heatmaps of a representative mouse in the RTPP/A task; Right: Preference of ChR2 (n=11) and GFP (n=8) mice for left chamber. Interaction effect: F(2,34)=208.5; p<0.0001; ****p<0.0001; p>0.05 (n.s.), two-way RM ANOVA, Sidak’s test. (l) Self-stimulation behavior of ChR2 mice (n=5) under different homeostatic states. F(2,8)=1.463, p=0.2875 (n.s.), one-way ANOVA. Data are presented as mean ± s.e.m.
Figure 5.
Figure 5.. Inhibition and inactivation of IPACNts neurons both disrupt feeding
(a) An image showing KORD expression in IPACNts neurons in a representative NtsCre mouse. STLV/D: ventral/dorsal lateral division of the BNST; STMA/V: anterior medial/ventral division; VP: ventral pallidum; CPu: caudate putamen; IPAC: interstitial nucleus of the posterior limb of the anterior commissure (aca). Scale bar 200 μm. (b) Chow intake over a 1-h period in food-restricted (FR) NtsCre mice. mCherry mice, n=6; KORD mice, n=5. paired t-test. Cherry DMSO-SaLB: p=0.0785, (n.s.); KORD DMSO-SaLB: **p=0.0031. Paired t-test. (c) HFD intake over a 1-h period in sated NtsCre mice. mCherry mice, n=7; KORD mice, n=5. paired t-test. Cherry DMSO-SaLB: p=0.3194, (n.s.); KORD DMSO-SaLB: *p=0.0141. Paired t-test. (d) Water intake over a 1-h period in water restricted (WR) NtsCre mice. mCherry mice, n=6; KORD mice, n=6. paired t-test. Cherry DMSO-SaLB: p = 0.8725 (n.s.); KORD DMSO-SaLB: p=0.1672 (n.s.). Paired t-test. (e) Locomotion activity over a 1-h period in sated NtsCre mice. mCherry mice, n=6; KORD mice, n=6. paired t-test. Cherry DMSO-SaLB: p=0.1433 (n.s.); KORD DMSO-SaLB: p=0.8981 (n.s.). Paired t-test. (f) An image showing TeLC expression in IPACNts neurons in a representative NtsCre mouse. Scale bar 200 μm. (g) Chow intake over a 1-h period in food-restricted (FR) NtsCre mice. GFP mice, n= 5; TeLC mice, n=5; **p=0.0071. Unpaired t-test. (h) Water intake over a 1-h period in water-restricted (WR) NtsCre mice. GFP mice, n=5; TeLC mice, n=5; p=0.7085 (n.s.). Unpaired t-test. (i) Daily chow intake over a 72-h period of NtsCre mice. GFP mice, n=10; TeLC mice, n=8; p=0.0785 (n.s.). Unpaired t-test. (j) Daily HFD intake over a 96-h period of NtsCre mice. GFP mice, n=10; TeLC mice, n=8; **p=0.0073. Unpaired t-test. (k) Acute changes in bodyweight (BW) following 4 days of HFD. Interaction effect: F(1,16)=19.45, p=0.0004, ****p<0.0001. Two-way RM ANOVA followed by Sidak’s multiple comparisons test. Data are presented as mean ± s.e.m.
Figure 6.
Figure 6.. Inactivation of IPACNts neurons protects from obesity and ameliorates metabolic syndrome
(a) Body weight (BW) of GFP (n=11) and TeLC mice (n=10) fed chow. Group effect: F(1,19)=57.80, ****p<0.0001; two-way RM ANOVA, Sidak’s test. (b) Energy expenditure of GFP (n=10) and TeLC mice (n=8) fed chow. Group effect: F(1, 16)=5.934, p=0.0269; *p<0.05, p>0.05(n.s.); two-way RM ANOVA, Sidak’s test. (c, d) Locomotor activity of GFP (n=10) and TeLC mice (n=8) fed chow. (c): Interaction effect: F(70,1120)=7.699, p<0.0001, two-way RM ANOVA; (d): Group effect: F(1,16)=37.84, p<0.0001; ****p<0.0001, p>0.05 (n.s.), two-way RM ANOVA, Sidak’s test. (e, f) Oxygen consumed (VO2) by GFP (n=10) and TeLC mice (n=8) fed chow. (e): Interaction effect: F(70,1120)=2.221, p<0.0001, two-way RM ANOVA; (f): Group effect: F(1, 16)=5.604, *p=0.0309, p>0.05 (n.s.); two-way RM ANOVA, Sidak’s test. (g) A representative GFP and a TELC mouse under DIO. Scale bar: 1 cm. (h) Bodyweight (BW) of mice under DIO. GFP (n=10), TeLC (n=8). Group effect: F(1, 16)=19.72, ***p<0.0004; two-way RM ANOVA. (i) RER of mice under DIO. GFP (n=10), TeLC (n=8). Group effect: F(1, 16)=10.71, p=0.0048; *p<0.05; two-way RM ANOVA Sidak’s test. (j, k) Blood glucose levels during GTT (j) and ITT (k) of mice under DIO. GFP (n=10), TeLC (n=8). (j): Group effect: F(1, 16)=8.366, p=0.0106; (k): Group effect: F(1, 16)=9.683, p=0.0067; *p<0.05, **p<0.01; two-way RM ANOVA, Sidak’s test. (l) Left: BAT tissue of mice under DIO (H&E staining). Scale bar: 20 μm. Right: number of lipid droplets in BAT. GFP (n=9); TeLC (n=8); **p=0.0037, unpaired t-test. (m) Left: liver tissue of mice under DIO (Red-Oil staining). Scale bar: 10 μm. Right: area of lipid droplets in liver. GFP (n=9); TeLC (n=8); **p=0.0025, unpaired t-test. (n) WAT weight, normalized to GFP mice. GFP (n=9); TeLC (n=8); group effect: F(1,15) = 9.757, p=0.0070; *p<0.05, **p<0.01, p>0.05 (n.s.); two-way RM ANOVA, Sidak’s test. (o) WAT of mice under DIO (H&E staining) . Scale bar: 20 μm. (p) Adipocyte size. Group effect: GFP (n=9); TeLC (n=7); F(1,14)=19.8, p=0.0005; **p<0.01, ***p<0.001; two-way RM ANOVA followed by Sidak’s multiple comparisons test. (q) Expression of Ucp1 in iWAT of mice under DIO. GFP (n=8); TeLC (n=7); *p=0.0289, Mann Whitney U-test. Data are presented as mean ± s.e.m.
Figure 7.
Figure 7.. IPACNts neurons send output and receive input to and from brain regions involved in energy homeostasis
(a) Schematic of the strategy for monosynaptic retrograde rabies virus tracing. (b) Representative image of the injection site. STLV/P/D/J: ventral/posterior/dorsal/juxtacap lateral division of the BNST; STMA/V: anterior medial/ventral division; VP: ventral pallidum; CPu: caudate putamen; IPAC: interstitial nucleus of the posterior limb of the anterior commissure (aca); LHA: lateral hypothalamus; EP: endopeduncular nu. NAc: Nucleus accumbens; Hyp: hypothalmus, GP: globus pallidus EAC: sublent. Ext. amygdala cent., SNR: substantia nigra, reticular; SNC: substantia nigra, compact; VTA: ventral tegmental area RRF: retrorubral field; PVN: paraventricular nu.; Arc: arcuate hyp. nu; PVT: paraventricular thalamic nu.; PSTh: Prasubthalamic nu. Scale bar: 100 μm. (c) Representative images of the areas projecting to IPACNts neurons. Scale bar: 100 μm. (d) Brain regions projecting to IPACNts neurons (n=3). (e) Representative images of the injection sites from a NtsCre mouse injected with multi-color Cre-dependent AAVs (GFP in IPAC; mCherry in mBNST). Scale bar: 200 μm. (f) Representative images of brain areas innervated by IPACNts (green) and mBNSTNts (red) neurons. Scale bar: 100 μm. (g) Diagram illustrating brain region upstream and downstream of IPACNts neurons. (h) Schematic of the retrograde strategy to label IPACNts neurons projecting to the LHA (left, top panel), representative image of the injection site (left, bottom panel, scale bar: 200μm) and of FISH for Nts on retrograde labelled CT-B+ neurons in the IPAC (right, scale bar: 10μm). (i) Left: schematic of the strategy to activate the IPACNts → LHA pathway; Right: representative image showing ChR2 expression in IPACNts neurons and an optical-fiber tract on the LHA from a representative NtsCre;Ai14 mouse. Scale bar 100 μm. (j) Schematic of the paradigm for testing the effects of optogenetics on feeding behavior. (k) Effect of light delivery into the LHA of mice injected in the IPAC with ChR2 or GFP mice and fed HFD, WCh, DCh, chow. ChR2 mice (n=9), GFP mice (n=5). HFD, interaction effect: F(2,24)=3.834, p=0.0359; WCh, interaction: F(2,24)=13.19, p=0.0001; DCh, interaction effect: F(2,24)=1.807, p=0.1858; Chow, interaction effect: F(2,24)=1.756, p=0.1942. Two-way RM ANOVA, Sidak’s test. **p<0.01, ****p<0.0001, p>0.05 (n.s.).

References

    1. Bluher M Obesity: global epidemiology and pathogenesis. Nat Rev Endocrinol 15, 288–298 (2019). - PubMed
    1. Fenselau H, et al. A rapidly acting glutamatergic ARC-->PVH satiety circuit postsynaptically regulated by alpha-MSH. Nat Neurosci 20, 42–51 (2017). - PMC - PubMed
    1. Li MM, et al. The Paraventricular Hypothalamus Regulates Satiety and Prevents Obesity via Two Genetically Distinct Circuits. Neuron 102, 653–667 e656 (2019). - PMC - PubMed
    1. Zhang X & van den Pol AN Rapid binge-like eating and body weight gain driven by zona incerta GABA neuron activation. Science 356, 853–859 (2017). - PMC - PubMed
    1. Speakman JR, et al. Set points, settling points and some alternative models: theoretical options to understand how genes and environments combine to regulate body adiposity. Dis Model Mech 4, 733–745 (2011). - PMC - PubMed

Methods-only References

    1. Stephenson-Jones M, et al. A basal ganglia circuit for evaluating action outcomes. Nature 539, 289–293 (2016). - PMC - PubMed
    1. Zhang X & Li B Population coding of valence in the basolateral amygdala. Nat Commun 9, 5195 (2018). - PMC - PubMed
    1. Xiao X, et al. A Genetically Defined Compartmentalized Striatal Direct Pathway for Negative Reinforcement. Cell 183, 211–227 e220 (2020). - PMC - PubMed
    1. Gamba OFM BORIS: a free, versatile open-source event-logging software for video/audio coding and live observations. Methods in Ecology and Evolution 7, 1325–1330 (2016).
    1. Mehlem A, Hagberg CE, Muhl L, Eriksson U & Falkevall A Imaging of neutral lipids by oil red O for analyzing the metabolic status in health and disease. Nat Protoc 8, 1149–1154 (2013). - PubMed

Publication types