. 2022 Nov;25(11):1434-1445.
doi: 10.1038/s41593-022-01161-y. Epub 2022 Oct 20.

Modeling gene × environment interactions in PTSD using human neurons reveals diagnosis-specific glucocorticoid-induced gene expression

Collaborators, Affiliations

Modeling gene × environment interactions in PTSD using human neurons reveals diagnosis-specific glucocorticoid-induced gene expression

Carina Seah et al. Nat Neurosci. 2022 Nov.

Erratum in

Abstract

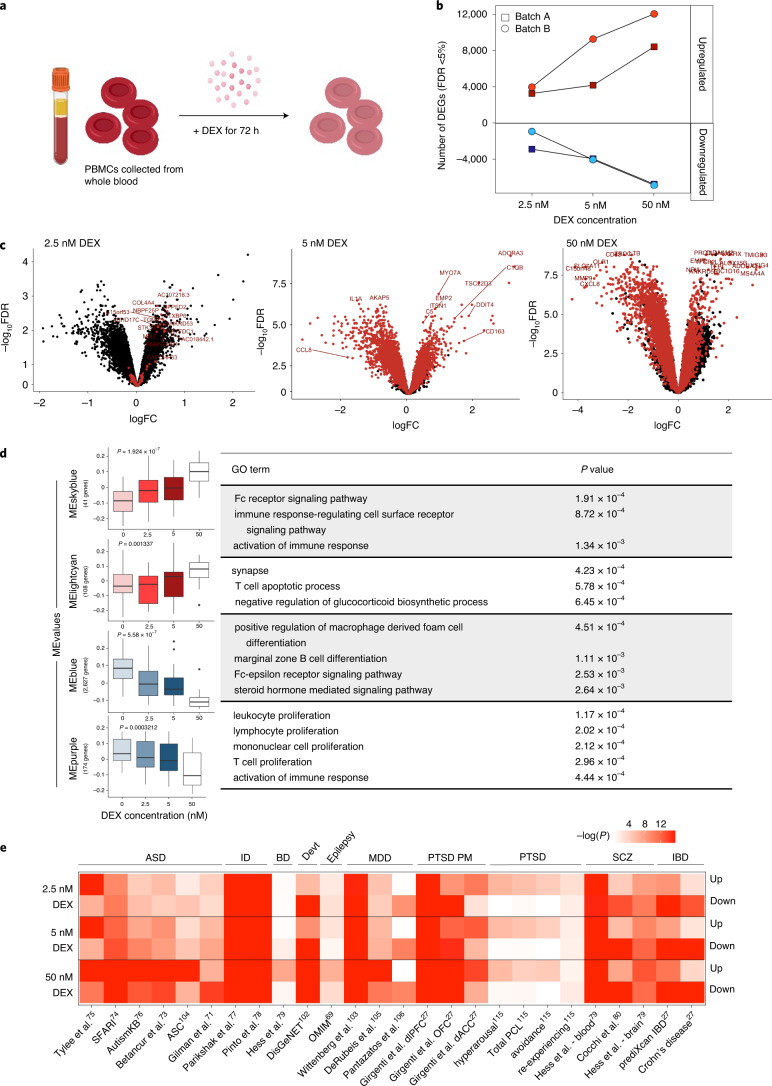
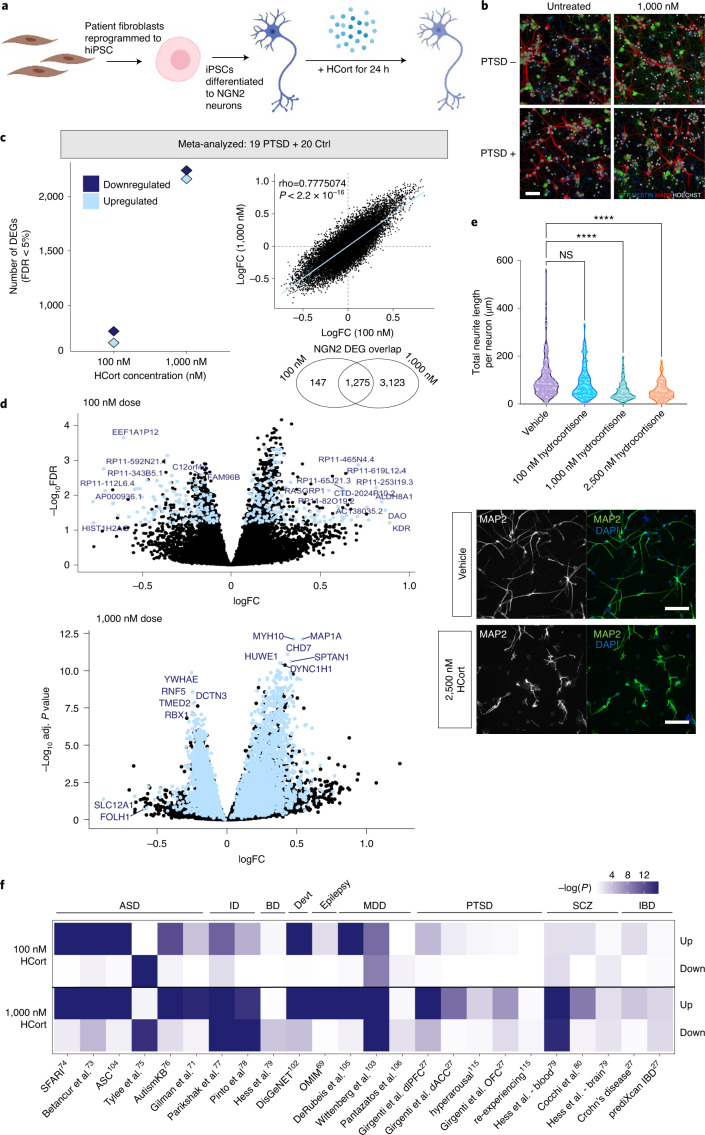
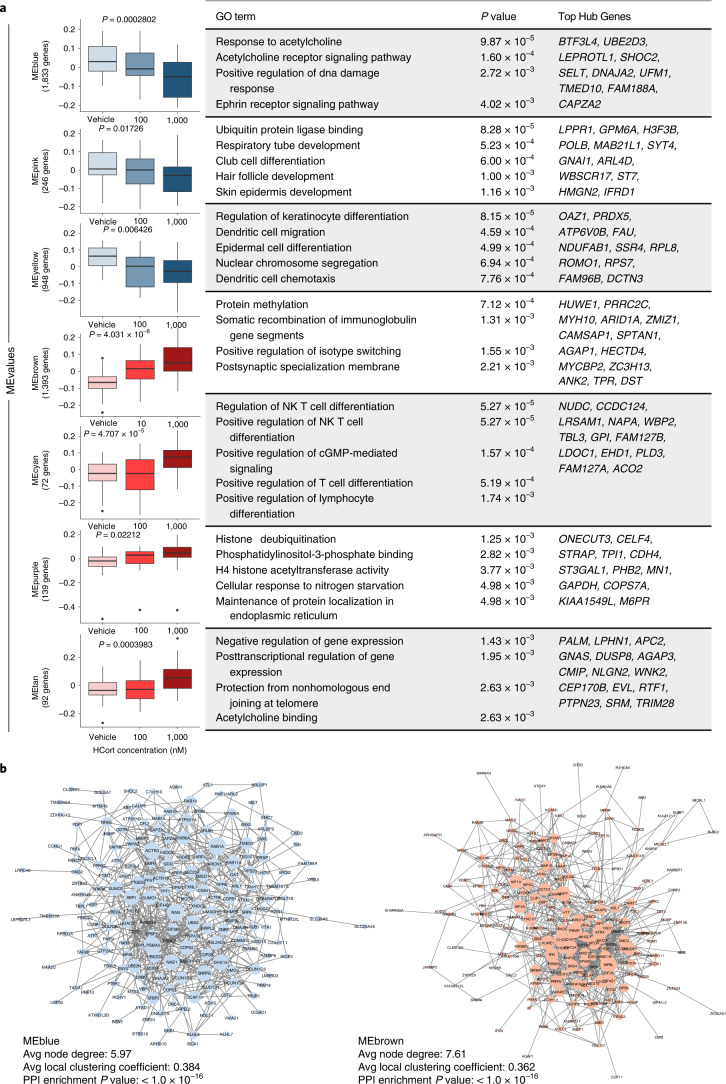
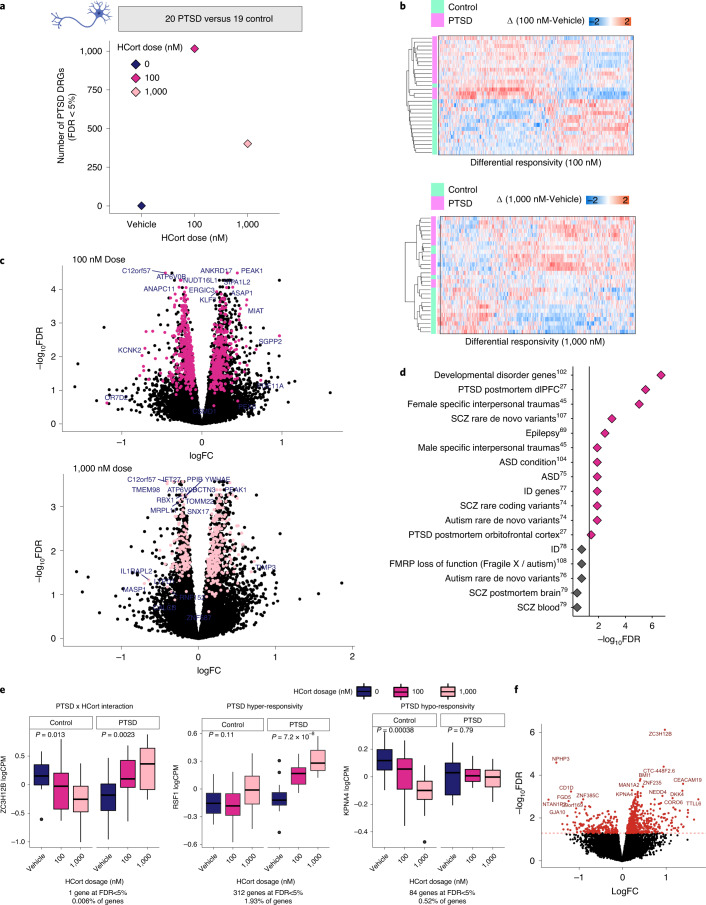
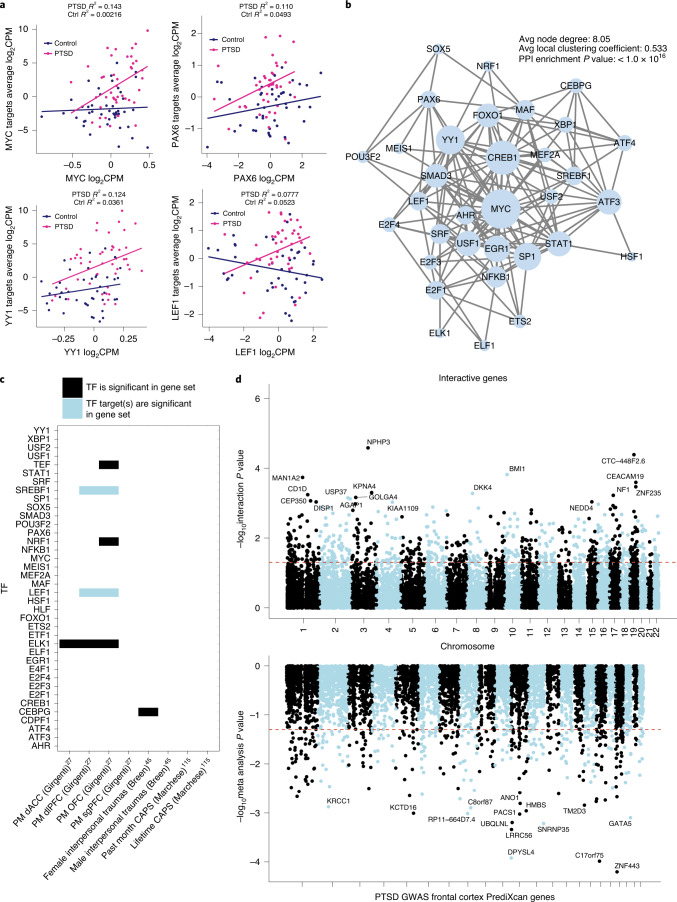
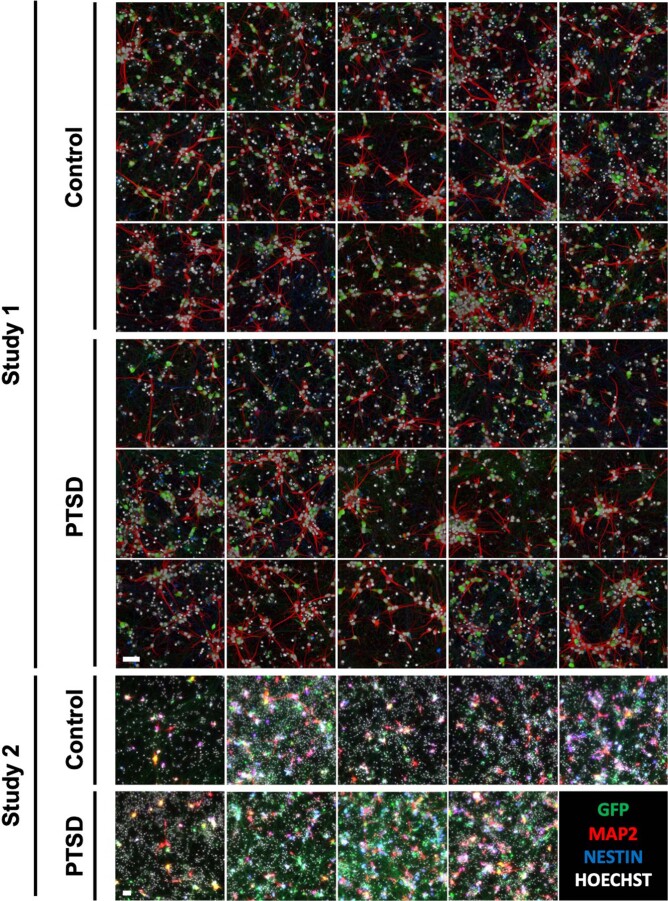
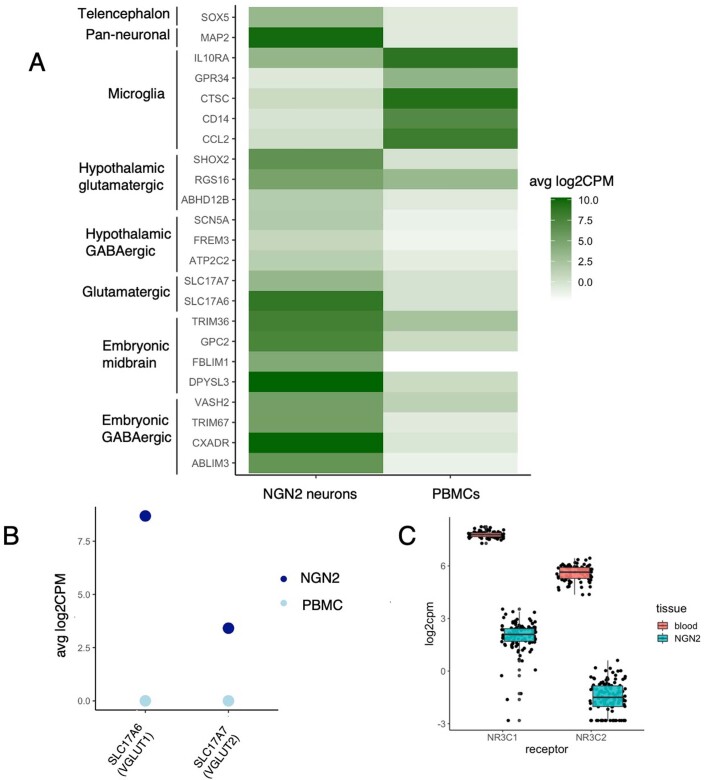
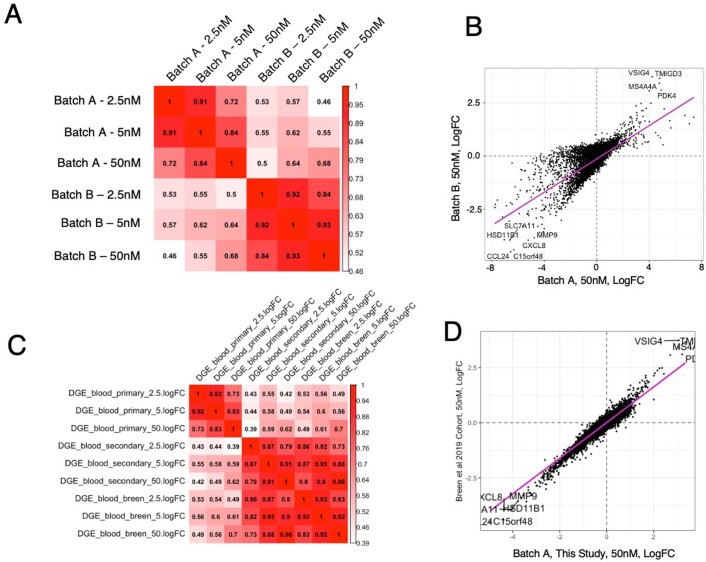
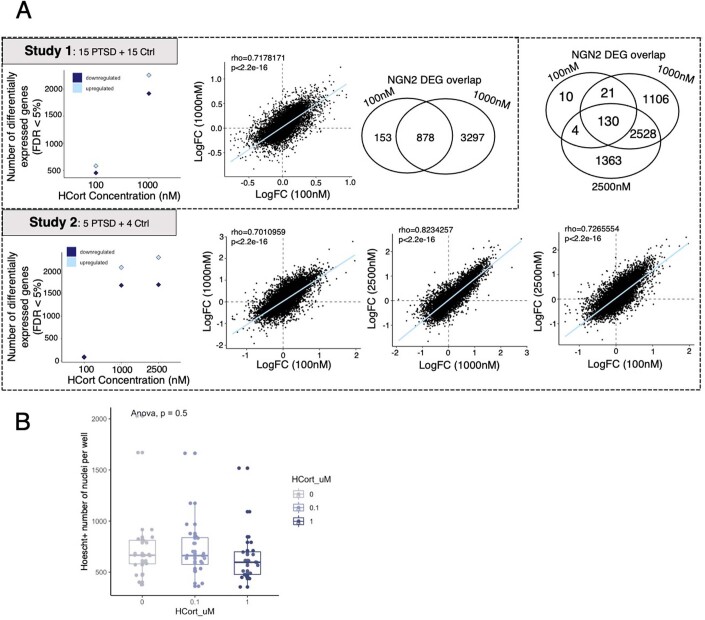
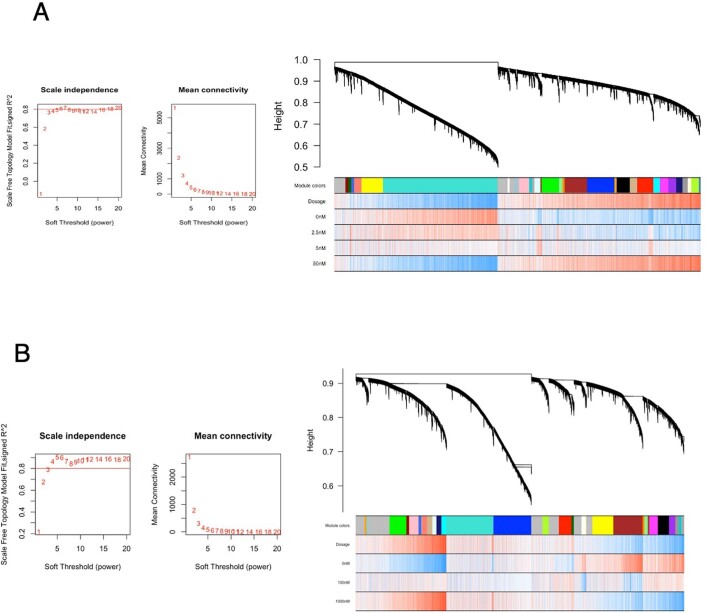
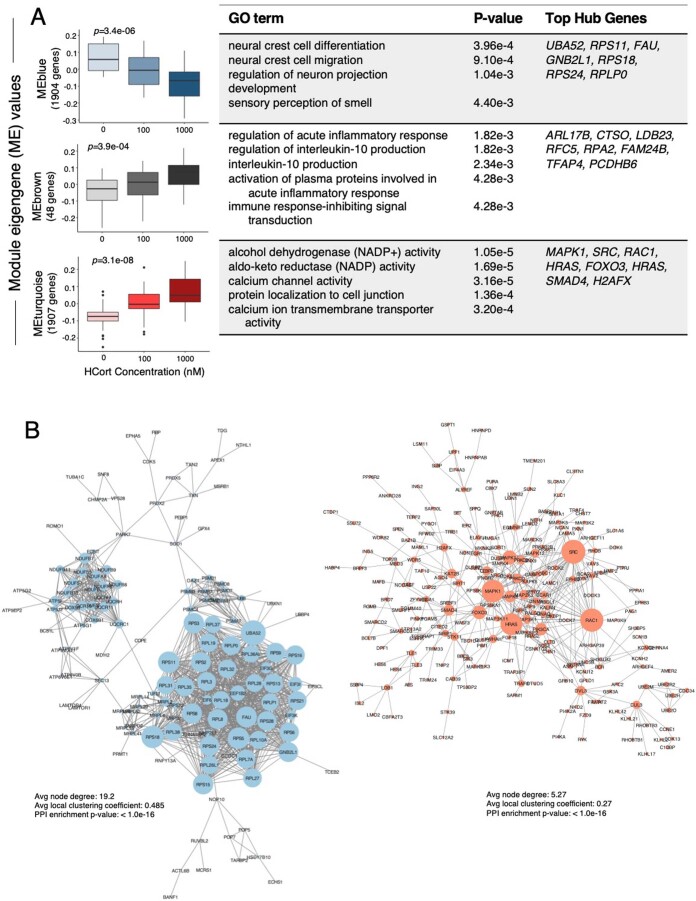
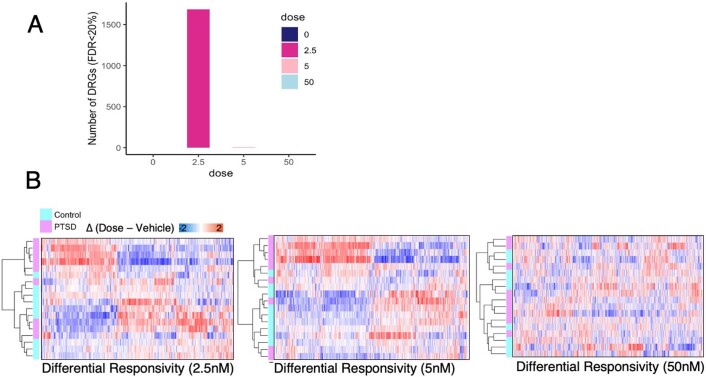
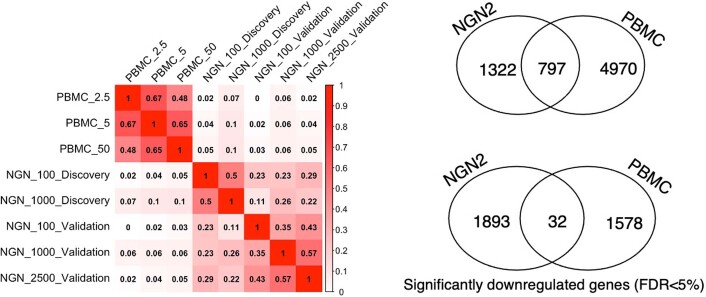
Post-traumatic stress disorder (PTSD) can develop following severe trauma, but the extent to which genetic and environmental risk factors contribute to individual clinical outcomes is unknown. Here, we compared transcriptional responses to hydrocortisone exposure in human induced pluripotent stem cell (hiPSC)-derived glutamatergic neurons and peripheral blood mononuclear cells (PBMCs) from combat veterans with PTSD (n = 19 hiPSC and n = 20 PBMC donors) and controls (n = 20 hiPSC and n = 20 PBMC donors). In neurons only, we observed diagnosis-specific glucocorticoid-induced changes in gene expression corresponding with PTSD-specific transcriptomic patterns found in human postmortem brains. We observed glucocorticoid hypersensitivity in PTSD neurons, and identified genes that contribute to this PTSD-dependent glucocorticoid response. We find evidence of a coregulated network of transcription factors that mediates glucocorticoid hyper-responsivity in PTSD. These findings suggest that induced neurons represent a platform for examining the molecular mechanisms underlying PTSD, identifying biomarkers of stress response, and conducting drug screening to identify new therapeutics.


Conflict of interest statement

The authors declare no competing interests.

Figures

Fig. 1
Fig. 1. Transcriptional response to DEX in PBMCs.
a, PBMCs from 20 PTSD cases and 20 combat-exposed controls were treated with DEX for 72 h and RNA-seq was performed. b, The number of DEGs observed in batch A (n = 10 versus 10) (squares) and batch B (n = 10 versus 10) (circles) are upregulated and downregulated (y axis) across three different concentrations of DEX conditioning (x axis) at a Bonferroni-corrected P value threshold. c, Meta-analysis of expression logFC (differences observed between vehicle and DEX exposure) was plotted against –log(FDR) for each gene. Red points indicate significantly DEGs in the meta-analysis. Sample-size-based meta-analysis was conducted using METAL with a Cochran’s Q test for heterogeneity. Benjamini–Hochberg adjusted P values are reported to correct for multiple testing. d, ME values from modules identified by WGCNA were correlated with increasing DEX concentrations for all DEX-treated samples (n = 40 individuals). Top correlated modules with DEX concentration are shown here (P values are labeled above each boxplot). Correlation P values were derived from a two-tailed t distribution. Data are presented as minimum, first quartile, median, third quartile and maximum. Each module was subjected to GO enrichment analysis and the topmost significant enrichment terms and their associated Benjamini–Hochberg adjusted P values are displayed. e, Gene set enrichment of DEX-dependent DEGs across psychiatric disorder and neurodevelopmental gene sets. Devt, genesets involved in neurodevelopmental disorders.
Fig. 2
Fig. 2. Gene expression changes to HCort in hiPSC-derived neurons.
a, hiPSC-derived NGN2-neurons were treated with HCort for 24 h and RNA-seq performed. b, NGN2-neurons stained for neuronal markers NESTIN and MAP2, nucleic marker HOECHST and green fluorescent protein to confirm neuronal identity and morphology across all conditions. c, Meta-analyzed DEGs in response to increasing concentrations of HCort shows robust changes in NGN2-neurons. A comparative analysis of transcriptome-wide log2FC in response to different concentrations of HCort in NGN2-neurons shows similar responses, indicating a conserved response across all donors to HCort in NGN2-neurons. Sample-size-based meta-analysis was conducted using METAL with a Cochran’s Q test for heterogeneity. Benjamini–Hochberg adjusted (adj.) P values are reported to correct for multiple testing. d, Meta-analysis of expression LogFC (differences observed between vehicle and HCort exposure) was plotted against –log(P value) for each gene. Blue points indicate significantly DEGs in the meta-analysis. e, Morphological analysis of neurite outgrowth in day 7 NGN2-neurons showing dose-dependent decrease in neurite outgrowth with HCort exposure. A Kruskal–Wallis test with a post hoc Dunn’s multiple comparisons test was performed on data for neurite length per neuron. **** P < <0.0001. NS, nonsignificant. P value for the NS comparison was 0.2121. Representative images of neurite morphology to HCort exposure shown below. f, Gene set enrichment of HCort-dependent DEGs across psychiatric disorder and neurodevelopmental gene sets.
Fig. 3
Fig. 3. HCort stimulated coexpression modules in NGN2-neurons.
a, WGCNA identified three groups of coregulated gene modules. Pearson correlation was used to assess changes in ME values with increasing concentration of HCort (P values are labeled above each boxplot). Correlation P values were derived from a two-tailed t distribution. Data are presented as minimum, first quartile, median, third quartile and maximum. Each module was subjected to GO enrichment analysis and the topmost significant enrichment terms and their associated Benjamini–Hochberg adjusted P values are displayed. Top hub genes (kME > 0.6) within each module are displayed for quick interpretation of GR-stimulated gene coexpression modules and candidate individual genes. b, Network visualization of PPIs within modules indicating clusters and network hubs. STRING analysis was used to identify the observed number of edges. Enrichment of observed edges was assessed against expected edges to determine a PPI P value of < 1.0 × 10–16 for each network. Avg, average.
Fig. 4
Fig. 4. PTSD(+) specific responses to HCort in NGN2-neurons.
a, Genes that differ in their response to HCort in PTSD(+) donors compared with PTSD(–) donors, here termed DRGs, were detected in both the 100 nM and 1,000 nM dose, indicating PTSD diagnosis-specific responses to HCort. b, Significant NGN2-DRGs correctly classify PTSD(+) from PTSD(–) participants using an unsupervised approach. c, Meta-analysis of expression LogFC DRGs (differences observed between PTSD(+) and PTSD(–)) were plotted against –log(P value). Pink points indicate significantly DEGs in the meta-analysis, representing PTSD case-specific response genes to HCort. Sample-size-based meta-analysis was conducted using METAL with a Cochran’s Q test for heterogeneity. Benjamini–Hochberg adjusted P values are reported to correct for multiple testing. d, Gene set enrichment of significant DRGs across psychiatric disorder gene sets (epilepsy, developmental delay, ASD, ID,, SCZ, and FMRP targets). e, The interactive effect of PTSD diagnosis and HCort exposure on gene expression are modeled, and three main observed patterns of direction of effect in significantly interactive genes are represented here. Interaction statistics were derived from the linear model with a diagnosis by HCort interaction coefficient. From among the 740 genes with significant Benjamini–Hochberg-adjusted P values <0.05, genes were identified that responded significantly to HCort in either cases or controls by performing one-way ANOVA on log2CPM normalized expression to increasing HCort exposure separately in PTSD cases and controls. We denote genes with a significant ANOVA P value in controls but not in PTSD cases as ‘PTSD hypo-responsive’, genes with a significant ANOVA P value in both PTSD cases and controls but with opposite directions of effect as ‘interactive’ and genes with a significant ANOVA P value to HCort in PTSD cases but not in controls as ‘PTSD hyper-responsive’. Data are presented as minimum, first quartile, median, third quartile and maximum. The patterns of three representative genes that indicate patterns of PTSD by HCort interaction, PTSD hyper-responsivity and PTSD hypo-responsivity are plotted, demonstrating examples of three biologically meaningful patterns of diagnosis by HCort interaction. f, logFC of all significantly interactive diagnosis by HCort genes are plotted against the P value of their interaction term, with most significant genes representing those with most significant interactive effects.
Fig. 5
Fig. 5. TFs driving PTSD hyper-responsivity.
a, PTSD hyper-responsive genes were shown to be enriched for several TF targets. Four of the enriched TFs driving hyper-responsivity in PTSD cases are shown here. Normalized expression of the TF is graphed on the x axis with average expression of the TF targets on the y axis in PTSD case and control NGN2-neurons stimulated with HCort, demonstrating differential regulation in stimulated cases versus controls. b, Network visualization of PPIs amongst identified TFs mediating PTSD hyper-responsivity. STRING analysis was used to identify the observed number of edges. Enrichment of observed edges was assessed against expected edges to determine a PPI P value < 1.0 × 10–16. c, Overlap of TFs (black) and their targets (blue) identified in our study with significantly DEGs in other PTSD studies. dACC, dorsal anterior cingulate cortex; sgPFC, subgenual prefrontal cortex. d, Manhattan plot of significantly interactive genes in our study compared with Manhattan plot of imputed expression from PTSD GWAS indicating spatial orientation of significantly interactive genes.
Extended Data Fig. 1
Extended Data Fig. 1. Immunostaining of hiPSC-derived NGN2-neurons.
Immunostaining of Hoechst (white), GFP (green), MAP2 (red) and NESTIN (blue) across all participants prior to HCort treatment. Imaging was repeated after treatment with the 100 and 1000 HCort dosages. Study 1 and 2: Scale bar = 50 µm.
Extended Data Fig. 2
Extended Data Fig. 2. Adjustment of Batch effects.
a, VariancePartition and PCA analysis on uncorrected data from two batches (batch 1, n = 30, batch 2, n = 9 biologically independent individuals) indicating large batch effect. Boxplot data presented are minimum, 1st quartile, median, 3rd quartile and maximum. Example of gene with large batch effect across batch 1 (n = 30) and batch 2 (n = 9). b, VariancePartition, PCA, and example gene after batch correction for same batches as above.
Extended Data Fig. 3
Extended Data Fig. 3. Developmental specificity analysis.
a, Pairwise correlation between NGN2s from our study with cell types across 16 independent studies. b, PCA analysis of cell types within all 16 studies with our NGN2-neurons.
Extended Data Fig. 4
Extended Data Fig. 4. Neuronal fate specificity analysis.
a, Expression of hallmark pan-neuronal and neuronal subtype specific genes in NGN2-neurons and PBMCs. b, Average log2CPM expression of VGLUT1 and VGLUT2 in NGN2-neurons and PBMCs. c, Expression of GR and MR in NGN2-neurons (from n = 39 individuals) and PBMCs (from n = 40 individuals). Boxplot data are presented as minimum, 1st quartile, median, 3rd quartile and maximum.
Extended Data Fig. 5
Extended Data Fig. 5. Comparison of PBMC batches.
a, Pairwise correlations between PBMC batches. b, Transcriptome-wide correlation between batches at 50 nM DEX dose. c, Pairwise correlations between PBMC batches and Breen et al. d, Transcriptome-wide correlation between our study and Breen et al. at the 50 nM DEX dose.
Extended Data Fig. 6
Extended Data Fig. 6. Comparison of NGN2 batches.
a, Hcort-responsive DEGs across independent batches. Transcriptome-wide concordance is plotted between dosages for each batch. b, Quantification of cell number with HCort treatment showing no significant cell density between doses. One-way ANOVA was performed in n = 39 biologically independent individuals treated with each dose. Data are presented as minimum, 1st quartile, median, 3rd quartile and maximum.
Extended Data Fig. 7
Extended Data Fig. 7. Weighted gene co-expression network analysis of (A) PBMCs and (B) NGN2-neurons.
The β-power required to satisfy scale-free topology (SFT) and corresponding mean connectivity for gene co-expression network construction. Hierarchical gene cluster tree and module structure and gene-treatment color bands. The first color band underneath the tree indicates the detected modules and subsequent bands indicate treatment correlation, when red indicates a strong relationship and blue indicates a strong negative relationship.
Extended Data Fig. 8
Extended Data Fig. 8. Unsigned WGCNA Network.
a, Unsigned Weighted gene co-expression network analysis (WGCNA) identified coregulated gene modules. Pearson correlation was used to assess changes in module eigengene (ME) values with increasing concentration of HCort (p-values are labeled above each boxplot). Correlation p-values were derived from a two-tailed t-distribution. Data are presented as minimum, 1st quartile, median, 3rd quartile and maximum. Each module was subjected to gene ontology enrichment analysis and the topmost significant enrichment terms and their associated Benjamini–Hochberg adjusted P-values are displayed. Top hub genes (kME > 0.6) within each module are displayed for quick interpretation of GR-stimulated gene co-expression modules and candidate individual genes. b, Network visualization of protein-protein interactions within modules indicating clusters and network hubs. STRING analysis was used to identify the observed number of edges. Enrichment of observed edges was assessed against expected edges to determine a Protein Protein Interaction (PPI) p-value of p < 1.0e-16 for each network.
Extended Data Fig. 9
Extended Data Fig. 9. PTSD(+) specific responses to DEX in PBMCs.
a, Genes that differ in their response to DEX in PTSD(+) donors compared to PTSD(-) donors, here termed differential response genes (DRGs), at an FDR threshold of 20% (nonsignificant) b, Unsupervised clustering of nominally significant PTSD DRGs.
Extended Data Fig. 10
Extended Data Fig. 10. Concordance of PBMC signature with NGN2 signature.
Pairwise Pearson-correlations between transcriptome-wide signatures of PBMC and NGN2 batches.

Comment in

References

    1. Yehuda, R. et al. Post-traumatic stress disorder. Nat. Rev. Dis. Primers1, 15057 (2015). - PubMed
    1. Kremen, W. S., Koenen, K. C., Afari, N. & Lyons, M. J. Twin studies of posttraumatic stress disorder: differentiating vulnerability factors from sequelae. Neuropharmacology62, 647–653 (2012). - PMC - PubMed
    1. Nievergelt, C. M. et al. International meta-analysis of PTSD genome-wide association studies identifies sex- and ancestry-specific genetic risk loci. Nat. Commun.10, 4558 (2019). - PMC - PubMed
    1. Duncan, L. E. et al. Largest GWAS of PTSD (N=20 070) yields genetic overlap with schizophrenia and sex differences in heritability. Mol. Psychiatry23, 666–673 (2018). - PMC - PubMed
    1. Gelernter, J. et al. Genome-wide association study of post-traumatic stress disorder reexperiencing symptoms in >165,000 US veterans. Nat. Neurosci.22, 1394–1401 (2019). - PMC - PubMed

Publication types

MeSH terms

Substances