. 2022 Nov;54(11):1621-1629.
doi: 10.1038/s41588-022-01192-y. Epub 2022 Oct 20.

Discovery of 42 genome-wide significant loci associated with dyslexia

Collaborators, Affiliations

Discovery of 42 genome-wide significant loci associated with dyslexia

Catherine Doust et al. Nat Genet. 2022 Nov.

Erratum in

  • Author Correction: Discovery of 42 genome-wide significant loci associated with dyslexia.
    Doust C, Fontanillas P, Eising E, Gordon SD, Wang Z, Alagöz G, Molz B; 23andMe Research Team; Quantitative Trait Working Group of the GenLang Consortium; Pourcain BS, Francks C, Marioni RE, Zhao J, Paracchini S, Talcott JB, Monaco AP, Stein JF, Gruen JR, Olson RK, Willcutt EG, DeFries JC, Pennington BF, Smith SD, Wright MJ, Martin NG, Auton A, Bates TC, Fisher SE, Luciano M. Doust C, et al. Nat Genet. 2023 Mar;55(3):520. doi: 10.1038/s41588-023-01336-8. Nat Genet. 2023. PMID: 36823321 Free PMC article. No abstract available.

Abstract

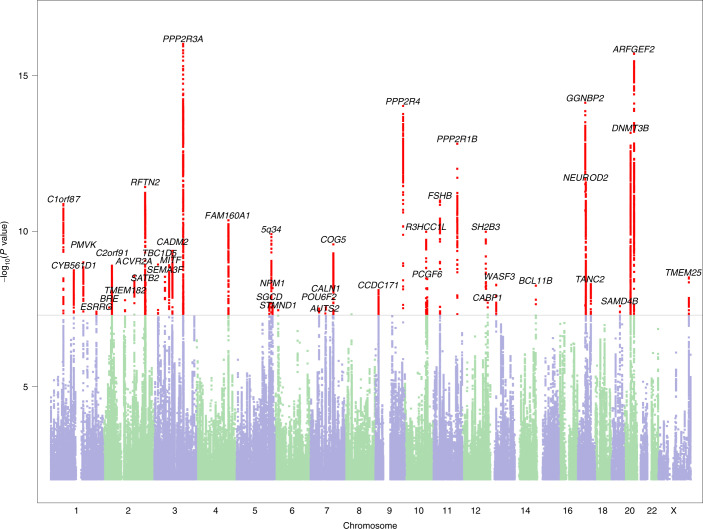
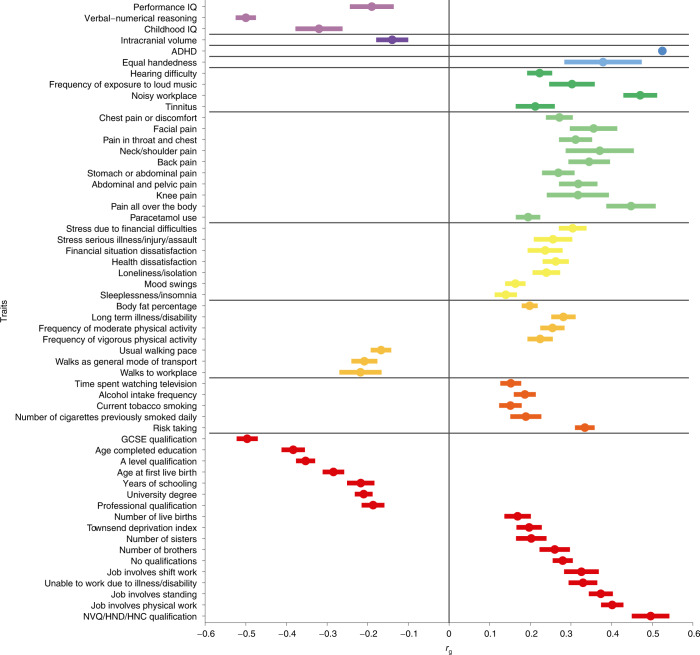
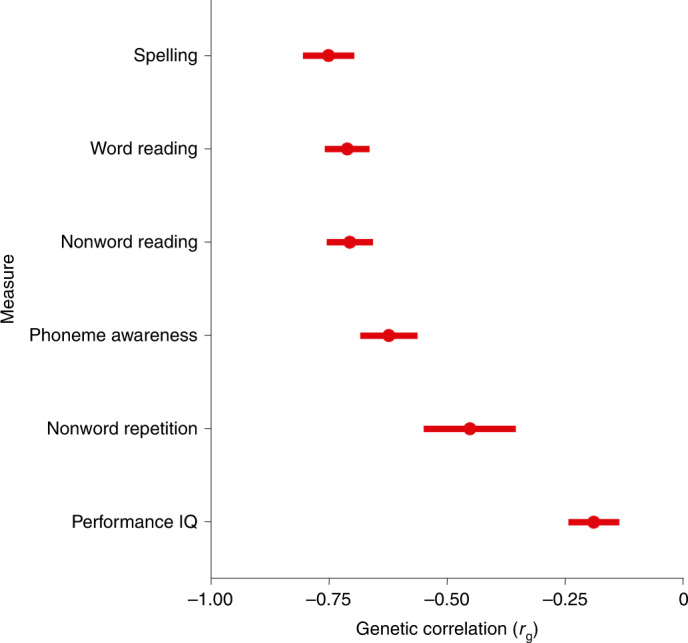
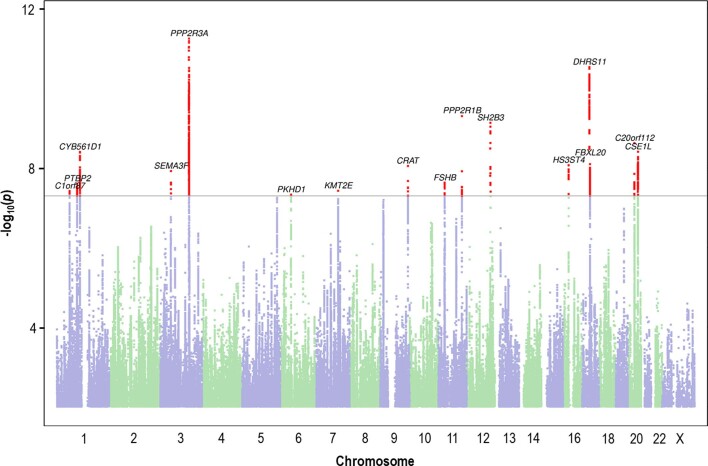
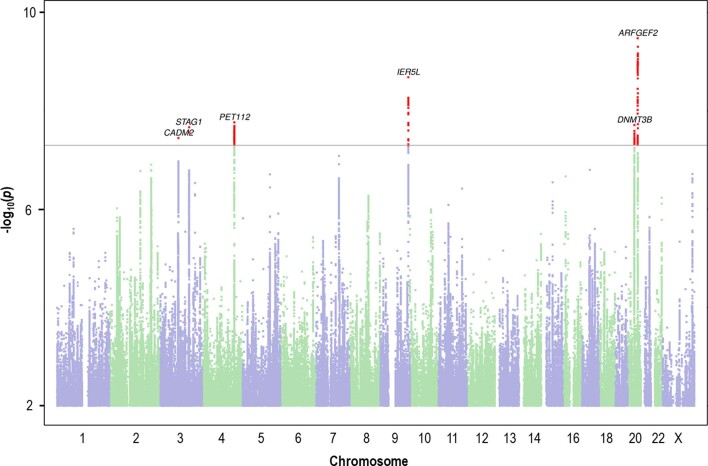
Reading and writing are crucial life skills but roughly one in ten children are affected by dyslexia, which can persist into adulthood. Family studies of dyslexia suggest heritability up to 70%, yet few convincing genetic markers have been found. Here we performed a genome-wide association study of 51,800 adults self-reporting a dyslexia diagnosis and 1,087,070 controls and identified 42 independent genome-wide significant loci: 15 in genes linked to cognitive ability/educational attainment, and 27 new and potentially more specific to dyslexia. We validated 23 loci (13 new) in independent cohorts of Chinese and European ancestry. Genetic etiology of dyslexia was similar between sexes, and genetic covariance with many traits was found, including ambidexterity, but not neuroanatomical measures of language-related circuitry. Dyslexia polygenic scores explained up to 6% of variance in reading traits, and might in future contribute to earlier identification and remediation of dyslexia.


Conflict of interest statement

P.F., A.A. and the 23andMe Research Team are employed by and hold stock or stock options in 23andMe, Inc. The remaining authors declare no competing interests.

Figures

Fig. 1
Fig. 1. Manhattan plot of the genome-wide association analysis of dyslexia.
The y axis represents the −log10 P value for association of SNPs with self-reported dyslexia diagnosis from 51,800 individuals and 1,087,070 controls. The threshold for genome-wide significance (P < 5 × 10−8) is represented by a horizontal grey line. Genome-wide significant variants in the 42 genome-wide significant loci are red. Variants located within a distance of <250 kb of each other are considered as one locus.
Fig. 2
Fig. 2. Genetic correlations of dyslexia with other phenotypes.
Significant (P < 5 × 10−4) genetic correlations (rg) between self-reported dyslexia diagnosis from 23andMe and other phenotypes from the LD Hub database and Enhancing Neuro Imaging Genetics Through Meta-Analysis (ENIGMA). We tested 98 traits but present only those that were significant after Bonferroni correction. Center points represent genetic correlations, and error bars represent standard errors around the estimate; exact values can be found in Supplementary Table 22. The vertical line indicates a genetic correlation of zero, and the horizontal lines divide groups of related traits. GCSE, General Certificate of Secondary Education; HNC, Higher National Certificate; HND, Higher National Diploma; NVQ, National Vocational Qualification.
Fig. 3
Fig. 3. Genetic correlations between dyslexia and measures of reading, language and nonverbal IQ.
Genetic correlations (rg) between self-reported dyslexia diagnosis from 23andMe and measures of reading, language and performance (nonverbal) IQ in the GenLang consortium. Center points represent genetic correlations estimated in LDSC, and error bars represent standard errors around the estimate; exact values can be found in Supplementary Table 22.
Extended Data Fig. 1
Extended Data Fig. 1. QQ plot of dyslexia GWAS results.
a-c, Quantile-quantile (Q-Q) plots of observed versus expected P values for associations of single nucleotide polymorphisms with self-reported dyslexia diagnosis in a genome-wide association analysis for all participants (n = 51,800 cases, 1,087,070 controls) (a), female participants (n = 30,287 cases, 641,016 controls) (b), and male participants (n = 21,513 cases, 446,054 controls) (c). The solid red line represents the distribution of P values under the null hypothesis, and the dashed red line represent 95% confidence intervals. The black circles represent the observed distribution of P values.
Extended Data Fig. 2
Extended Data Fig. 2. Manhattan plot of dyslexia GWAS results for females.
The y-axis represents the -log10 P value for association of single nucleotide polymorphisms with self-reported dyslexia diagnosis from 30,287 female individuals and 641,016 female controls. The threshold for genome-wide significance (P < 5 × 10⁻⁸) is represented by a horizontal grey line. Genome-wide significant variants in the 17 genome-wide significant loci are red. Variants located within a distance of 250 kb of each other are considered as one locus.
Extended Data Fig. 3
Extended Data Fig. 3. Manhattan plot of dyslexia GWAS results for males.
The y-axis represents the -log10 P value for association of single nucleotide polymorphisms with self-reported dyslexia diagnosis from 21,513 male individuals and 446,054 male controls. The threshold for genome-wide significance (P < 5 × 10⁻⁸) is represented by a horizontal grey line. Genome-wide significant variants in the 6 genome-wide significant loci are red. Variants located within a distance of 250 kb of each other are considered as one locus.
Extended Data Fig. 4
Extended Data Fig. 4. Variant effect predictor summary for the credible set of variants significantly associated with dyslexia.
Summary information is output from the online variant effect predictor in ENSEMBL (release 104). All our variants were present in the 1000 Genomes reference panel so are considered existing, and no pre-filtering (for example, on MAF; consequence type) was done.
Extended Data Fig. 5
Extended Data Fig. 5. Enrichment estimates for major functional annotations.
The 24 major functional annotations were defined by Finucane et al.. Enrichment is the proportion of h2/proportion of SNPs. The horizontal dotted line indicates no enrichment (where proportion of h2/proportion of SNPs = 1). Error bars represent standard errors of the enrichment estimates. Asterisks indicate enrichment estimates are significant based on a Bonferroni-derived P value of < 2.08 × 10⁻³ (for 24 tests). Exact values of enrichment statistic, standard error, and P value can be found in Supplementary Table 16.
Extended Data Fig. 6
Extended Data Fig. 6. Heritability of dyslexia partitioned by brain tissue gene expression.
The -log10 P value of the enrichment estimates for heritability of dyslexia for genes expressed in 12 brain regions. The horizontal dotted line indicates significance after Bonferroni correction for 12 tests (P < 4.17 × 10⁻³).
Extended Data Fig. 7
Extended Data Fig. 7. Heritability of dyslexia partitioned by brain cell type.
The -log10 P value of the enrichment estimates for heritability of dyslexia for brain cell types. The horizontal dotted line indicates significance after Bonferroni correction for three tests (P < 1.67 × 10⁻²).
Extended Data Fig. 8
Extended Data Fig. 8. Heritability of dyslexia partitioned by cell-type specific H3K4me1.
The -log10 P value of the enrichment estimates for heritability of dyslexia for variants located within H3K4me1 peaks of different tissues. Central nervous systems tissues are represented in dark green and other tissues are represented in light green. The vertical dotted line indicates significance after Bonferroni correction for 114 tests (P < 4.39 × 10⁻⁴).
Extended Data Fig. 9
Extended Data Fig. 9. Heritability of dyslexia partitioned by cell-type specific H3K4me3.
The -log10 P value of the enrichment estimates for heritability of dyslexia for variants located within H3K4me3 peaks of different tissues. Central nervous systems tissues are represented in dark blue and other tissues are represented in light blue. The vertical dotted line indicates significance after Bonferroni correction for 114 tests (P < 4.39 × 10⁻⁴).

References

    1. Ritchie SJ, Bates TC. Enduring links from childhood mathematics and reading achievement to adult socioeconomic status. Psychol. Sci. 2013;24:1301–1308. doi: 10.1177/0956797612466268. - DOI - PubMed
    1. Shaywitz SE, Shaywitz BA, Fletcher JM, Escobar MD. Prevalence of reading disability in boys and girls: results of the Connecticut Longitudinal Study. JAMA. 1990;264:998–1002. doi: 10.1001/jama.1990.03450080084036. - DOI - PubMed
    1. Katusic SK, Colligan RC, Barbaresi WJ, Schaid DJ, Jacobsen SJ. Incidence of reading disability in a population-based birth cohort, 1976–1982, Rochester, Minn. Mayo Clin. Proc. 2001;76:1081–1092. doi: 10.4065/76.11.1081. - DOI - PubMed
    1. Carroll JM, Maughan B, Goodman R, Meltzer H. Literacy difficulties and psychiatric disorders: evidence for comorbidity. J. Child Psychol. Psychiatry. 2005;46:524–532. doi: 10.1111/j.1469-7610.2004.00366.x. - DOI - PubMed
    1. Margari L, et al. Neuropsychopathological comorbidities in learning disorders. BMC Neurol. 2013;13:198. doi: 10.1186/1471-2377-13-198. - DOI - PMC - PubMed

Publication types