. 2022 Oct 20;5(1):1113.
doi: 10.1038/s42003-022-04057-6.

Expression of divergent methyl/alkyl coenzyme M reductases from uncultured archaea

Affiliations

Expression of divergent methyl/alkyl coenzyme M reductases from uncultured archaea

Nana Shao et al. Commun Biol. .

Abstract

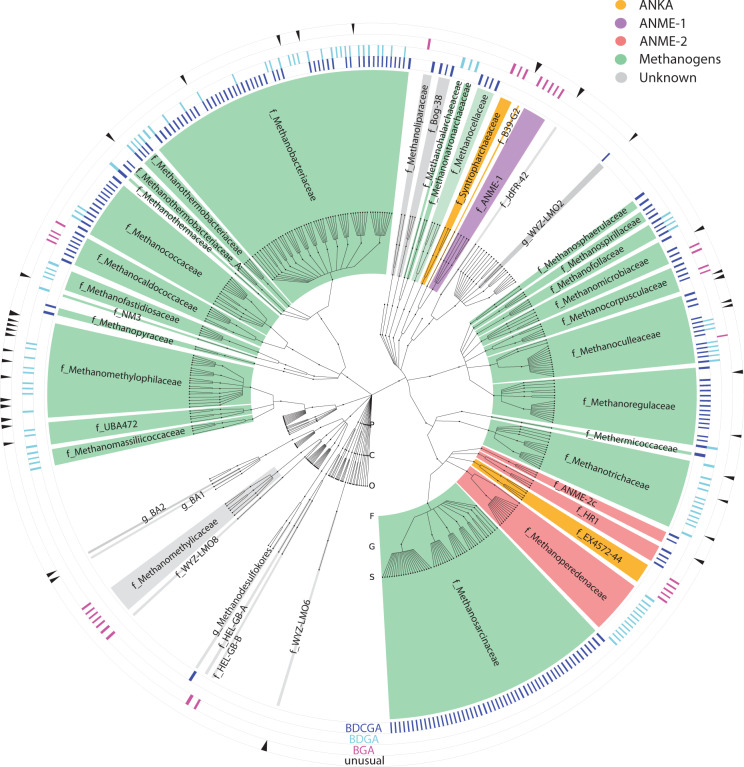
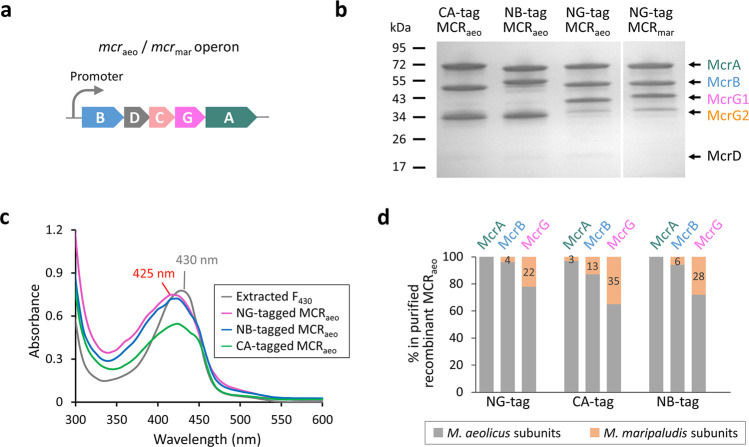
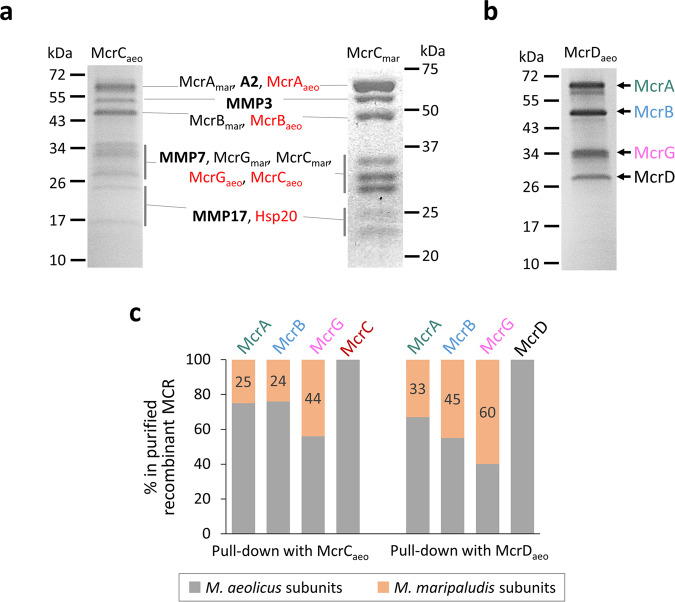
Methanogens and anaerobic methane-oxidizing archaea (ANME) are important players in the global carbon cycle. Methyl-coenzyme M reductase (MCR) is a key enzyme in methane metabolism, catalyzing the last step in methanogenesis and the first step in anaerobic methane oxidation. Divergent mcr and mcr-like genes have recently been identified in uncultured archaeal lineages. However, the assembly and biochemistry of MCRs from uncultured archaea remain largely unknown. Here we present an approach to study MCRs from uncultured archaea by heterologous expression in a methanogen, Methanococcus maripaludis. Promoter, operon structure, and temperature were important determinants for MCR production. Both recombinant methanococcal and ANME-2 MCR assembled with the host MCR forming hybrid complexes, whereas tested ANME-1 MCR and ethyl-coenzyme M reductase only formed homogenous complexes. Together with structural modeling, this suggests that ANME-2 and methanogen MCRs are structurally similar and their reaction directions are likely regulated by thermodynamics rather than intrinsic structural differences.


Conflict of interest statement

The authors declare no competing interests.

Figures

Fig. 1
Fig. 1. Distribution and gene clusters of mcr among archaea.
A total of 307 mcr genes were identified from 1070 archaeal genomes including methanogens (n = 252), ANME-1 clade (n = 5), ANME-2 (n = 20), ANKA (n = 9), and other archaea with unknown metabolism (n = 21). Accession numbers are given in Supplementary Data 1. Color shading: green, methanogens; purple, ANME-1 archaea; red, ANME-2 archaea; orange, proposed ANKAs; gray, archaea containing mcr with unknown functions. The operon structures (mcrBDCGA, mcrBDGA, or mcrBGA) are represented by multiple rings outside the rank-normalized phylogenetic tree. BDCGA (in blue), mcrBDCGA operon; BDGA (in cyan), mcrBDGA operon; BGA (in magenta), mcrBGA operon; unusual (in black), mcr genes lack the three recognized common operon structures. Multiple hits of a single genome indicate the presence of multiple copies of mcr. Taxonomic classification: P phylum, C class, O order, F family, G genus, S species. Lineages without mcr were truncated at the order level.
Fig. 2
Fig. 2. Heterologous expression of methanococcal MCRs.
a The mcr operon structure of M. aeolicus (mcraeo) and M. maripaludis (mcrmar). b SDS-PAGE analysis of the recombinant MCRaeo and MCRmar purified by Strep-tag affinity and ion-exchange chromatography from M. maripaludis. The molecular weights based on standards are labeled on the left. The Flag-Strep2 tag was added to the C-terminus of McrA (CA), the N-terminus of McrB (NB), or the N-terminus of McrG (NG) positions. All subunits were identified by MALDI-TOF MS and labeled on the right. McrG1 and McrG2 represents tagged and untagged McrG, respectively. c UV–visible spectra of purified recombinant MCRaeo and MCRmar (all at 7.5 mg mL−1 concentration) compared to coenzyme F430 extracted from the M. marburgensis MCR. d The relative abundance of M. aeolicus (in gray) vs. host M. maripaludis (in orange) MCR in each subunit of the purified recombinant MCRaeo complex determined by LC-MS/MS. The percentages of M. maripaludis protein in total protein of each subunit are labeled.
Fig. 3
Fig. 3. Characterization of recombinant complexes.
a Native-PAGE analysis of the purified recombinant MCRaeo and MCRmar. Both constructs had a Flag-Strep2 tag added to the N-terminus of McrG. b The two complexes of MCRaeo were eluted from native-PAGE gel slices, analyzed by SDS-PAGE, and silver stained. c The native molecular masses of the MCRaeo complexes I and II were determined as 288.4 and 283.8 kDa, respectively, by intact protein mass spectrometry. The charges of the peaks are labeled. d Models of complexes I and II. A, B, and Gaeo represent M. aeolicus McrA, McrB, and McrG subunits, respectively. Gmar denotes the untagged host M. maripaludis McrG. The black line symbolizes the tag. F stands for coenzyme F430.
Fig. 4
Fig. 4. Expression of recombinant MCRaeo with truncated operons.
a SDS-PAGE analysis of the recombinant MCRaeo purified by Strep-tag affinity and ion-exchange chromatography. All constructs had a Flag-Strep2 tag added to the N-terminus of McrG. The operon structures are labeled above each lane. The molecular weights based on standards are labeled on the left. All subunits were identified by MALDI-TOF MS and labeled on the right. b The relative abundance of M. aeolicus (in gray) vs. host M. maripaludis (in orange) MCR in each subunit of the co-purified complexes determined by LC-MS/MS. The percentages of M. maripaludis protein in total protein of each subunit are labeled. c UV–vis spectra of purified MCRaeo (all at 7.5 mg mL−1 concentration) compared to coenzyme F430 extracted from MCR. d Expression levels of recombinant MCRaeo determined by western blotting. Error bars represent the standard deviation of four independent cultures.
Fig. 5
Fig. 5. Pull-down analyses of accessory proteins McrC and McrD.
a The McrCaeo construct had the full M. aeolicus mcrBDCGA operon with the Flag-Strep2 tag added to the N-terminal of McrC. The McrCmar construct contained only the M. maripaludis mcrC with an N-terminal Flag-Strep2 tag. Proteins co-purified with McrCaeo and McrCmar were separated by SDS-PAGE and identified by MALDI-TOF MS. Proteins only purified with McrCaeo are labeled in red. Besides MCR subunits, the co-purified proteins (in bold) include M. maripaludis A2 protein (locus tag Mmp_0620), MMP3 (methanogenesis marker protein 3, locus tag Mmp_0154), MMP7 (methanogenesis marker protein 7, locus tag Mmp_0421), MMP17 (methanogenesis marker protein 17, locus tag Mmp_0656), and heat shock protein Hsp20 (locus tag Mmp_0684). b The McrDaeo construct had the full M. aeolicus mcrBDCGA operon with the Flag-Strep2 tag added to the N-terminal of McrD. Proteins co-purified with McrDaeo were separated by SDS-PAGE and identified by MALDI-TOF MS. c The relative abundance of M. aeolicus (in gray) vs. host M. maripaludis (in orange) MCR in each subunit of the purified complexes determined by LC-MS/MS. The percentages of M. maripaludis protein in total protein of each subunit are labeled.
Fig. 6
Fig. 6. ANME MCRs and an ECR expressed in M. maripaludis.
a General information and operon structures of MCRANME-1_BS, MCRANME-2b_HR1, and ECRE50. bd SDS-PAGE analysis of the purified MCRANME-1_BS, ECRE50, and MCRANME-2_HR1 produced from M. maripaludis grown at 25 oC. The molecular weights based on standards are labeled on the left. Protein identities (labeled on the right) were confirmed by MALDI-TOF MS. The tagged McrGANME-2_HR1 co-purified with the host MCRmar. e Total score (Rosetta energy unit; REU) vs. I_rmsd plot for local docking simulations of McrGANME-1_BS (blue) and McrGANME-2_HR1 (red) to the M. maripaludis McrA, B, G complex. The plot displays 60,000 scoring models. The best model obtained from the McrGANME-1_BS docking had a 5.869 Å I_rmsd and a -4965.008 total score. The best model obtained from the McrGANME-2_HR1 docking had a 1.848 Å I_rmsd and a -5133.935 total score. The ten lowest-energy scores with I_rmsd < 2.5 Å are labeled in the black box. f, g Structural models with the smallest I_rmsd in the simulation of the McrGANME-1_BS (magenta, f) and McrGANME-2_HR1 (magenta, g) docking to the M. maripaludis McrA (green), B (cyan), G (yellow) complex. The protein subunits are presented in cartoon, and F430 and CoB-SH are depicted in stick models. Only one active site composed of the M. maripaludis McrA (green), A’ (yellow), B (cyan), and the ANME McrG (magenta) subunits and one F430 are shown for clarity. The amino acids within 8 Å surrounding F430 are shown as surface representation. h The ten amino acids of McrGANME-2_HR1 within 8 Å surrounding F430 are labeled on the left and shown in stick models.

References

    1. Ueno Y, Yamada K, Yoshida N, Maruyama S, Isozaki Y. Evidence from fluid inclusions for microbial methanogenesis in the early Archaean era. Nature. 2006;440:516–519. doi: 10.1038/nature04584. - DOI - PubMed
    1. Wolfe JM, Fournier GP. Horizontal gene transfer constrains the timing of methanogen evolution. Nat. Ecol. Evol. 2018;2:897–903. doi: 10.1038/s41559-018-0513-7. - DOI - PubMed
    1. Thauer RK, Kaster A-K, Seedorf H, Buckel W, Hedderich R. Methanogenic archaea: ecologically relevant differences in energy conservation. Nat. Rev. Microbiol. 2008;6:579–591. doi: 10.1038/nrmicro1931. - DOI - PubMed
    1. Mayumi D, et al. Methane production from coal by a single methanogen. Science. 2016;354:222–225. doi: 10.1126/science.aaf8821. - DOI - PubMed
    1. McKay, L. J. et al. Activity-based, genome-resolved metagenomics uncovers key populations and pathways involved in subsurface conversions of coal to methane. ISME J. 10.1038/s41396-41021-01139-x (2021). - PMC - PubMed

Publication types