. 2022 Oct;4(10):1402-1419.
doi: 10.1038/s42255-022-00657-y. Epub 2022 Oct 20.

HypoMap-a unified single-cell gene expression atlas of the murine hypothalamus

Affiliations

HypoMap-a unified single-cell gene expression atlas of the murine hypothalamus

Lukas Steuernagel et al. Nat Metab. 2022 Oct.

Abstract

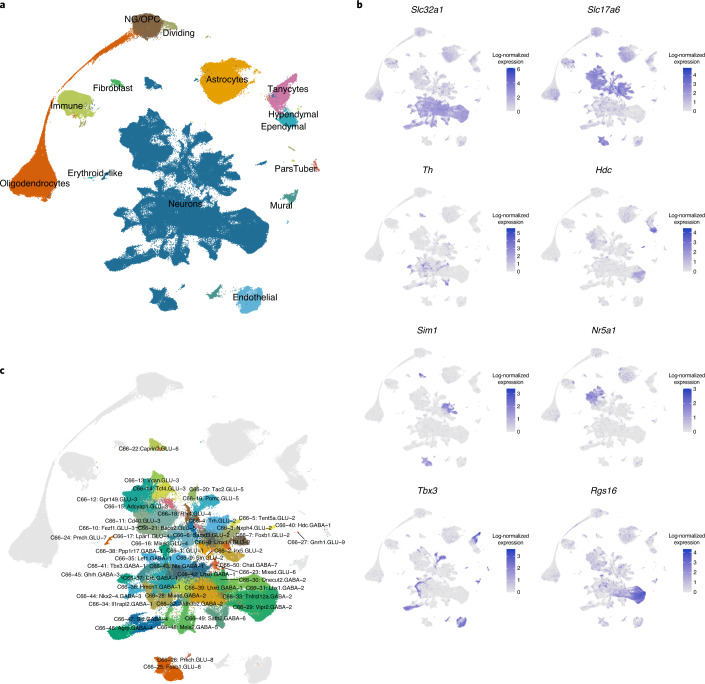
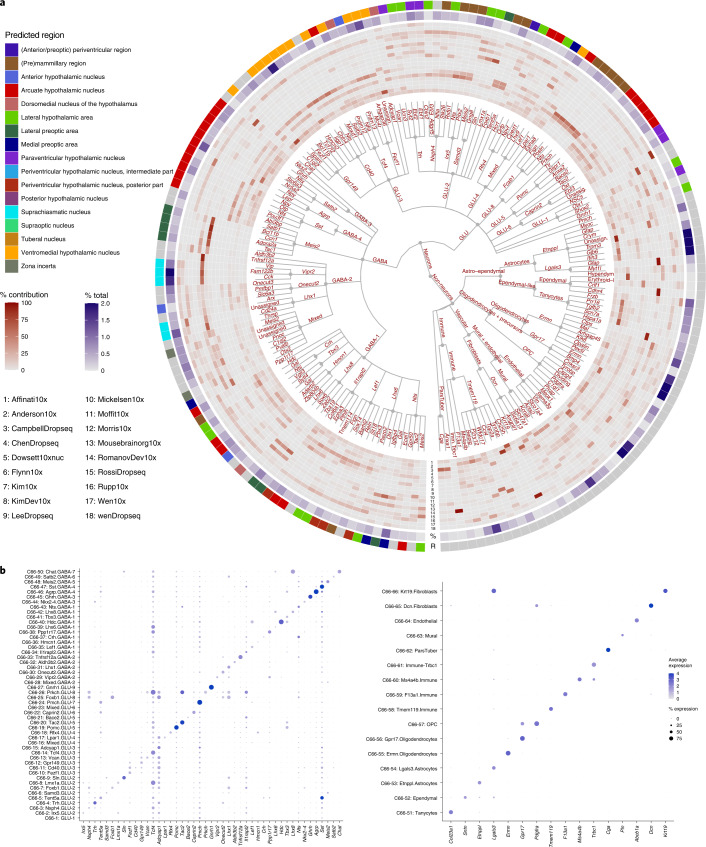
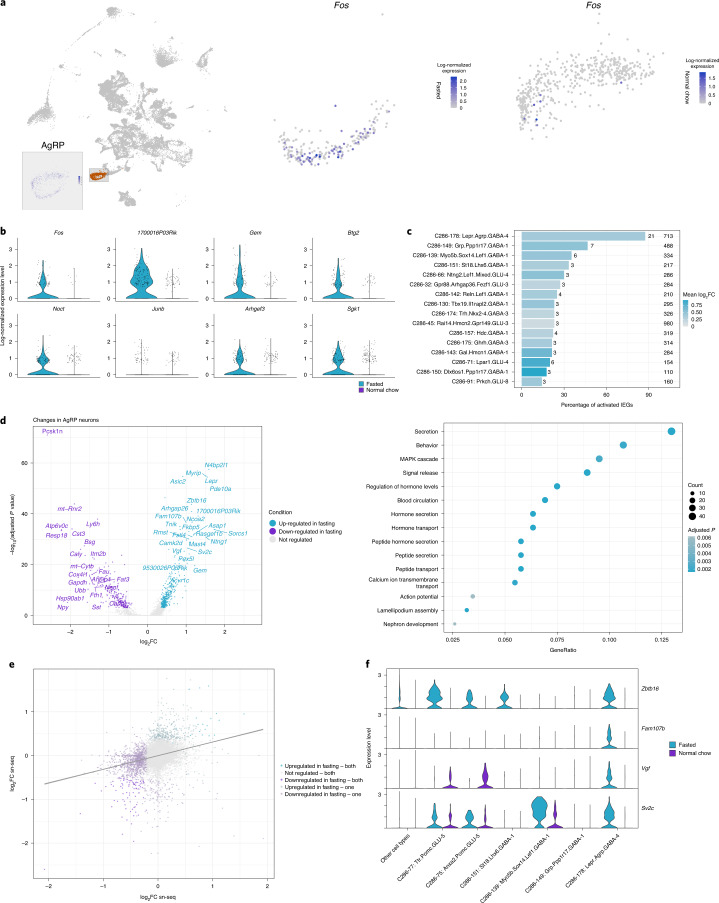
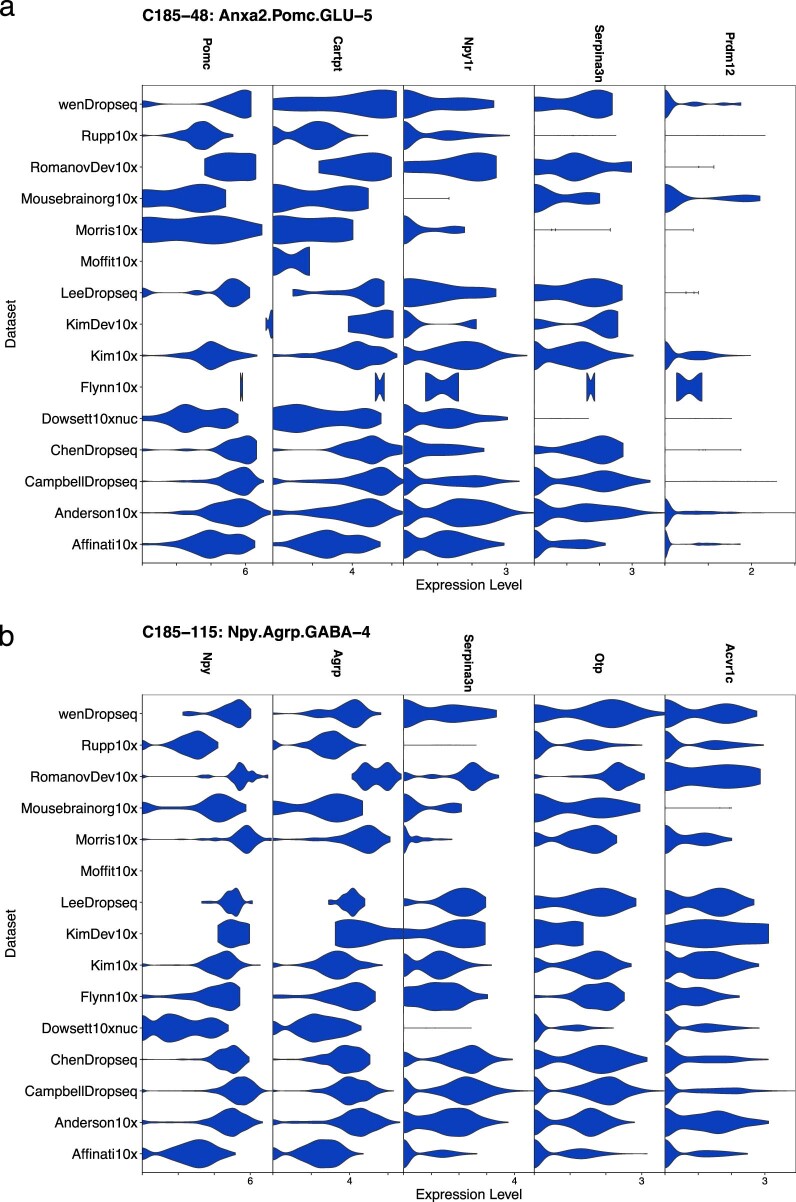
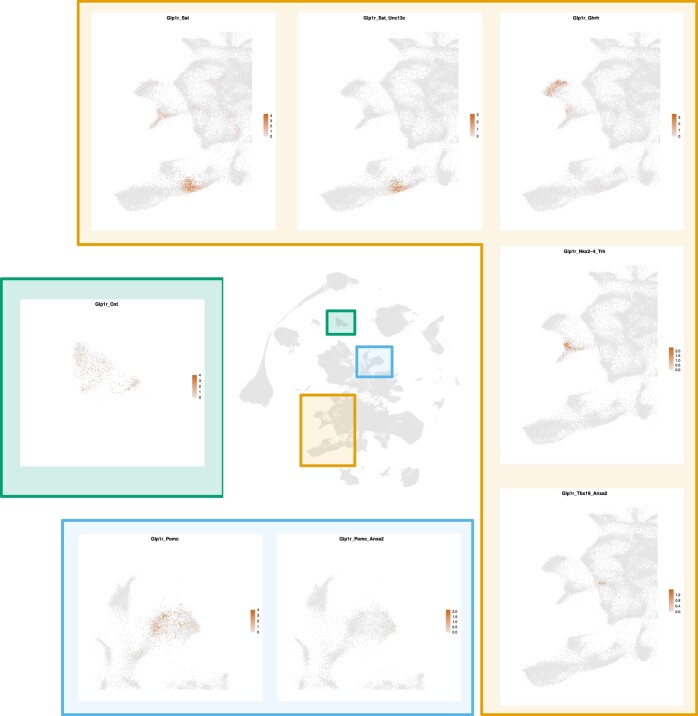
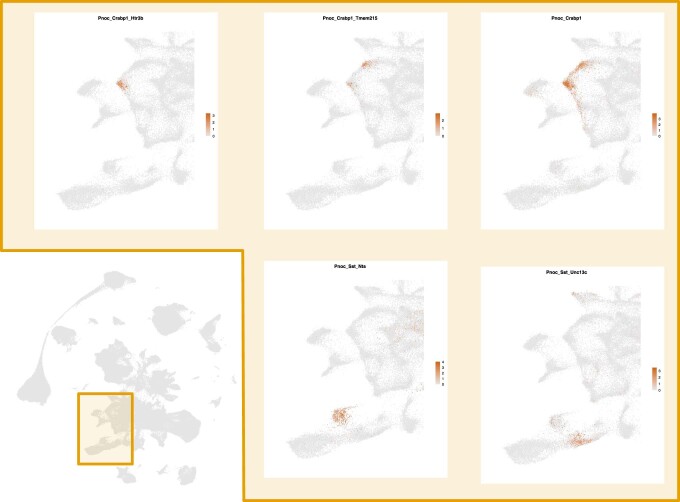
The hypothalamus plays a key role in coordinating fundamental body functions. Despite recent progress in single-cell technologies, a unified catalog and molecular characterization of the heterogeneous cell types and, specifically, neuronal subtypes in this brain region are still lacking. Here, we present an integrated reference atlas, 'HypoMap,' of the murine hypothalamus, consisting of 384,925 cells, with the ability to incorporate new additional experiments. We validate HypoMap by comparing data collected from Smart-Seq+Fluidigm C1 and bulk RNA sequencing of selected neuronal cell types with different degrees of cellular heterogeneity. Finally, via HypoMap, we identify classes of neurons expressing glucagon-like peptide-1 receptor (Glp1r) and prepronociceptin (Pnoc), and validate them using single-molecule in situ hybridization. Collectively, HypoMap provides a unified framework for the systematic functional annotation of murine hypothalamic cell types, and it can serve as an important platform to unravel the functional organization of hypothalamic neurocircuits and to identify druggable targets for treating metabolic disorders.


Conflict of interest statement

P. D. worked for Novo Nordisk A/S. G. S. H. Y. receives grant funding from Novo Nordisk A/S, and consults for them on their obesity ‘break-out’ campaign. J. C. B., L. S., C. A. B. and H. F. received project funding from Novo Nordisk A/S. The other authors declare no competing interests.

Figures

Fig. 1
Fig. 1. Unified hypothalamus reference map.
Integration of 17 single-cell sequencing datasets into one harmonized reference. a, UMAP visualization of HypoMap, colored by major cell types. b, UMAP of neuronal clusters in HypoMap (other cell types in gray) c, UMAP expression of key neuronal type markers and regional markers in each cell. Color corresponds to log-normalized expression values scaled to the maximum of each gene. Source data
Fig. 2
Fig. 2. Harmonized annotation of hypothalamus cell types.
a, A circular hierarchical tree of clusters of HypoMap. The first 5 levels with up to 185 clusters are shown, highlighting the diversity of hypothalamic cells when combining data across regions. Individual clusters at levels 4 and 5 are named with the most informative marker gene, given as edge labels. The inner (red) circular heatmap depicts the percentage contribution of each dataset to the clusters at the lowest tree level. The middle heatmap (blue) depicts the relative percentage contribution of each cluster at the lowest tree level to the total cell number. The scale is limited to 2%. The outer ring depicts the most likely region of origin (R) for each neuron cluster on the lowest level of the displayed tree. If support was insufficient for a cluster, no region was assigned, and the cluster was colored gray (see Methods). b,c, Dot plots displaying marker genes used for annotating the clusters at level 4 (C66) of the tree in a. For clusters with a proper name (for example, ‘Astrocytes’), the most specific gene that would have been used for annotation is included. Dot color corresponds to average log-normalized expression levels of each gene in a cluster and dot size to the percentage of cells expressing a marker in the cluster. b, Neuronal cell types. c, Non-neuronal cell types. See also Supplementary Tables 5 and 6. Source data
Fig. 3
Fig. 3. Comparison of HypoMap and original clusters.
a, HypoMap UMAP highlighting the cluster C25-3: GLU-3, which contains Nr5a1- and Fezf1-expressing neuronal populations from the VMH that are compared in be. b,c, UMAP plot of cells from the C25-3: GLU-3 cluster from Chen et al. (b) and Kim et al. (c) overlayed on all cells of the cluster (gray) and colored by the original author annotations. d,e, Sankey diagrams showing the original author annotations of Chen et al. (d) and Kim et al. (e), compared with the HypoMap subclusters (C286) of C25-3: GLU-3. Chen et al. (d) covered VMH neurons only sparsely, and the combination with other datasets greatly improves cell classification. The VMH-specific dataset from Kim et al. (e) covered most subclusters identified in HypoMap, although in some cases clusters were further partitioned. (See Supplementary Table 20 for a full overview of all original and HypoMap cell labels). Source data
Fig. 4
Fig. 4. Comparison of nucSeq and single-cell data.
a, UMAP visualization of the nucSeq data colored and annotated by cluster level 3 (C25) on all HypoMap cells (gray), demonstrating that the nucSeq data are evenly integrated in HypoMap. b, Heatmap of per-gene correlation (Pearson’s r) between sc-seq and nucSeq. Each row shows the density (color) of all genes in a specific gene class (number of genes shown on the right). Also see Supplementary Table 9. c, Heatmap of cluster-level correlation shown on the hierarchical tree of neuron clusters. For each cluster, the marker genes (M, number depicted in inner heatmap in red) were used to calculate Pearson’s r between all sc-seq and nucSeq data (middle heatmap in blue–green) or between individual HypoMap datasets and nucSeq (outer heatmap in blue–red). If there were fewer than ten cells per cluster and dataset, the comparison was omitted (white). Source data
Fig. 5
Fig. 5. Transcriptional changes induced by fasting.
a, Fos is increased in nucSeq AgRP neurons after fasting. Left, UMAP plot depicting C66-46: Agrp.GABA-4 in HypoMap. The inset shows Agrp expression in nucSeq cells from C66-46: Agrp.GABA-4. Right, UMAP plots of the same cells showing Fos expression in fasted and ad-libitum-fed conditions. The changes in nucSeq AgRP neurons after fasting were strong enough to cause a shift in the cluster. b, IEGs with high log2(fold change) (log2FC) in AgRP neurons. The violin plots show the per-cell expression between conditions. c, Neuron clusters activated by fasting. The bar plot depicts the percentage of significantly up-regulated IEGs in the fasted state over the total number of expressed IEGs (left number, based on presence in at least 10% cells of clusters in either condition). AgRP neurons are strongly activated, as indicated by the high number of changing IEGs. The bars are colored by mean log2FC, and the number of cells in each cluster is shown on the right. d, Transcriptional changes in AgRP neurons induced by fasting. In the volcano plot (log2FC versus adjusted P values from a (two-sided) Wald test), differentially expressed genes (DEGs) are highlighted. The dot plot shows Gene Ontology (GO) terms enriched in up-regulated genes. The P values are based on a hypergeometric test from an over-representation analysis and were corrected using false discovery rate (FDR). e, Comparison of transcriptional changes in AgRP neurons between nucSeq and Campbell et al. data. The scatter plot of log2FCs is colored by DEGs in either dataset. f, Per-cell expression levels of selected DEGs between conditions. For each gene, the expression is shown across multiple activated cell types as well as POMC neurons and a reference containing all remaining cells. P values of DEGs were obtained by Wilcoxon rank-sum tests and were adjusted for multiple comparisons using Bonferroni correction. See also Supplementary Tables 10 and 11. Source data
Fig. 6
Fig. 6. Projection of new data.
a, HypoMap UMAP colored by cluster level 3 (C25) and overlaid with the projected ‘locations’ of cells from Romanov et al.. Even clusters represented by only few cells in the query dataset can be accurately embedded into the reference. b, Probability scores (see Methods) of projection accuracy of Romanov et al. cells from a. High scores indicate high confidence in the projection, which is the case for most cells. cf, Enrichment of bacTRAP signatures of specific neuronal population on HypoMap clusters using rank-biased overlap (RBO). RBO scores per cluster (C286) are shown as small bars relative to the highest score of each signature enrichment. The UMAP shows the expression level of the marker gene used in the bacTRAP experiment in HypoMap. In e and f, it shows the cells that express the combination of marker genes in orange (square root of product of expression levels). The corresponding cluster names for each unique ID in the figure can be found in Supplementary Table 3. c, AgRPCre neurons are enriched in C66-46: Agrp.GABA-4 subclusters. d, PomcCre neurons are highly enriched in the C66-19: Pomc.GLU-5 subclusters, with medium scores in C66-46: Agrp.GABA-4. e, PomcDreLeprCre neurons are most enriched in C286-75: Anxa2.Pomc.GLU-5, which expresses Lepr. f, PomcDreGlp1rCre neurons are most enriched in C286-77: Ttr.Pomc.GLU-5, which expresses Glp1r. Also see Supplementary Table 19. Source data
Fig. 7
Fig. 7. Validation of heterogeneous neuronal populations.
ac, Glp1r-expressing cell types identified the hypothalamus. a, The Glp1rCre bacTRAP signature is enriched in multiple hypothalamic cell types, mostly corresponding to the Glp1r expression in HypoMap. b,c, RNAscope of Glp1r together with specific markers of neuron clusters identified using Glp1r-bacTRAP in (a). Representative images (b) and quantification shown as the percentage Glp1r-positive cells identified by marker gene expression (c). Points refer to individual sections, in total 4 rostral and 4 caudal ARC sections from 4 mice were included for each experiment (0 rostral and 8 caudal for Tbx19- plus Anxa2 and 16 PVH sections for Oxt). Mean ± s.e.m,: Pomc: 49.03 ± 4.77; Pomc/Anxa2: 14.56 ± 3.89; Sst: 31.39 ± 3.06; Sst/Unc13c: 64.46 ± 3.88; Ghrh: 47.93 ± 5.19; Tbx19/Anxa2: 38.13 ± 8.3; Trh/Nkx2-4: 90.89 ± 8.26; Oxt: 47.94 ± 6.73. df, Pnoc-expressing cell types identified in the hypothalamus. d, The PnocCre bacTRAP signature is enriched in multiple hypothalamic cell types, and covers only a subset of Pnoc-expressing cell types in HypoMap. e,f, RNAscope of Pnoc and marker genes of selected ARC neuronal cell types based on Pnoc-bacTRAP and gene expression in (d). e,f, Representative images (e) and quantification (f) of Pnoc and Sst or Crabp1 co-expressing subclusters. Points refer to individual sections, in total 14 ARC sections along the rostral-caudal axis from 4 mice were included for each experiment. Mean ± s.e.m: Sst/Pnoc: 59.9 ± 3.24; Sst/Pnoc/Nts: 6.78 ± 3.56; Sst/Pnoc/Unc13c: 52.28 ± 7.17; Sst/Pnoc/Nts/Unc13: 2.29 ± 1.1; Crabp1/Pnoc: 76.35 ± 2.2; Crabp1/Pnoc/Tmem215: 41.02 ± 4.81; Crabp1/Pnoc/Htr3b: 32.18 ± 3.04; Crabp1/Pnoc/Tmem215/Htr3b: 10.02 ± 1.17. In all dot plots, the red point depicts the mean and red error bars the s.e.m. of all sections. We used a two-sided Wilcoxon rank-sum test (multiple testing correction with Benjamini–Hochberg) to test for differences between the means of relevant groups and added the resulting P values to the quantification in (c) and (f). Source data
Extended Data Fig. 1
Extended Data Fig. 1. Selection of single-cell integration method.
a, Overview of the pipeline used to determine an optimal integration of data including normalization and feature selection. b, Evaluation metrics calculated on integration results of preliminary dataset (85,000 cells). Purity refers to a combined score of cell type purity and cluster separation. Mixing refers to a combined score of dataset mixing. An optimal integration achieves high mixing scores while retaining high purity scores. c, UMAPs of each integration method’s best result colored by dataset of origin to show dataset mixing and cluster separation. As indicated by the metrics, most methods are able to mix the data and retain most of the original cell types. The Raw PCA is not mixing the data fully, while the low-dimensional Harmony result is not able to represent the full complexity of the data. Source data
Extended Data Fig. 2
Extended Data Fig. 2. Optimization of scVI parameters.
a, Evaluation metrics calculated on scVI integration results of full HypoMap (384,925 cells). Purity refers to cell type purity only. Cell type separation (asw_norm = average silhouette width) is shown by the point size (see methods for details on metrics). PCA (orange) clearly mixes that data less well than scVI (pink). b, Evaluation metrics similar to (a), calculated on scVI integration results with comparable hyperparameters using either all cells (light blue) or only neurons (grey) as input. Using all cells as input did not affect the integration performance in mixing and purity, but the the cluster separation (asw_norm) was lower. c, Example box plots for detailed evaluation of scVI hyperparameters, visualizing the influence of the number of training rounds (epochs) and hidden layers on the three different metrics. Each point corresponds to a scVI training run on the full HypoMap data. The center of the boxplot is the median of all runs, the lower and upper hinges correspond to the first and third quartiles and the whiskers extend from each hinge to the largest value smaller than 1.5 times the distance between the first and third quartiles. Overall n = 224 scVI runs that were compared, the number differs between boxplots depending on the parameters. d, UMAP visualization of HypoMap colored by datasets to visualize mixing. e, UMAP visualization of HypoMap colored by mapped cell types for the evaluation of purity (see Methods and Supplementary Table 2 for details). Source data
Extended Data Fig. 3
Extended Data Fig. 3. UMAP visualization of cells and original annotations from Campbell et al.
UMAP visualization of cells and original annotations from Campbell et al., highlighting which parts of HypoMap are covered by this dataset. Inset shows the enlarged view of cell clusters from the SCN colored by HypoMap clusters. Source data
Extended Data Fig. 4
Extended Data Fig. 4. Full hierarchical cluster tree.
Full hierarchical cluster tree of HypoMap showing all 7 cluster levels. This includes level 6 (C286) and 7 (C465). Individual clusters at levels 4 – 7 are named with the most informative marker gene, given as edge labels. Full cluster names were constructed by concatenating the given gene names with those of all ancestors. Source data
Extended Data Fig. 5
Extended Data Fig. 5. Hierarchical cluster trees of HypoMap split into neuronal (A) and non-neuronal (B) populations.
Similar to Fig. 2A, but split into neuronal (a) and non-neuronal (b) populations. The first 5 levels with up to 185 clusters are shown. Individual clusters at levels 4 and 5 are named with the most informative marker gene, given as edge labels. The inner (red) circular heatmap depicts the contribution of each dataset to the clusters at the lowest tree level in percent. The middle heatmap (blue) depicts the relative contribution of each cluster at the lowest tree level to the total cell number in percent. The scale is limited to 2%. The outer ring depicts the most likely region of origin (R) for each neuron cluster on the lowest level of the displayed tree. If support was insufficient for a cluster, no region was assigned and the cluster was colored in grey (see methods). For the non-neuronal cell types in (b) no regional prediction was conducted. Source data
Extended Data Fig. 6
Extended Data Fig. 6. Marker gene expression across datasets.
a-b, Violin plots showing the expression of the top 5 marker genes (selected by specificity and adjusted p-value) of POMC subcluster C185-48: Anxa2.Pomc.Glu-5 (a) and AgRP subcluster C185-115: Npy.Agrp.GABA-4 across datasets, demonstrating that the expression level of key marker genes are mostly stable. Source data
Extended Data Fig. 7
Extended Data Fig. 7. Neuronal changes after fasting.
a, there is no change in Fos expression in Campbell et al. AgRP neurons after fasting. Left: UMAP plot depicting C66-46: Agrp.GABA-4 in HypoMap. The inset shows Agrp expression in Campbell et al. cells from C66-46: Agrp.GABA-4C66-46: Agrp.GABA-4. Right: UMAP plots of the same cells showing Fos expression in fasted and ad libitum fed states. b, CREB1 transcription factor binding site (TFBS) detection in IEG promoters compared to 1000 randomly sampled background gene promoters and IEG promoters. 1700016P03Rik contains multiple putative CREB1 binding sites in its promoter sequence, indicating it could play a role as an immediate early gene. c, Number of differentially expressed genes (DEG) after fasting in each cluster shown on the UMAP of nucSeq data. d, Enrichment of DEGs that were found in at least 20% of all clusters (155 genes) in ‘biological process’ gene ontology (GO) terms. The pvalues are based on a hypergeometric test from an over representation analysis and corrected using false discovery rate (fdr). Globally regulated genes are enriched in translation related terms and ‘cell death’. Source data
Extended Data Fig. 8
Extended Data Fig. 8. Gene expression of marker genes used for Glp1r RNAscope validation.
For each marker combination that was quantified together with Glp1r (see also Fig. 7a-c), double or triple positive cells are shown on UMAP subsets around the relevant cell types. The color scale is based on the square root of the product of expression levels. The colored rectangles in the grey reference in the central UMAP show which parts of the complete HypoMap are shown in the subsets. For most cell types the gene combinations are highly specific, especially compared to their neighboring cells. However, for Tbx19/Anxa2 only very few Glp1r cells exist in the single cell data. Source data
Extended Data Fig. 9
Extended Data Fig. 9. Gene expression of marker genes used for Pnoc RNAscope validation.
For each marker combination that was quantified together with Pnoc (see also Fig. 7e-f), double or triple positive cells are shown on UMAP subsets around the relevant cell types (See Extended Data Fig. 8 for details). Source data

Comment in

References

    1. Lowell BB. New neuroscience of homeostasis and drives for food, water, and salt. N. Engl. J. Med. 2019;380:459–471. - PubMed
    1. Saper CB, Lowell BB. The hypothalamus. Curr. Biol. 2014;24:R1111–R1116. - PubMed
    1. Betley J~Nichola, Cao Z, Ritola K, Sternson S. Parallel, redundant circuit organization for homeostatic control of feeding behavior. Cell. 2013;155:1337–1350. - PMC - PubMed
    1. Ruud, J., Steculorum, S. M. & Brüning, J. C. Neuronal control of peripheral insulin sensitivity and glucose metabolism. Nat. Commun. 8, 15259 (2017). - PMC - PubMed
    1. Campbell JN, et al. A molecular census of arcuate hypothalamus and median eminence cell types. Nat. Neurosci. 2017;20:484–496. - PMC - PubMed

Publication types

Substances