. 2022 Nov;611(7937):801-809.
doi: 10.1038/s41586-022-05308-6. Epub 2022 Oct 20.

Identification of environmental factors that promote intestinal inflammation

Affiliations

Identification of environmental factors that promote intestinal inflammation

Liliana M Sanmarco et al. Nature. 2022 Nov.

Abstract

Genome-wide association studies have identified risk loci linked to inflammatory bowel disease (IBD)1-a complex chronic inflammatory disorder of the gastrointestinal tract. The increasing prevalence of IBD in industrialized countries and the augmented disease risk observed in migrants who move into areas of higher disease prevalence suggest that environmental factors are also important determinants of IBD susceptibility and severity2. However, the identification of environmental factors relevant to IBD and the mechanisms by which they influence disease has been hampered by the lack of platforms for their systematic investigation. Here we describe an integrated systems approach, combining publicly available databases, zebrafish chemical screens, machine learning and mouse preclinical models to identify environmental factors that control intestinal inflammation. This approach established that the herbicide propyzamide increases inflammation in the small and large intestine. Moreover, we show that an AHR-NF-κB-C/EBPβ signalling axis operates in T cells and dendritic cells to promote intestinal inflammation, and is targeted by propyzamide. In conclusion, we developed a pipeline for the identification of environmental factors and mechanisms of pathogenesis in IBD and, potentially, other inflammatory diseases.


Conflict of interest statement

Competing interests The authors declare no competing interests.

Figures

Extended Data Fig. 1 |
Extended Data Fig. 1 |. TNBS-induced intestinal inflammation in Zebrafish.
(a) Zebrafish survival when treated with 25, 50, or 75 μg ml−1 TNBS for 24, 48, 72, or 96 h. Data shown as mean percent survival ±SEM of 3 independent experiments with n = 20 fish per group per experiment. (b) Intestinal scores of naive 10 d.p.f. zebrafish, or zebrafish exposed for 24 or 72 h starting at 7 d.p.f. to TNBS (25 μg ml−1). (n = 24 per group). (c) Intestinal scores of zebrafish exposed for 72 h starting at 7 d.p.f. to TNBS plus vehicle, NOS inhibitor (NOSi, 10 μM), or FICZ (10 μM). (n = 24 per group). (d–f) Intestinal scores (d) and lck (e), il17a/f, tnfa, ifng, il1b and nos2a (f) expression in 10 d.p.f. naive, or TNBS-exposed (25 μg ml−1, 72 h) vehicle- or lenaldekar-treated (LDK, 5 μM) zebrafish (n = 24 per group for intestinal scores, n = 6 for lck naive vehicle, n = 11 otherwise). (g) Intestinal scores in 10 d.p.f. naive vehicle or TNBS-exposed (25 μg ml−1, 72 h) WT, rag1- and rag2-deficient zebrafish. (n = 24 for WT naive and TNBS, n = 44 for rag1 and rag2 KO groups). (h–i) lck (h), il17a/f, tnfa, ifng, il1b and nos2a (i) expression in 10 d.p.f. TNBS-exposed (25 μg ml−1, 72 h) WT or rag2-deficient zebrafish. (n = 18 per group). (j) T cells expressing GFP under the control of the lck promoter in the intestine of naive 10 d.p.f. lck:gfp zebrafish, or lck:gfp zebrafish exposed for 72 h starting at 7 d.p.f. to TNBS (25 μg ml−1) alone or in combination with lenaldekar (LDK, 5 μM) or propyzamide (20 μM). Top panels are brightfield, middle panels are lck:gfp expression, bottom panels are a composite of both. (k) Quantification of intestinal GFP-positive T cells in lck:gfp zebrafish shown in (j). (n = 12 per group). (l) Activity of candidate chemicals in 49 ToxCast bioassays targeting genes linked to IBD; shown as active (red), inactive (blue), or no data (grey). (m) Principal component analysis based on ToxCast bioassays in chemicals found to ameliorate, promote, or have no effect on intestinal inflammation in the TNBS-induced zebrafish model. (n) Intestinal scores in zebrafish exposed for 72 h to TNBS and chemicals randomly selected from the ToxCast database at 0.2, 1, 5, or 20 μM. Each panel represents the average of n = 12 zebrafish per group. Grey panels indicate concentrations lethal to zebrafish larvae. (o,p) Intestinal scores (o) and il17a/f, tnfa, ifng, il1b and nos2a expression (p) in naive zebrafish treated with vehicle or propyzamide (0.2, 1, 5, or 20 μM) (n = 24 per group for intestinal scores, n = 9 per group for gene expression). (q) Intestinal scores of TNBS-exposed (25 μg ml−1, 72 h) zebrafish treated with vehicle, NOS inhibitor (10 μM), FICZ (10 μM), or propyzamide (20 μM), or a combination as indicated. (n = 36 for TNBS+vehicle and TNBS+propyzamide groups, n = 24 otherwise). Two-way ANOVA followed by Šídák’s multiple comparisons test for b. One-way ANOVA followed by Šídák’s or Dunnett’s multiple comparisons test for cg,k,n,o,q. Unpaired student’s T test for h,i. Data shown as mean±SEM.
Extended Data Fig. 2 |
Extended Data Fig. 2 |. Propyzamide boosts TNBS-induced colitis in mice.
(a) Gating strategy used to analyse CD4+ T cells. (b) CD3+ lymphocytes in colon normalized by tissue length from vehicle- or propyzamide-treated (100 mg kg−1) mice during TNBS-induced colitis (n = 5 mice per group). (c) Representative dot plots of IFNγ and IL17 expression in CD4+ T cells. (d) Representative dot plots of IL-17 and RORγt expression in CD4 T cells and number of IL17+RORγt+ CD4 T cells in vehicle- or propyzamide-treated TNBS mice (n = 4 for vehicle, n = 3 for propyzamide). Unpaired student’s T test. (e) Ifng and Il17 expression determined by qPCR in lamina propria mononuclear cells (LPMC) from naive mice (n = 5) and vehicle- or propyzamide-treated TNBS mice (n = 4 mice per group). (f) IL17+γδ+ or CD8+ T cells isolated from colons of vehicle- (n = 7) or propyzamide-treated (n = 9) mice during TNBS-induced colitis. (g,h) Weight change (g) and colon length (h) of mice treated with vehicle or propyzamide (100 mg kg−1) for 10 days (n = 20 mice per group). (i) Total CD4+ (n = 10 propyzamide, n = 9 vehicle), IFNγ+ CD4+ (n = 17 per group) and IL-17+ CD4+ (n = 9 per group) T cells in colons of vehicle- or propyzamide-treated mice. (j) CD8+and IFNγ+ CD8+ T cells in colons of vehicle- (n = 9 for CD8+, n = 10 for IFNγ+ CD8+) or propyzamide-treated (n = 8 per group) mice. (k) γδ+T and IL-17+ γδ+T cells in colons of vehicle- or propyzamide-treated mice (n = 10 per group). (l) CD127+ ILCs (n = 10 vehicle, n = 7 propyzamide) and IL-17+ILC3s (n = 6 per group) in colons of vehicle- or propyzamide-treated mice. (m) Rela and Cebpb expression determined by qPCR from colonic CD45+ cells isolated from vehicle- or propyzamide-treated mice (n = 4 for propyzamide Rela, n = 5 otherwise). (n) Propyzamide concentrations in plasma (n = 6 per timepoint), faeces (n = 1) and urine (n = 1) after propyzamide administration (100 mg kg−1). (o) Propyzamide levels in plasma, faeces and urine collected from naive or TNBS-induced colitis mice (n = 3 per group). One-way ANOVA followed by Holm-Šídák’s or Tukey’s of multiple comparisons test for b and e. Data shown as mean±SEM.
Extended Data Fig. 3 |
Extended Data Fig. 3 |. Effects of propyzamide on the gut microbiome.
(a) α-diversity of the faecal microbiome (n = 6 for Jejunum vehicle, n = 7 for Ileum, Caecum and Colon vehicle, n = 8 for Ileum Propyzamide, n = 9 for Jejunum, Caecum and Colon propyzamide). Kruskal–Wallis nonparametric ANOVA test. (b) β-diversity shown as Principal-coordinate analysis (PCoA) based on unweighted UniFrac metrics. (c) Relative abundance of bacteria classified at a family-level taxonomy. (d) Relative abundance of the Suterellaceae family (n = 7 for TNBS vehicle, n = 9 for TNBS propyzamide, n = 10 for naive vehicle and propyzamide) Kruskal–Wallis nonparametric ANOVA test. (e) Schematic of faecal microbiota transplant (FMT) to germ free mice. This schematic was created using BioRender. (f) 16S quantification by qPCR after FMT (n = 4 control, n = 20 before reconstitution, n = 8 for FMT from vehicle- and propyzamide-treated mice). (g,h,i) Weight loss (g) (n = 10 vehicle, n = 6 propyzamide), colon length (h) (n = 10 vehicle, n = 7 propyzamide)and representative hematoxylin & eosin staining in colons (i) from germ free mice after FMT from propyzamide- or vehicle-treated mice (n = 8 vehicle, n = 5 propyzamide for quantification). (j) CD4+, IFNγ+ CD4+ and IL-17+CD4+ T cells in colons of germ free mice after FMT from propyzamide- or vehicle-treated mice. (n = 10 mice for vehicle CD4+ and IFNγ+ CD4+, n = 9 for vehicle IL-17+CD4+, n = 8 mice for all propyzamide groups). Data shown as mean±SEM. ***p < 0.001, ** p < 0.01, *p < 0.05.
Extended Data Fig. 4 |
Extended Data Fig. 4 |. Transcriptional analysis of colonic T cells and DCs.
(a) Tnf, Il23, Il1b and Il6 expression determined by qPCR in LPMC from naive mice (n = 7) and vehicle- or propyzamide-treated mice during TNBS-induced colitis (n = 6 mice per group). (b) Tgfb and Il10 expression determined by qPCR in LPMC from naive mice (n = 7) and vehicle- or propyzamide-treated mice during TNBS-induced colitis (n = 6 mice per group). Data shown as mean±SEM. (c) Dot plot visualization of features that define cell clusters in Fig. 2i. (d) UMAP plots of colonic cells from naive or TNBS-induced colitis mice treated with vehicle or propyzamide (100 mg kg−1). (e) Cluster distribution per replicates of colonic cells from naive or TNBS-induced colitis mice treated with vehicle or propyzamide (n = 5 mice per group). (f) Heatmap of differentially expressed genes that cluster colonic DC populations from scRNAseq analysis. (g) UMAP plots of DCs from colons from naive or TNBS-induced colitis mice treated with vehicle or propyzamide (100 mg kg−1). (h) GSEA analysis showing pathways activated in DCs from propyzamide-treated mice during TNBS-colitis. (i) Percentage of each DC subpopulation from vehicle- or propyzamide-treated naive mice. (j) mRNA expression determined by bulk RNA-seq in colon samples from vehicle- or propyzamide-treated mice 24 h after anti-CD3 administration (n = 4 mice per group). (k) Cyp1a1 and Cyp1b1 expression in colonic CD45+ cells from vehicle- or propyzamide-treated mice 24 h after anti-CD3 injection (n = 6 mice per group). (l) IPA showing pathways significantly upregulated in propyzamide-treated mice analysed by bulk-RNA-seq. (m,n) Rela and Cebpb (m) and Ifng, Il17, Rorc and Il12rb1 (n) expression in colonic CD45+ cells from vehicle- and propyzamide-treated mice 24 h after anti-CD3 administration (n = 10 mice for Cebpb vehicle, n = 8 mice for Cebpb propyzamide, n = 5 for Ifng vehicle, n = 4 for Ifng propyzamide, n = 5 for Il17 propyzamide, n = 5 for Rorc vehicle, n = 5 for Il12rb1 vehicle, n = 6 mice otherwise). (o) T cells, IFNγ+ and IL-17+ CD4 T cells and IFNγ+ CD8 T cells in colon from propyzamide- and vehicle-treated mice 24 h after anti-CD3 injection. Data shown as mean±SEM. ***p < 0.001, ** p < 0.01, *p < 0.05.
Extended Data Fig. 5 |
Extended Data Fig. 5 |. Effects of propyzamide on the small intestine.
(a) mRNA expression determined by bulk RNA-seq in jejunal CD45+ cells from vehicle- and propyzamide-treated mice (n = 4 mice per group. (b,c,d,e) CD4, IFNγ+ CD4 and IL-17+ CD4 T cells (b), CD8 and IFNγ+ CD8 T cells (c), γδ and IL-17+ γδ T cells (d), ILC and IL-17+ILC3 (e) in jejunum from vehicle- or propyzamide-treated mice. (n = 10 mice for IL-17+CD4 T cells vehicle, IFNγ+ CD8 T cells vehicle, γδ and IL-17+ γδ T cells vehicle, ILC and IL-17+ILC3 vehicle, n = 7 mice for CD8 T cells propyzamide and γδ T cells propyzamide, n = 8 for ILC propyzamide, n = 9 mice otherwise). (f) Transactivation of the RARα promoter in RARa-luciferase transfected HEK293T cells treated with retinoic acid or retinoic acid and propyzamide. (g) Transactivation of the PPARα promoter in PPARa-luciferase transfected HEK293T cells treated with fenofibrate, or propyzamide and fenofibrate for 24 h. (h) Rorc and Il12rb1 expression evaluated by qPCR in colonic CD4 T cells sorted from vehicle- or propyzamide-treated WT or AHRd mice after TNBS-colitis. (i) Il1b, Tnf and Il23 expression in sorted DCs. (j) Rela expression in BMDCs (n = 5 per group). (k) C/EBPβ expression, determined by ELISA, following Rela knockdown in BMDCs (n = 3 per group). (l) Relative expression of p65 subunit of NF-κB in primary murine DCs as a result of the depicted chemical treatment previously identified to be linked to IBD in Fig. 1d. (m) Microtubule destabilization after paclitaxel and/or propyzamide incubation with fluorescent tubulin. Data shown as mean±SEM. ****p < 0.0001, ***p < 0.001, ** p < 0.01, *p < 0.05.
Extended Data Fig. 6 |
Extended Data Fig. 6 |. C/EBPβ activation in DCs boosts colitogenic T-cell differentiation.
(a) Cebpb expression following propyzamide treatment in primary DCs from WT and Cebpb−/− mice (n = 14 vehicle-treated WT cells, n = 9 propyzamide-treated WT cells, n = 4 vehicle-treated Cebpb−/− cells, n = 5 propyzamide-treated Cebpb−/− cells). One-way ANOVA test followed by Tukey’s post-hoc test. (b) Il1b, Il23 and Tnf, expression following Cebpb knockdown in BMDCs. (For Il1b n = 6 siNT vehicle, n = 4 siNT propyzamide, n = 5 siCebpb vehicle and n = 6 siCebpb propyzamide. For Tnf, n = 6 siNT vehicle, n = 3 siNT propyzamide, n = 6 siCebpb vehicle and n = 6 siCebpb propyzamide. For Il23, n = 5 siNT vehicle, n = 3 siNT propyzamide, n = 7 siCebpb vehicle and n = 9 siCebpb propyzamide). One-way ANOVA test followed by Holm-Šidák’s post-hoc test. (c) Cebpb expression following Cebpb silencing in BMDCs (n = 8 siNT vehicle, n = 5 siNT propyzamide, n = 9 siCebpb vehicle and n = 5 siCebpb propyzamide). (d) Gate strategy used to sort human DCs from PBMCs. (e) CEBPB expression in human DCs treated with propyzamide after knockdown with CEBPB-targeting (siCEBPB) or non-targeting (siNT) siRNAs (n = 6 per group). Two-way ANOVA followed by Tukey’s multiple comparisons post-hoc test. (f) ChIP-seq and ATAC-seq re-analyses from of Cebpb binding to Il1b, Tnf and Il23 promoter in GM-CSF or Flt3 differentiated DCs. (g) Analysis of splenic DCs from TNBS-induced colitis mice. This schematic was created using BioRender. (h) IFNγ, IL-17 and TNF representative histograms in T cells co-cultured with splenic DCs from vehicle- or propyzamide-treated TNBS-induced colitis mice. MFI of IL-17, IFNγ and TNF OT-II CD4+ T cells following co-culture with splenic DCs from propyzamide- or vehicle-treated mice (n = 6 vehicle-treated mice, n = 4 propyzamide-treated mice). Unpaired t-test. (i) Ifng and Il17 expression determined by qPCR in co-cultures from WT and Cebpb−/− DCs pre-treated with vehicle or propyzamide in presence of OVA peptide and co-culture with OT-II naive CD4 T cells for 48 h (For Ifng, n = 4 WT vehicle, n = 4 WT propyzamide, n = 7 Cebpb−/− vehicle and n = 6 Cebpb−/− propyzamide. For Il17, n = 7 WT vehicle, n = 4 WT propyzamide, n = 4 Cebpb−/− vehicle and n = 6 Cebpb−/− propyzamide). One-way ANOVA test followed by Holm-Šidák’s multiple comparisons post-hoc test. (j) TNF, IL-17 and IL-6 relative levels determined in co-culture supernatants of human DCs pre-treated as specified in the figure, and then incubated with allogenic T cells for 48 h. (For Tnf, n = 3 per group. For Il17, n = 4 per group). One-way ANOVA test followed by Holm-Šidák’s multiple comparisons post-hoc test. (k–l) Cebpb expression (k) and Il1b, Il23 and Tnf expression (l) determined by qPCR in primary splenic DCs transfected with cumate-inducible Cebpb-expressing plasmid after cumate treatment as depicted for 96 h. (For Cebpb (k), n = 5 vehicle-treated and n = 3 for each cumate-treated group. For Tnf and Il23 (l) n = 4 vehicle-treated and n = 3 for each cumate-treated group). One-way ANOVA test followed by Holm-Šidák’s post-hoc test. Data shown as mean±SEM.
Extended Data Fig. 7 |
Extended Data Fig. 7 |. scRNAseq analysis of intestinal DCs from IBD patients.
(a) UMAP plot and cluster distribution per replicates of colonic leukocytes isolated from Cebpb−/− (n = 2 mice) and WT (n = 5 mice) DC chimeras after TNBS-colitis. (b) UMAP plot showing DC clusters analysed in colon from WT and Cebpb−/− DC chimeras analysed by scRNAseq. (c) Number of cells per DC cluster and cluster distribution per replicates. (d) Cebpb expression in DCs recovered from WT or Cebpb−/− DC chimera. (e) UMAP plot of 58 samples from 44 IBD patients and healthy controls. (f) Dot Plot visualization of features that define DCs and T cells. (g) Differentially regulated pathways in DCs from IBD patients. (h) Violin plot depicting CEBPB expression in DCs from IBD and healthy controls. (i) UMAP depicting intestinal DCs from IBD and healthy controls analysed by scRNA-seq. (j) CEBPB expression in DC1 and DC2 subsets. (k) Differentially regulated pathways in CEBPB expressing DCs.
Extended Data Fig. 8 |
Extended Data Fig. 8 |. VCAM-1 blockade ameliorates intestinal inflammation.
(a) Network analysis of molecules reported in ToxCast database to be induced by propyzamide. (b) Effect of propyzamide on Vcam1 promoter activity (n = 10 for 0.2 μM propyzamide, n = 7 otherwise). (c) Vcam1 expression in colons from naive and TNBS-induced colitis mice treated with vehicle or propyzamide (100 mg kg−1) (n = 5 mice per group). Unpaired t-test. (d) Effect of propyzamide on Itga4 and Itga1 expression in T cells (n = 3 for Itga4 propyzamide, n = 4 otherwise). Unpaired t test. (e) Evaluation of VCAM-1 blocking antibodies in TNBS-induced colitis. This schematic was created using BioRender. (f) Effect of VCAM-1 blocking antibodies (100 μg per mouse) or isotype controls on TNBS-induced colitis (Weight: n = 12 for vehicle isotype control, n = 9 for vehicle anti-VCAM1, n = 7 for propyzamide anti-VCAM1, n = 13 otherwise, Colon length: n = 15 for naive, n = 5 for vehicle isotype control, n = 13 for propyzamide isotype control, n = 7 otherwise). (g,h) Representative hematoxylin & eosin staining (g) and clinical histomorphology scores (h) (n = 4 mice for antiVCAM1-treated mice, n = 5 mice otherwise). Arrows show leukocyte infiltrates. (i) Effect of VCAM-1 blocking antibodies (100 μg per mouse) or isotype controls on colonic IFNγ+ and IL17+ CD4+ T cells during TNBS-induced colitis determined by flow cytometry (IFNγ: n = 6 mice for vehicle isotype control, n = 5 mice for propyzamide isotype control, n = 4 otherwise. IL17: n = 4 mice for vehicle and propyzamide anti-VCAM1, n = 5 otherwise). One-way ANOVA followed by post-hoc tests Tukey’s or Holm-Sidak’s test for selected multiple comparisons for b, f, h and i. Data shown as mean±SEM.
Extended Data Fig. 9 |
Extended Data Fig. 9 |. Propyzamide boosts colitogenic T-cell differentiation.
(a) Gate strategy used to study CD4 T cells. (b) Percentage of IFNγ+ CD4+ T cells and Ifng expression of CD4+ T cells activated under Th1-polarizing conditions in the presence of vehicle or propyzamide (n = 3 per group). Unpaired t-test. (c) Percentage of IL-17+ CD4+ T cells and Il17 expression of CD4+ T cells activated under Th17-polarizing conditions in the presence of vehicle or propyzamide (n = 3 per group). Unpaired t-test. (d) Tbx21, Csf2 and Il12rb1 expression in CD4+ T cells activated under Th1 polarizing conditions in the presence of vehicle or propyzamide (n = 3 per group, except propyzamide-treated cells expressing Il12rb1, n = 4). Unpaired t-test (e) Csf2, Tnf and Rorc expression in CD4+ T cells activated under Th17 polarizing conditions in the presence of vehicle or propyzamide (For Csf2 n = 3per group, for Rorc n = 3 vehicle-treated and n = 4 propyzamide-treated, for Tnf n = 5 per group) Unpaired t-test. (f) Nuclear p65 translocation in splenic CD4+ T cells activated with anti-CD3 and anti-CD28 in the presence of vehicle or propyzamide (n = 3 per group). Unpaired t-test. (g,h) Rela (g) and Cebpb (h) expression following Rela knockdown in T cells and treated with vehicle or propyzamide (For (g) n = 3 per siNT group and n = 4 per siRela group, for (h) n = 5 per siNT group and n = 4 per siRela group). One-way ANOVA test followed by Holm-Šidák’s multiple comparisons post-hoc test. (i) Cebpb expression in murine splenic WT and Cebpb−/− T cells (n = 9 vehicle-treated WT cells, n = 7 propyzamide-treated WT cells, n = 3 vehicle-treated Cebpb−/− cells, n = 3 propyzamide-treated Cebpb−/− cells). One-way ANOVA test followed by Holm-Šidák’s multiple comparisons post-hoc test. (j) CEBPB expression following CEBPB knockdown in human T cells.(n = 4 per group except n = 3 siCEBPB propyzamide-treated group). (k) ILCs and CD8 T cells in colons from Rag1−/− mice reconstituted with WT or Cebpb−/− T cells. (n = 4 per group except Cebpb−/− CD8 T cells n = 5). Data shown as mean±SEM. ***p < 0.001, ** p < 0.01, *p < 0.05.
Extended Data Fig. 10 |
Extended Data Fig. 10 |. scRNAseq analysis of intestinal T cells from IBD patients.
(a) UMAP depicting total intestinal T cells analysed by scRNA-seq. (b) Dot plot visualization of features to identify T-cell subsets. (c) Heat map of differentially expressed genes in T cells from IBD patients and healthy controls. (d) Upstream analysis of NF-κB-driven CEBPB expression in T cells. (e) CEBPB expressing T cells from IBD and HC samples. (f,g,h) Pathway analysis of differentially expressed genes in Resident Memory T cells (f), CD8 T cells (g) and ILCs (h) from IBD and healthy control samples. (i) Graphical model of modulation of colitogenic T cell responses by NF-κB-driven C/EBPβ signalling and propyzamide.
Fig. 1 |
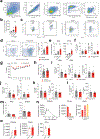
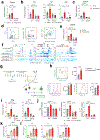
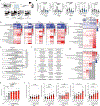
Fig. 1 |. Identification of environmental chemicals that boost intestinal inflammation.
a, Zebrafish (7 d.p.f.) were immersed in TNBS-containing E3 medium to induce intestinal inflammation and were scored 72 h later. The images show the effect of NOS inhibition (NOSi) and AHR activation by FICZ on intestinal pathology. The plate, microscope and slide elements of this figure were created using BioRender. b, Gene expression in naive or TNBS-treated zebrafish exposed to vehicle, NOSi (5 μM) or FICZ (5 μM). n = 12 (il17a/f and ifng) and n = 14 (tnfa, il1b and nos2a). c, Intestinal scores of naive or TNBS-treated zebrafish exposed to vehicle, NOSi or FICZ (top), or environmental chemicals (0.2, 1, 5 or 20 μM) that suppressed (middle) or promoted (bottom) inflammation. n = 24 per group. d, Gene expression in TNBS-treated zebrafish exposed to candidate chemicals (1 or 20 μM). n = 9 per group. e, The workflow for the identification of candidate environmental chemicals based on the US EPA ToxCast database. f, The top 20 candidate chemicals predicted to worsen intestinal inflammation identified by the RF–RWR algorithm. g, Intestinal scores in TNBS-treated zebrafish exposed to environmental chemicals (0.2, 1, 5 or 20 μM) identified by the RF–RWR algorithm. n = 12 per group. Grey shading indicates lethality. h,i, Intestinal score (h; n = 48 per group) and gene expression (i; n = 18 per group) in vehicle- or propyzamide-treated (0.2, 1, 5 or 20 μM) TNBS zebrafish. For b, h and i, data are mean ± s.e.m. Statistical analysis was performed using one-way analysis of variance (ANOVA) followed by Dunnett’s multiple-comparisons test (bd and gi); ****P < 0.0001, ***P < 0.001, **P < 0.01, *P < 0.05.
Fig. 2 |
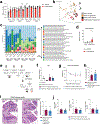
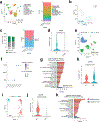
Fig. 2 |. Propyzamide identifies candidate regulators of intestinal inflammation.
a,b, Weight (a) and colon length (b) of naive or vehicle- or propyzamide-treated (100 mg kg−1) TNBS mice. n = 5 (naive), n = 6 (TNBS + vehicle) and n = 10 (TNBS + propyzamide). Statistical analysis was performed using two-way ANOVA with Tukey’s multiple-comparison post hoc test. c, Haematoxylin and eosin (H&E) colon images and histomorphology scores. n = 5 mice per group. The arrows indicate leukocyte infiltration. Scale bars, 100 μm. d, Colonic IFNγ+CD4+, IL-17+CD4+ and IFNγ+CD8+ T cells in vehicle- or propyzamide-treated TNBS mice. n = 6 (vehicle) and n = 5 (propyzamide). e,f, Heat map (e) and ingenuity pathway analysis (IPA) (f) showing mRNA expression determined by bulk RNA-seq in colons from vehicle-treated (n = 2) or propyzamide-treated (n = 3) TNBS mice. Sig, signalling. g, AHR inhibition of NF-κB–C/EBPβ signalling as a candidate mediator of propyzamide effects in TNBS mice. h, Rela and Cebpb expression determined by qPCR in colonic CD45+ cells from vehicle-treated (n = 4) or propyzamide-treated (n = 5) TNBS mice. Statistical analysis was performed using two-tailed Mann–Whitney U-tests. i, Uniform manifold approximation and projection (UMAP) plot of a scRNA-seq analysis of colon cells from propyzamide- or vehicle-treated naive and TNBS mice. n = 5 mice per group. j, DCs and T cells from vehicle- or propyzamide-treated mice within each subpopulation. k, Pathways upregulated by propyzamide treatment. l, UMAP plot of the DC cluster in Fig. 3i. m, Cells from vehicle- or propyzamide-treated mice within each subpopulation. n, AHR signature score M9986 in DCs. Statistical analysis was performed using unpaired two-tailed t-tests. o, Jejunal weight/length ratio before and 3 h and 24 h after administration of anti-CD3 antibodies. n = 10 (vehicle, naive), n = 15 (vehicle, 3 h after anti-CD3 administration), n = 6 (vehicle, 24 h after anti-CD3), n = 9 (propyzamide, naive), n = 14 (propyzamide, 3 h after anti-CD3) and n = 12 (propyzamide, 24 h after anti-CD3 injection) mice. p, H&E staining of jejunum sections 24 h after injection of anti-CD3 antibodies. The villus height and villus height/crypt length ratio are shown. Scale bars, 100 μm. q, TUNEL staining and TUNEL+ cells in the jejunum 24 h after anti-CD3 administration. Scale bar, 100 μm. For a, b, d, h and oq, data are mean ± s.e.m.
Fig. 3 |
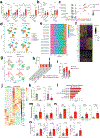
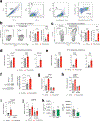
Fig. 3 |. Propyzamide suppresses AHR signalling.
a, AHR reporter activity after propyzamide (10 μM) and/or FICZ (0.5 μM) treatment. n = 5 (FICZ and propyzamide + FICZ), n = 6 (other groups). b, Cyp1a1 and Cyp1b1 expression in wild-type (WT) or AHRd DCs. n = 6 (vehicle), n = 10 (propyzamide), n = 5 (FICZ), n = 8 (propyzamide + FICZ) for Cyp1a1 in wild-type DCs; n = 3 (propyzamide and propyzamide + FICZ) and n = 5 (FICZ) for Cyp1b1 in wild-type DCs; n = 3 (vehicle and propyzamide) for Cyp1b1 in AHRd DCs; and n = 4 (other groups). c, CYP1A1 expression in human DCs. n = 6 donors. d, Cyp1a1 and Cyp1b1 expression in mouse T cells. n = 4 (propyzamide Cyp1b1; vehicle, propyzamide and FICZ Cyp1a1), n = 3 (other groups). e, CYP1A1 expression in human T cells. n = 4 donors. f, 3H-TCDD-displacement assay from human or mouse AHR. n = 3 independent experiments. gj, Colon length (g), histopathology score (h), representative images of colon (i) and the numbers of IFNγ+CD4+ and IL-17+CD4+ T cells ( j) from wild-type (n = 5 (vehicle) and n = 6 (propyzamide)) and AHRd TNBS-colitis mice (n = 3 per group). Scale bars, 100 μm. km, NF-κB p65 phosphorylation (k) (n = 4 wild-type, n = 3 AHRd) and Cebpb expression in CD4+ T cells (l) and DCs (m) from wild-type and AHRd mice during TNBS-induced colitis (n = 10 and n = 8 (wild-type vehicle T cells and DCs, respectively), n = 4 and n = 8 (wild-type propyzamide T cells and DCs, respectively) and n = 3 (other groups). n, Cebpb expression in DCs treated with vehicle (n = 13), propyzamide (n = 6), FICZ (n = 10) or propyzamide + FICZ (n = 14). o, Il1b, Il23 and Tnf expression in wild-type or Cebpb−/− DCs (n = 11 (Il1b and Tnf, vehicle, wild-type DCs), n = 6 (Il1b, propyzamide, wild-type DCs), n = 4 (Cebpb−/− DCs, vehicle), n = 8 (Il23, propyzamide, wild-type DCs) and n = 5 (other groups). p, IL1B, IL23 and TNF expression in human DCs treated with propyzamide after CEBPB (siCEBPB) or control (siNT) knockdown. n = 4 donors per condition. Statistical analysis was performed using one-way ANOVA with Dunnett’s, Sidak’s or Tukey’s post hoc test for selected multiple comparisons (a, b, d, fh and kp) and unpaired two-tailed t-tests (c and e). For ah and jp, data are mean ± s.e.m.
Fig. 4 |
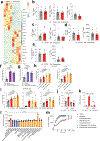
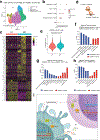
Fig. 4 |. NF-κB–C/EBPβ signalling boosts colitogenic T cell responses.
a, Transactivation of Il1b, Il23 and Tnf promoters after Cebpb expression in DC2.4 cells. n = 6 per condition. b, Predicted C/EBPβ-binding sites (top) and C/EBPβ recruitment (bottom) to Il1b, Il23 and Tnf promoters in DCs. n = 3–7 per group. c,d, Weight change (c) and colon length (d) in wild-type and Cebpb−/− DC chimeras. e, Representative H&E colon images and histomorphology scores. n = 5 (wild-type DCs) and n = 3 (Cebpb−/− DCs). Scale bar, 100 μm. f, GSEA showing pathways downregulated in cDC1 and cDC2 from Cebpb−/− DC chimeras. g, Total CD4+, IFNγ+CD4+ and IL-17+CD4+ T cells in wild-type DC (n = 5 mice) and Cebpb−/− DC (n = 3 mice) chimeras. Statistical analysis was performed using unpaired t-tests. h, Predicted C/EBPβ-binding sites (top) and C/EBPβ recruitment (bottom) to Ifng, Il12rb1 and Rorc promoters in mouse CD4+ T cells. n = 3–8 per group. i, Transactivation of IFNG, IL12RB1 and RORC promoters by C/EBPβ expression in human CD4+ T cells. n = 6 per condition. j, Ifng, Il17, Rorc and Il12rb1 expression in splenic wild-type or Cebpb−/− CD4+ cells treated with propyzamide in vitro. Ifng: n = 14 (wild-type, vehicle), n = 9 (wild-type, propyzamide) and n = 3 (Cebpb−/−); Rorc: n = 7 (wild-type, vehicle), n = 6 (Cebpb−/−, vehicle) and n = 5 (other groups); Il12rb1: n = 5 (wild-type, vehicle and propyzamide) and n = 4 (other groups). NS, not significant. k, IFNγ and IL-17 levels in human T cell supernatants after CEBPB silencing and propyzamide treatment. n = 3 (Il17, siCEBPB, vehicle) and n = 4 (other groups). l,m, Weight change (l) and colon length (m) in Rag1-KO mice reconstituted with wild-type or Cebpb−/− T cells during TNBS-induced colitis. n, Representative H&E colon staining and histomorphology scores. n = 4 (wild-type) and n = 5 (Cebpb−/−). Scale bars, 100 μm. o, Total CD4+, IFNγ+CD4+ and IL-17+CD4+ T cells from colons of the TNBS-treated mice in l. n = 5 (CD4+ and IFNγ+CD4+, Cebpb−/−) and n = 4 (other groups) mice. Statistical analysis was performed using one-way ANOVA with Dunnett’s, Sidak’s, Holm Sidak’s or Tukey’s post hoc test for selected multiple comparisons (c, d and jm). For ae and go, data are mean ± s.e.m.

Comment in

  • Zebrafishing for toxins.
    Bordon Y. Bordon Y. Nat Rev Immunol. 2022 Dec;22(12):718. doi: 10.1038/s41577-022-00801-5. Nat Rev Immunol. 2022. PMID: 36357705 No abstract available.

References

    1. Huang H et al. Fine-mapping inflammatory bowel disease loci to single-variant resolution. Nature 547, 173–178 (2017). - PMC - PubMed
    1. Kamm MA Rapid changes in epidemiology of inflammatory bowel disease. Lancet 390, 2741–2742 (2018). - PubMed
    1. Covacu R et al. System-wide analysis of the T cell response. Cell Rep. 14, 2733–2744 (2016). - PMC - PubMed
    1. Quintana FJ et al. Adaptive autoimmunity and Foxp3-based immunoregulation in zebrafish. PLoS ONE 5, e9478 (2010). - PMC - PubMed
    1. Wheeler MA et al. Environmental control of astrocyte pathogenic activities in CNS inflammation. Cell 176, 581–596 (2019). - PMC - PubMed

Publication types

MeSH terms