. 2022 Oct 20;20(1):236.
doi: 10.1186/s12915-022-01436-7.

Comparative genomic and transcriptomic analyses of trans-kingdom pathogen Fusarium solani species complex reveal degrees of compartmentalization

Affiliations

Comparative genomic and transcriptomic analyses of trans-kingdom pathogen Fusarium solani species complex reveal degrees of compartmentalization

Daphne Z Hoh et al. BMC Biol. .

Abstract

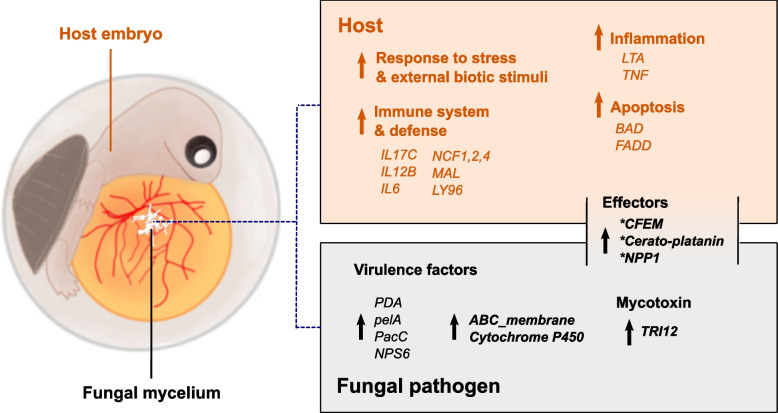
Background: The Fusarium solani species complex (FSSC) comprises fungal pathogens responsible for mortality in a diverse range of animals and plants, but their genome diversity and transcriptome responses in animal pathogenicity remain to be elucidated. We sequenced, assembled and annotated six chromosome-level FSSC clade 3 genomes of aquatic animal and plant host origins. We established a pathosystem and investigated the expression data of F. falciforme and F. keratoplasticum in Chinese softshell turtle (Pelodiscus sinensis) host.

Results: Comparative analyses between the FSSC genomes revealed a spectrum of conservation patterns in chromosomes categorised into three compartments: core, fast-core (FC), and lineage-specific (LS). LS chromosomes contribute to variations in genomes size, with up to 42.2% of variations between F. vanettenii strains. Each chromosome compartment varied in structural architectures, with FC and LS chromosomes contain higher proportions of repetitive elements with genes enriched in functions related to pathogenicity and niche expansion. We identified differences in both selection in the coding sequences and DNA methylation levels between genome features and chromosome compartments which suggest a multi-speed evolution that can be traced back to the last common ancestor of Fusarium. We further demonstrated that F. falciforme and F. keratoplasticum are opportunistic pathogens by inoculating P. sinensis eggs and identified differentially expressed genes also associated with plant pathogenicity. These included the most upregulated genes encoding the CFEM (Common in Fungal Extracellular Membrane) domain.

Conclusions: The high-quality genome assemblies provided new insights into the evolution of FSSC chromosomes, which also serve as a resource for studies of fungal genome evolution and pathogenesis. This study also establishes an animal model for fungal pathogens of trans-kingdom hosts.

Keywords: Animal pathogenicity; Chromosome evolution; Fusarium solani species complex; Genome compartments; Opportunistic pathogen; Turtle.


Conflict of interest statement

Not applicable.

Figures

Fig. 1
Fig. 1
Average nucleotide similarities and species tree of Fusarium solani species complex (FSSC). a Nucleotide identities determined by multi-locus sequences (ITS+TEF+RPB2) commonly used for FSSC in the lower green-shaded triangular matrix and genome average nucleotide identity in selected Fusarium species in the upper orange-shaded triangular matrix. Darker shading indicates higher sequence similarity. b A simplified Fusarium species tree with outgroup species collapsed. The full phylogeny is in Additional file 2: Fig. S2 and constructed using 2385 single-copy orthogroup sequences. Species name in bold represents the strains sequenced in current study and source origin (host) represented by icons
Fig. 2
Fig. 2
Shared ortholog and structural features of Fusarium solani species complex chromosomes. a Proportion of one-to-one ortholog shared across six genomes. Figure shows only chromosome of F. falciforme Fu3 and F. vanettenii Fs6. See Additional file 2: Fig. S4 for all six genomes. b Proportion of one-to-one ortholog shared with three additional Fusarium genomes outside of FSSC including F. oxysporum, F. graminearum, and F. fujikuroi. c Proportions of repeat elements and d FSSC-specific gene of each chromosome and chromosome type. Statistical significance was calculated using Wilcoxon rank sum test (**: p < 0.01; ****: p < 0.0001; ns: p > 0.05). e Subset of synteny dotplot between F. vanettenii Fs6 lineage-specific chromosomes (numbered in colour brown) and FVANE. Full genome dotplot can be found in Additional file 2: Fig. S6
Fig. 3
Fig. 3
Evolutionary dynamics and origin of fast-core chromosomes. a The density of dN/dS in F. falciforme Fu3 chromosomes for each single-copy ortholog gene paired with F. keratoplasticum Fu6. b Syntenic dotplot produced via PROmer comparing between F. falciforme Fu3 and F. oxysporum f. sp. lycopercisi 4287 genomes
Fig. 4
Fig. 4
5mC DNA methylation levels in Fusarium solani species complex genomes and its chromosome types. a Methylation density and level of each genome and the chromosome types. Number and line indicate genome’s methylation median. Statistical significance was calculated using Wilcoxon rank sum test (*: p < 0.0001). b Percentages of coding gene, repeats, and methylation across 10-kb window of F. falciforme Fu3 chromosomes. c Pearson correlation coefficient between proportion of genome features and methylation level in F. falciforme Fu3. d Methylation level of genome features in F. falciforme Fu3. CC, FCC, and LSC represents core chromosome, fast-core chromosome, and lineage-specific chromosome, respectively
Fig. 5
Fig. 5
Laser confocal microscopy images of Pelodiscus sinensis eggshell cross section inoculated by Fusarium solani species complex. The eggshell was undecalcified and acquired at 5-day post-infection of F. falciforme Fu3 and F. keratoplasticum Fu6. Fungal material was stained with Calcofluor White (blue signal). DIC = differential interference contrast. WC = white contrast. Scale bar in figures is 50μm except 10μm in positive control
Fig. 6
Fig. 6
Transcriptomes of Fusarium solani species complex inoculated on Pelodiscus sinensis eggs. a Principal component analysis (PCA) of gene expression patterns in F. falciforme Fu3 and F. keratoplasticum Fu6 samples. b Number of differentially expressed (DE) orthogroup amongst the two pathogens. Numbers in the bracket represents number of genes in the orthogroup. c,d Expression levels in Log2 transcript per million (TPM; left y-axis) and Log2 fold change (right y-axis) of genes containing CFEM domain in F. falciforme Fu3 (c) and F. keratoplasticum Fu6 (d) comparing between control (mycelium grown on PDA) and inoculated samples
Fig. 7
Fig. 7
Schematic diagram summarising genes and functions involved in Fusarium solani species complex-Pelodiscus sinensis egg infection. The colour-coded text represents turtle host (brown) and pathogens (grey). Up arrow denotes upregulated genes and enriched functions. Asterisk denotes the presence of signal peptide

References

    1. Zhang N, O’Donnell K, Sutton DA, Nalim FA, Summerbell RC, Padhye AA, et al. Members of the Fusarium solani species complex that cause infections in both humans and plants are common in the environment. J Clin Microbiol. 2006;44(6):2186–2190. - PMC - PubMed
    1. O’Donnell K, Sutton DA, Wiederhold N, Robert VARG, Crous PW, Geiser DM. Veterinary Fusarioses within the United States. J Clin Microbiol. 2016;54(11):2813–2819. - PMC - PubMed
    1. Dean R, Van Kan Ja L, Pretorius ZA, Hammond-Kosack KE, Di Pietro A, Spanu PD, et al. The top 10 fungal pathogens in molecular plant pathology. Mol. Plant Pathol. 2012;13(4):414–430. - PMC - PubMed
    1. Al-Hatmi AMS, Meis JF, de Hoog GS. Fusarium: molecular diversity and intrinsic drug resistance. Plos Pathog. 2016;12(4):e1005464. - PMC - PubMed
    1. Walther G, Stasch S, Kaerger K, Hamprecht A, Roth M, Cornely OA, et al. Fusarium Keratitis in Germany. J Clin Microbiol. 2017;55(10):2983–2995. - PMC - PubMed

Publication types

Supplementary concepts

LinkOut - more resources