. 2022 Oct 20;23(1):223.
doi: 10.1186/s13059-022-02781-0.

Replication stress generates distinctive landscapes of DNA copy number alterations and chromosome scale losses

Affiliations

Replication stress generates distinctive landscapes of DNA copy number alterations and chromosome scale losses

Nadeem Shaikh et al. Genome Biol. .

Abstract

Background: A major driver of cancer chromosomal instability is replication stress, the slowing or stalling of DNA replication. How replication stress and genomic instability are connected is not known. Aphidicolin-induced replication stress induces breakages at common fragile sites, but the exact causes of fragility are debated, and acute genomic consequences of replication stress are not fully explored.

Results: We characterize DNA copy number alterations (CNAs) in single, diploid non-transformed cells, caused by one cell cycle in the presence of either aphidicolin or hydroxyurea. Multiple types of CNAs are generated, associated with different genomic regions and features, and observed copy number landscapes are distinct between aphidicolin and hydroxyurea-induced replication stress. Coupling cell type-specific analysis of CNAs to gene expression and single-cell replication timing analyses pinpointed the causative large genes of the most recurrent chromosome-scale CNAs in aphidicolin. These are clustered on chromosome 7 in RPE1 epithelial cells but chromosome 1 in BJ fibroblasts. Chromosome arm level CNAs also generate acentric lagging chromatin and micronuclei containing these chromosomes.

Conclusions: Chromosomal instability driven by replication stress occurs via focal CNAs and chromosome arm scale changes, with the latter confined to a very small subset of chromosome regions, potentially heavily skewing cancer genome evolution. Different inducers of replication stress lead to distinctive CNA landscapes providing the opportunity to derive copy number signatures of specific replication stress mechanisms. Single-cell CNA analysis thus reveals the impact of replication stress on the genome, providing insights into the molecular mechanisms which fuel chromosomal instability in cancer.


Conflict of interest statement

The authors declare that they have no competing interests.

Figures
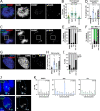
Fig. 1
Fig. 1
Replication stress induced by low-dose aphidicolin or hydroxyurea results in chromosome mis-segregation and micronuclei comprised of acentric chromatin. A Image of RPE1 prometaphase cell; DNA damage foci detected using γH2AX antibody. Scale bar in this and all subsequent microscopy images represents 5 μm. B Quantification of DNA damage in RPE1 prometaphase cells after indicated treatments; “noc w/o” indicates a nocodazole washout and release (see “Methods”). Statistical test was an unpaired t-test, comparing DMSO control to each individual condition. Data from at least three experiments, each in a separate color with mean for each experiment represented by large circle; n=94–147 total cells per treatment. C Immunofluorescence image of RPE1 anaphase cell with acentric lagging chromosome; centromeric proteins stained with CREST, DNA damage foci detected by γH2Ax staining. D Segregation error rates in RPE1 anaphase cells after indicated treatments (summary of three to seven experiments; n=105–313 cells, respectively; combined data from immunofluorescent and FISH analysis (see Figure S2f)); statistical test was an unpaired t-test. Each dot indicates mean of individual experiment. Error bars here and in all other figures indicate standard deviation. E Centromeric status of lagging chromosomes in RPE1 cells (as determined by CREST staining) after indicated treatments (n=2, 46, 7, or 37 lagging chromosomes, respectively, taken from at least three experiments). F Percentage of lagging chromosomes in RPE1 anaphase cells with DNA damage detectable on chromosome ends or within chromosome mass (n=0, 35, 12, and 37 lagging chromosomes scored in DMSO, aphidicolin, hydroxyurea, or nocodazole washout treatment, summary of three experiments). G Representative image of RPE1 cell with an acentric micronucleus. CREST antibody was used to stain for presence of centromeric proteins. H Quantification of micronuclei rates in RPE1 cells after indicated treatments (n=658–2150 cells respectively, taken from three to seven experiments) (see also Figure S2f for FISH staining). I Centromere status of micronuclei in RPE1 cells after indicated treatments (n=86–122 micronuclei per condition from three experiments), as determined by CREST staining (see also figure S2f). J Representative images of RPE1 cells treated with specific chromosome FISH probes to identify chromosomal identity of micronuclei. K Quantification of frequency with which indicated chromosomes were detected in micronuclei in RPE1 cells (summary of at least three experiments per chromosome tested, 50–100 micronuclei scored per chromosome per experiment). Statistical test was a one-way ANOVA
Fig. 2
Fig. 2
Genomic features of aCNAs detected by single-cell whole genome sequencing. A Diagrams summarizing all RPE1 CNAs induced by indicated treatments, after removing clonal events (see “Methods”). Yellow lines indicate location of centromeres, purple lines represent RPE1-specific CFS locations. B Frequency of CNAs occurring in RPE1 cells after treatments as indicated (n = 90, 332, or 170 cells, respectively). C Distribution of CNAs divided by size and by gains versus losses in RPE1 (31 CNAs identified in DMSO, 136 in aphidicolin, 118 in HU). D Rate of CNA classes per cell (small CNAs defined as less than 20 Mb; large defined as 20 Mb or larger). E Frequencies of CNAs (left y-axis) across each chromosome after aphidicolin or HU treatment as indicated, divided into large (>20 Mb) and small (< 20 Mb) CNAs. Dotted line indicates size of each chromosome (right y-axis)
Fig. 3
Fig. 3
Transcription of giant genes can underlie cell type-dependent susceptibility to large aCNAs. A Diagram summarizing all BJ aCNAs taken from 168 cells, after removing clonal events (see “Methods”). Yellow lines show centromeres, purple lines indicate positions of BJ-specific CFS. B Frequency of CNAs occurring in BJ cells after DMSO or aphidicolin as indicated (n = 92 and 168 cells respectively). C Range of sizes of CNAs divided into loss and gain in BJ cells (32 CNAs identified in DMSO, 85 in aphidicolin). D Frequency of small or large CNAs for each chromosome in BJ cells after aphidicolin treatment. E Map of large CNAs in RPE1 and BJ cells after aphidicolin. F Upper panel; schematic indicating S-phase fractions isolated using FACS for single-cell replication timing. Lower panel: single-cell replication timing analyses for RPE1 and BJ cells as indicated from each S-phase fraction. Dark blue indicates replicated genomic regions. G Replication timing factor (see “Methods”) was plotted for each aCNA in RPE1 and BJ cells, and compared to random control regions (470 in silico randomly generated 2 Mb windows, see “Methods”). Statistical tests compare all aCNA classes to in silico control CNAs using a one-way ANOVA Kruskal-Wallis test with post hoc Dunn’s correction
Fig. 4
Fig. 4
Large gene transcription underlies large, cell type-specific, recurrent aCNAs. A Summed gene expression within a 2 Mb window around each aCNA breakpoint, separated into CNA classes as indicated for RPE1 and BJ cells. B Distances from individual aCNAs to the nearest large or giant gene. Control represents 432 randomly generated genomic coordinates. C Proportion of CNAs with a breakpoint that falls within 1 Mb of large/giant gene. D Schematic of chromosome 7, with position of large (>20 Mb) CNAs found in RPE1 and BJ cells, with replication timing profile, gene expression (each dot indicates location and expression level (RPKM values, mean of three replicates) of an individual gene), location of human chromosome 7 CFSs compiled from the literature, location and expression status of nearby large genes. Zoom of selected portion indicates genomic characteristics and CNA positions in BJ and RPE1 cells. E Schematic indicating positions of aCNAs relative to large genes (with specific examples in RPE1 and summary for all large genes for two cell lines). F Proximity of random control sites or aCNAs to either all human CFS or cell line-specific CFS (RPE1-specific CFS taken from [33], BJ-specific CFS taken from [34]). Statistical tests compare all aCNA classes to in silico control CNAs using a one-way ANOVA Kruskal-Wallis test with post hoc Dunn’s correction
Fig. 5
Fig. 5
HU treatment generates a distinctive pattern of CNAs. A Replication timing of HU CNAs. B Proximity to large genes. C Proportion of hCNAs found within 1 Mb of a large gene. D Gene expression in 2 sMb windows around hCNA breakpoints. E Proximity of control sites or hCNAs to RPE1-specific CFS or all human ERFS. Statistical tests compare all hCNA classes to in silico control CNAs using a one-way ANOVA Kruskal-Wallis test with post hoc Dunn’s correction
Fig. 6
Fig. 6
Depletion of Mus81 in the presence of aphidicolin exacerbates the bias towards specific sites of large aCNAs. A Western blot to indicate loss of Mus81 protein in RPE1 cells after siRNA for 48 h. Vinculin was used as a loading control. B Immunofluorescence image of RPE1 cell going through anaphase, with ultrafine bridge, as detected by replication protein A (RPA70). C Quantification of segregation error rates in RPE1 in combination treatments of siControl, siMus81 with either DMSO or aphidicolin. D Quantification of occurrence of ultrafine bridges in anaphase cells. E Quantification of rates of micronuclei from cells treated as indicated. F Summary of CNAs identified in RPE1 cells after siRNA depletion of Mus81, combined with either DMSO or aphidicolin. G Rate of large CNAs occurring on chromosomes 1, 2, and 7 in RPE1 cells (in aphidicolin, or in aphidicolin after depletion of Mus81). H Summary of genomic features linked to aCNAs and hCNAs identified in this study

References

    1. Burrell RA, et al. Replication stress links structural and numerical cancer chromosomal instability. Nature. 2013;494:492–496. doi: 10.1038/nature11935. - DOI - PMC - PubMed
    1. Tamura N, et al. Specific mechanisms of chromosomal instability indicate therapeutic sensitivities in high-grade serous ovarian carcinoma. Cancer Res. 2020;80:4946–4959. doi: 10.1158/0008-5472.CAN-19-0852. - DOI - PubMed
    1. Ruiz S, et al. Limiting replication stress during somatic cell reprogramming reduces genomic instability in induced pluripotent stem cells. Nat Commun. 2015;6:8036. doi: 10.1038/ncomms9036. - DOI - PMC - PubMed
    1. Miron K, Golan-Lev T, Dvir R, Ben-David E, Kerem B. Oncogenes create a unique landscape of fragile sites. Nat Commun. 2015;6:7094. doi: 10.1038/ncomms8094. - DOI - PubMed
    1. Jones RM, et al. Increased replication initiation and conflicts with transcription underlie Cyclin E-induced replication stress. Oncogene. 2013;32:3744–3753. doi: 10.1038/onc.2012.387. - DOI - PubMed

Publication types